Centrix R75 Release Notes
- Jamie (Deactivated)
- Former user (Deleted)
- James Spencer
- Robert Hunt (Unlicensed)
New points alarm wizard
The Points Alarm Wizard has been completely re-worked in this release.
Significant changes have been made to both the configuration process and the algorithm/mathematics used to train the alarm thresholds.
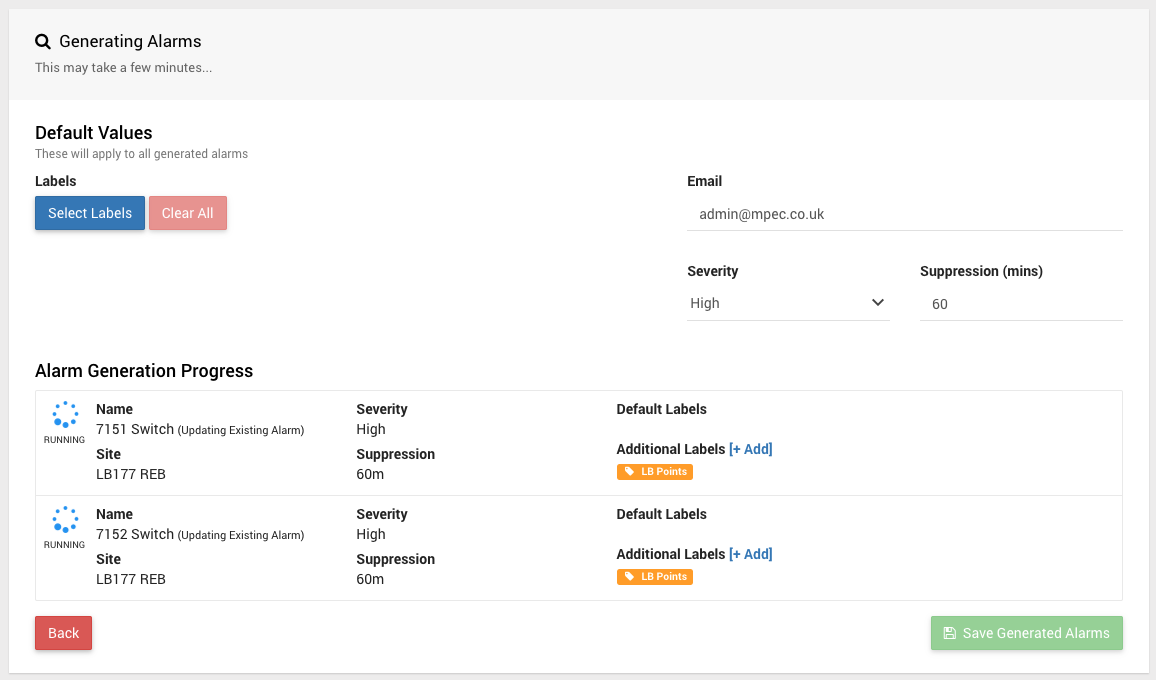
Simple, automatic process
Previously, a lot of user input could be required to remove bad data and select the desired thresholds.
Now, the wizard makes sensible choices to configure the most relevant/useful threshold conditions and remove anomalous data.
The wizard will automatically configure the following upper thresholds for each asset and swing direction;
- Average Value
- Duration
- Peak (Split) - see "Intelligent peak thresholding" below
Automatic data selection
The alarm wizard will automatically use recent data to train the alarm thresholds. There is no longer any need to provide a custom date range.
Data within maintenance windows will be removed automatically.
Bulk alarm calibration
The previous points alarm wizard provided functionality to train and configure one channel at a time. This could result in a lengthy process each time the alarm needed calibrating.
Now, you can select multiple assets to configure alarms for and they can all be configured in 2 simple steps.
Asset-driven data model
Using assets, the points alarm wizard now knows the types of points being configured. Based on this, the algorithm and thresholds are tuned specifically for the asset type being used.
Future enhancements of the asset domain will provide even more tuning of alarms and visualisation of performance data between comparable assets.
Intelligent peak thresholding
Previously, to alarm on the peak value for either Pressure or Motor Current traces, you would need to create an Episode that included the region for inspection.
Now, the training and processing algorithms will automatically;
- Exclude in-rush current for motor traces, or
- Include the movement (middle) region for pressure traces
So there is no need to configure episodes for your assets, unless you want to create manual threshold alarms on assets that don't fit the above model.
User guide
User guide is available here; Points Alarm Wizard.
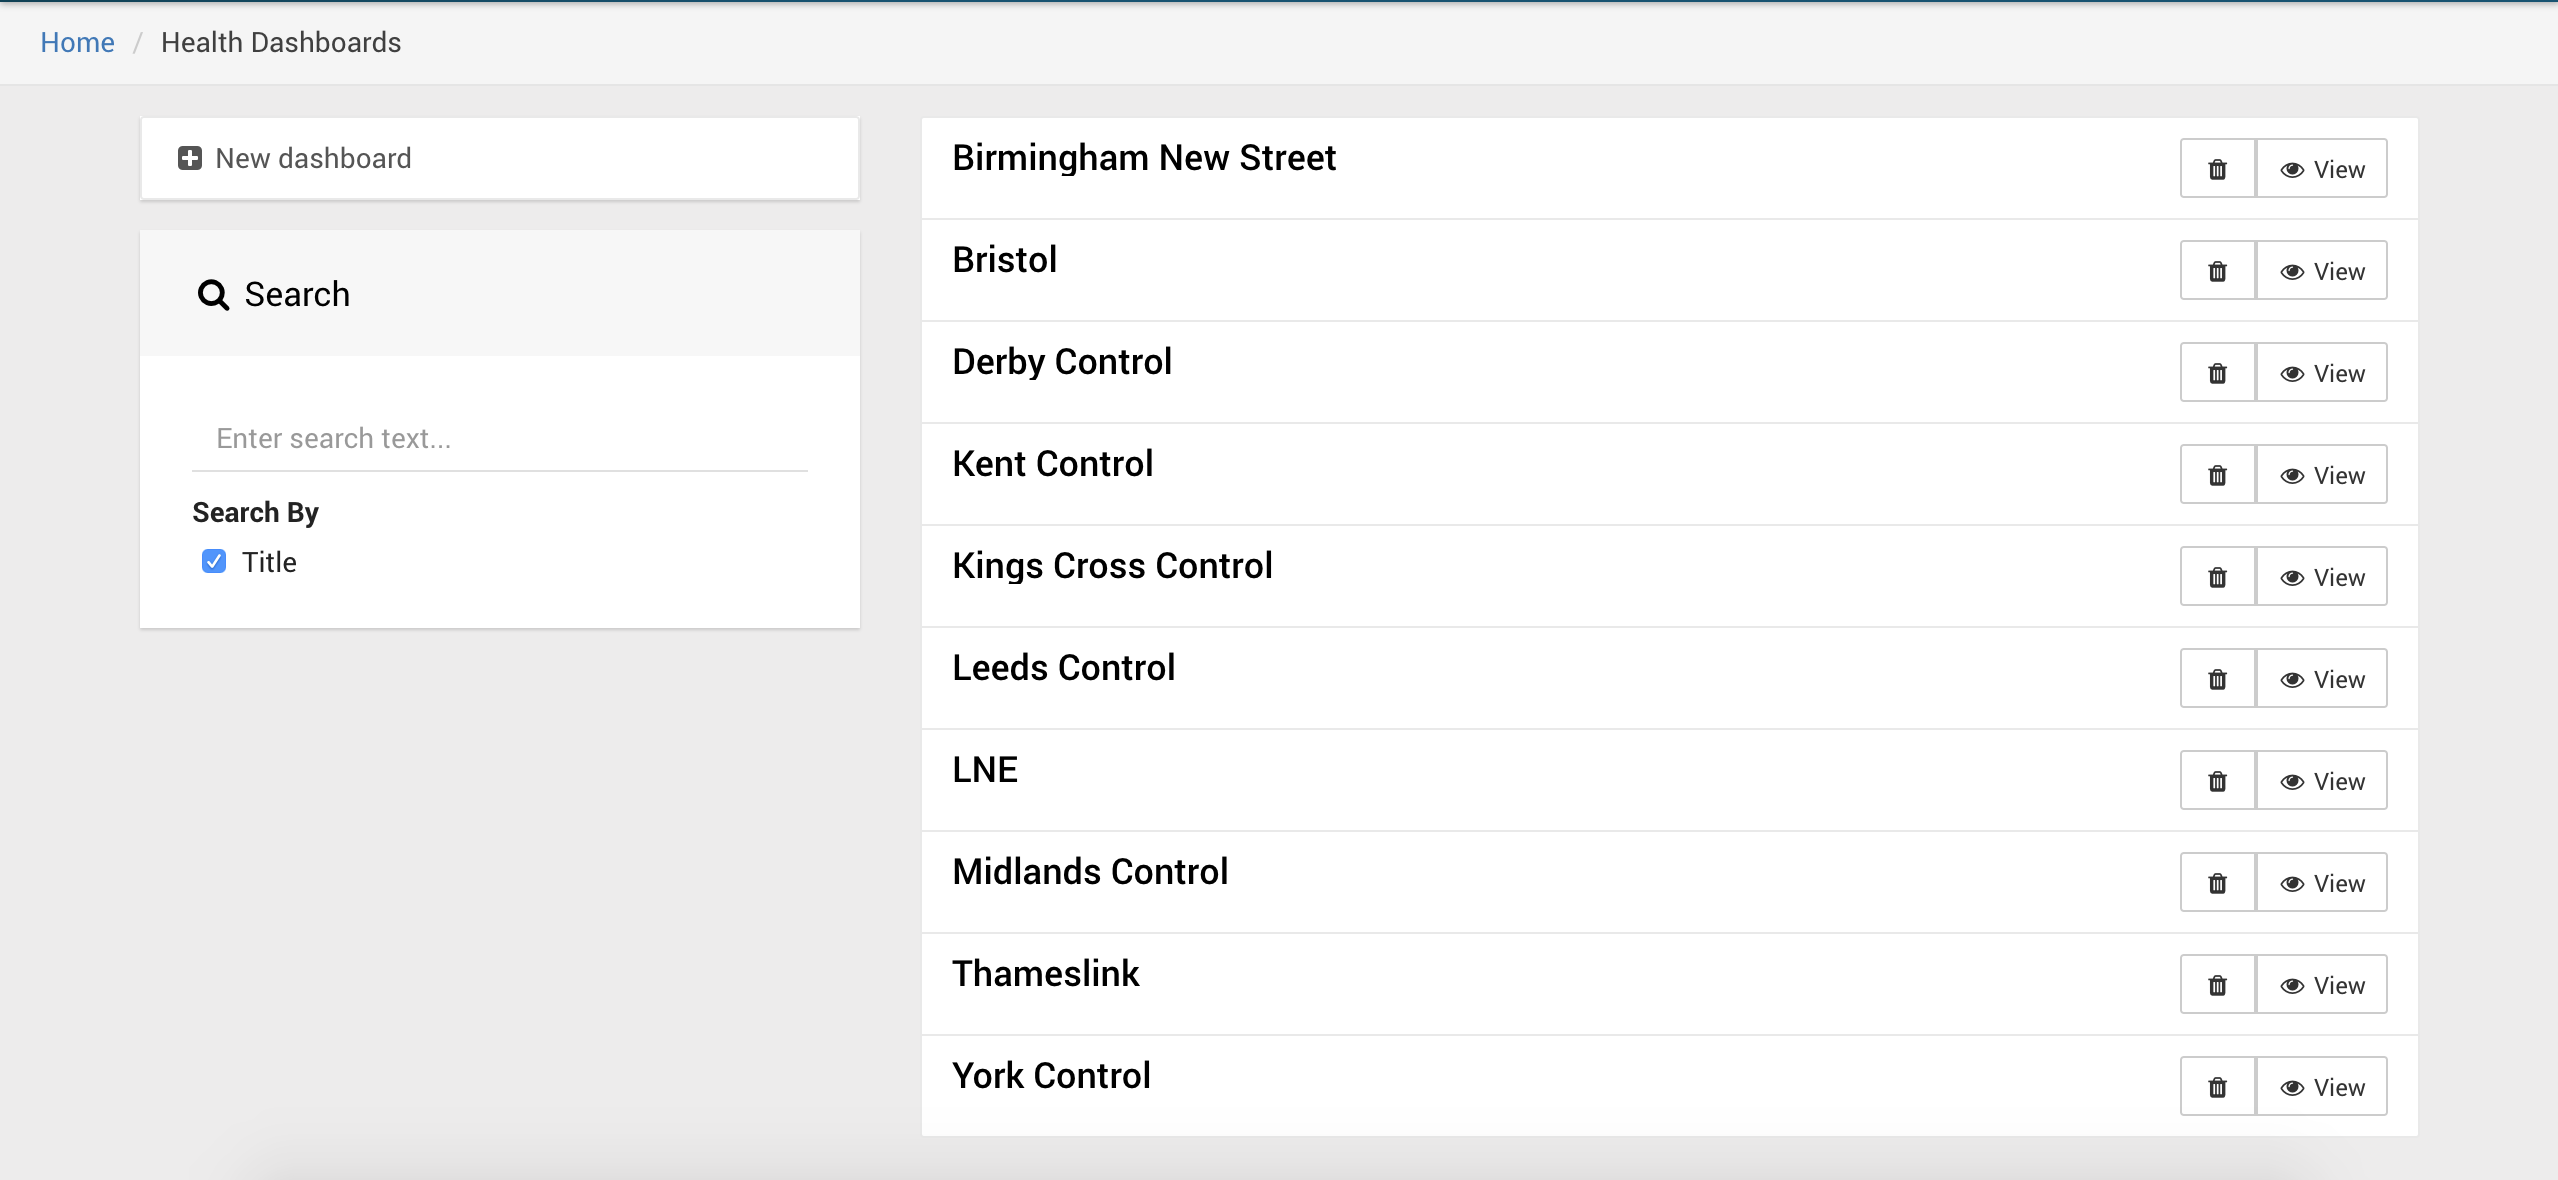
Health dashboard listing and removal
The Health Dashboards (Legacy) listing has now been enhanced to include searching by name. Also, you can now remove Health Dashboards (Legacy) that are no longer required.
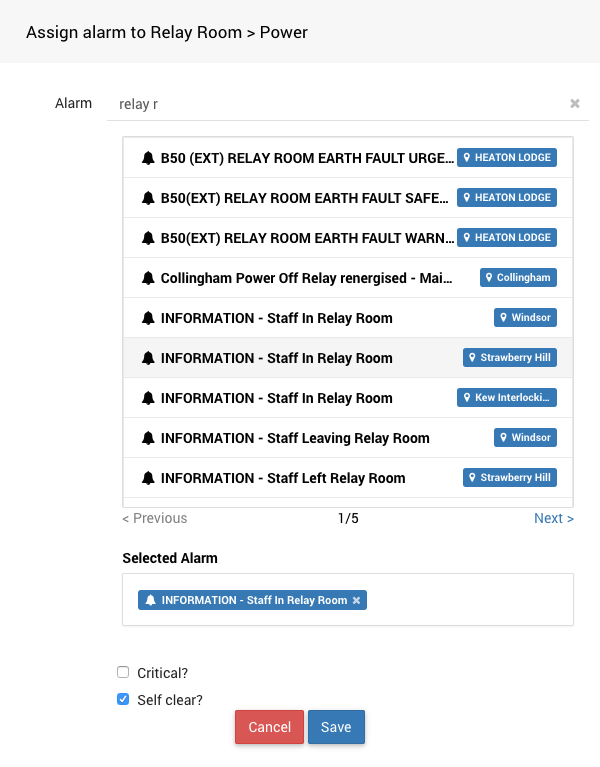
Health dashboard indication alarm selection
It is now easier to select alarms for health dashboard indications. The new selection control allows you to enter a search term to narrow down the list of available alarms to select from.
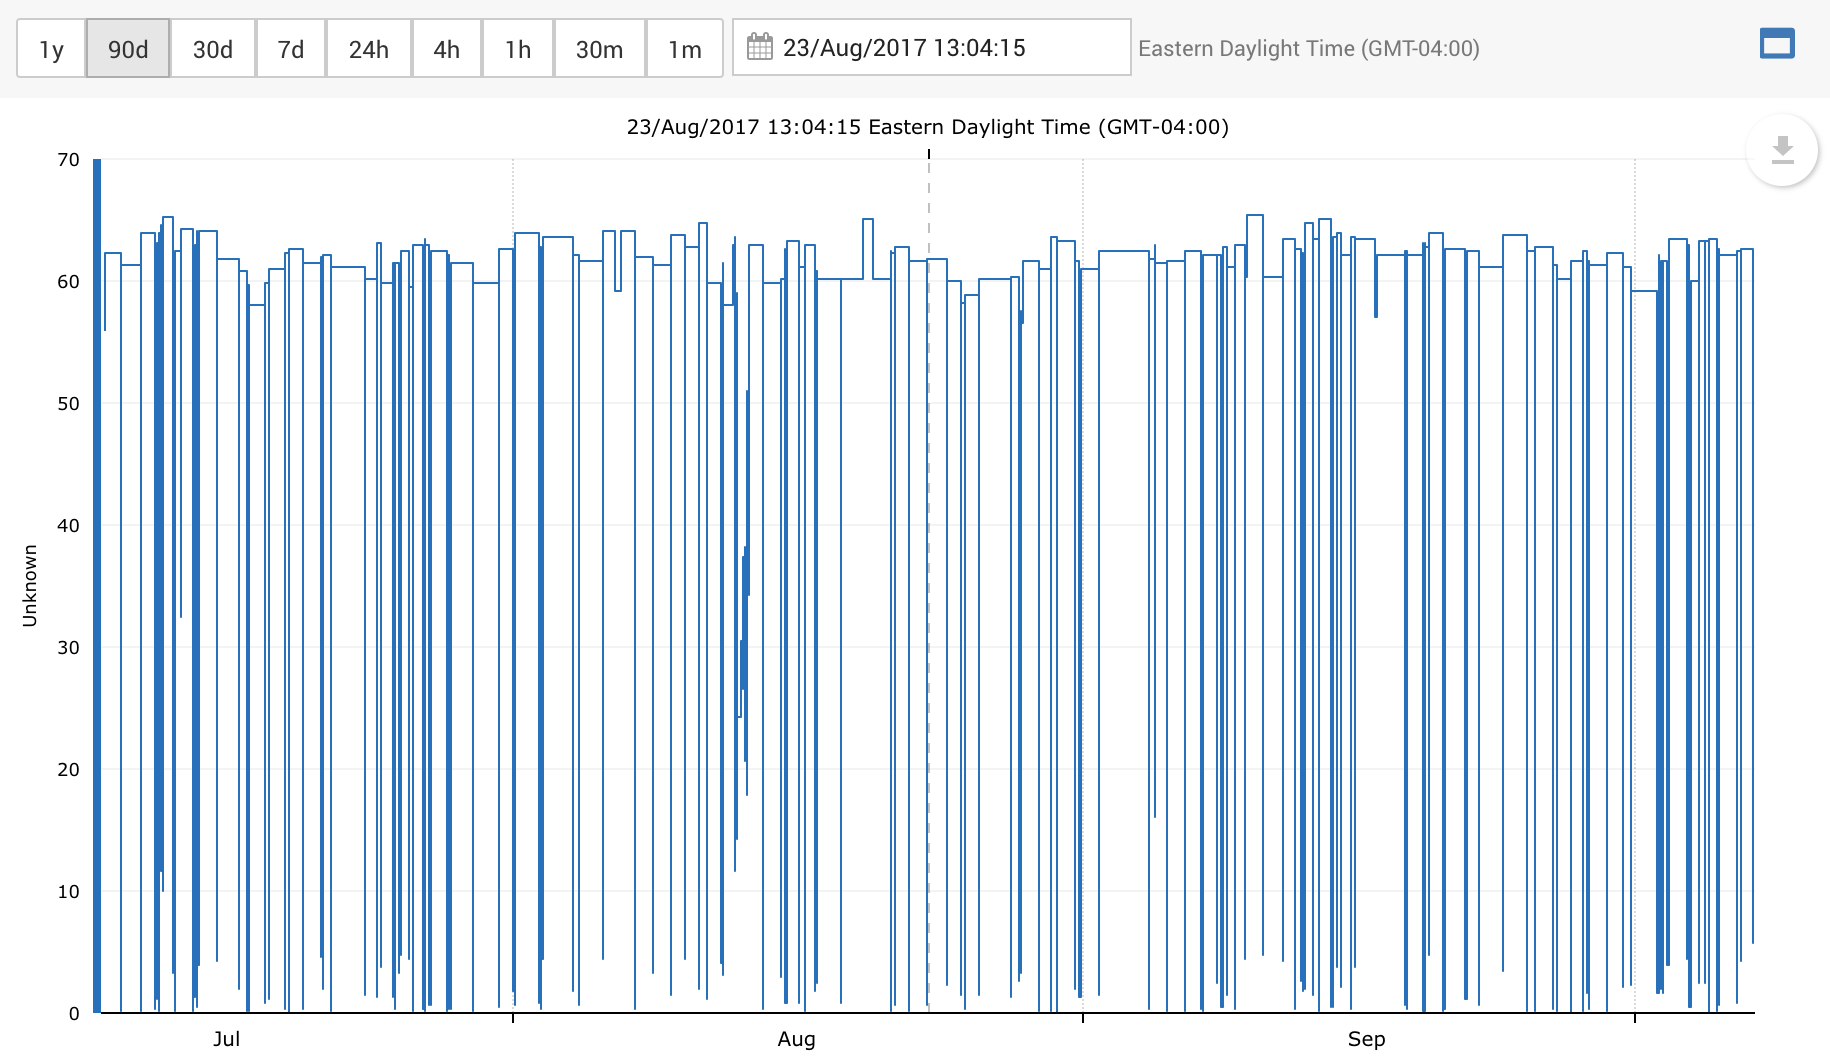
Trend switch features on problem page
The Problem Details Page for points alarms already contained a lot of context-specific information to help analyse the alarm. However, we have now also included a Trend graph, which allows you to see historical performance of the the switch up to, and after (if available) the time the alarm was raised.
Like the Histogram, you can select the time range, also you can select the feature (in the Parameters and Trigger Thresholds section of the page) you want to show on the graph, just like the existing graphs.
.png?version=2&modificationDate=1508846730000&cacheVersion=1&api=v2&width=640&height=400)
Graph enhancements
This release contains a number of enhancements to the new Graph page. This feature was marked as experimental, but this release completes the majority of functionality expected for a final feature release.
Times are now in site-local time
Prior to this release, the date/times shown on the graph, and when selecting a date/time were in your local time zone. This was inconsistent with the rest of Centrix, and also not useful when viewing data for sites in a time zone different to your own.
This release now uses the time zone of the site(s) of the channels displayed on the graph. With the following caveats/features;
- If there are channels from multiple sites attached to the graph, which are in different time zones, the most occurring time zone will be used.
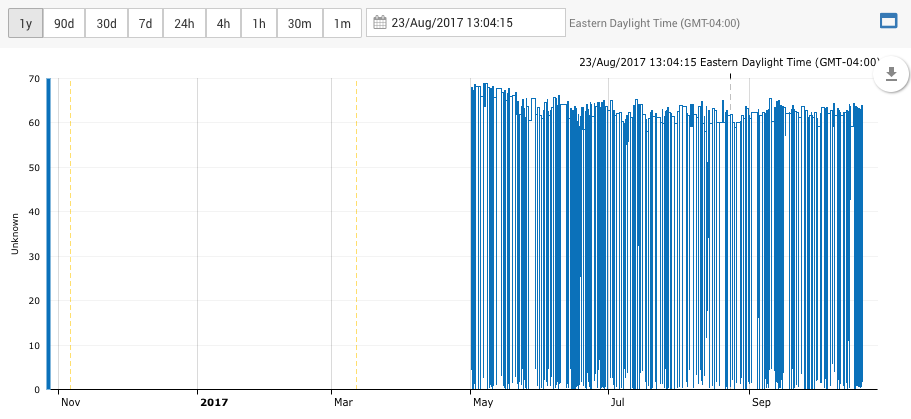
- Where relevant, the application of daylight saving time will be determined based on the selected date/time and will apply across the whole graph (even if DST changes occur within the time period).
- Daylight saving changes are indicated with a vertical yellow line.
Graph time window is now fixed based on user-selection
Prior to this release, the time window of the graph would clip to the available data set. Now, the extends of the graph will always fit the time window that was selected (i.e. 1y, 90d, 7d etc).
Note: The time window displayed is 50% before the selected time, and 50% after the selected time. Except where the time window would expand into the future, in this case the window is extended backwards.
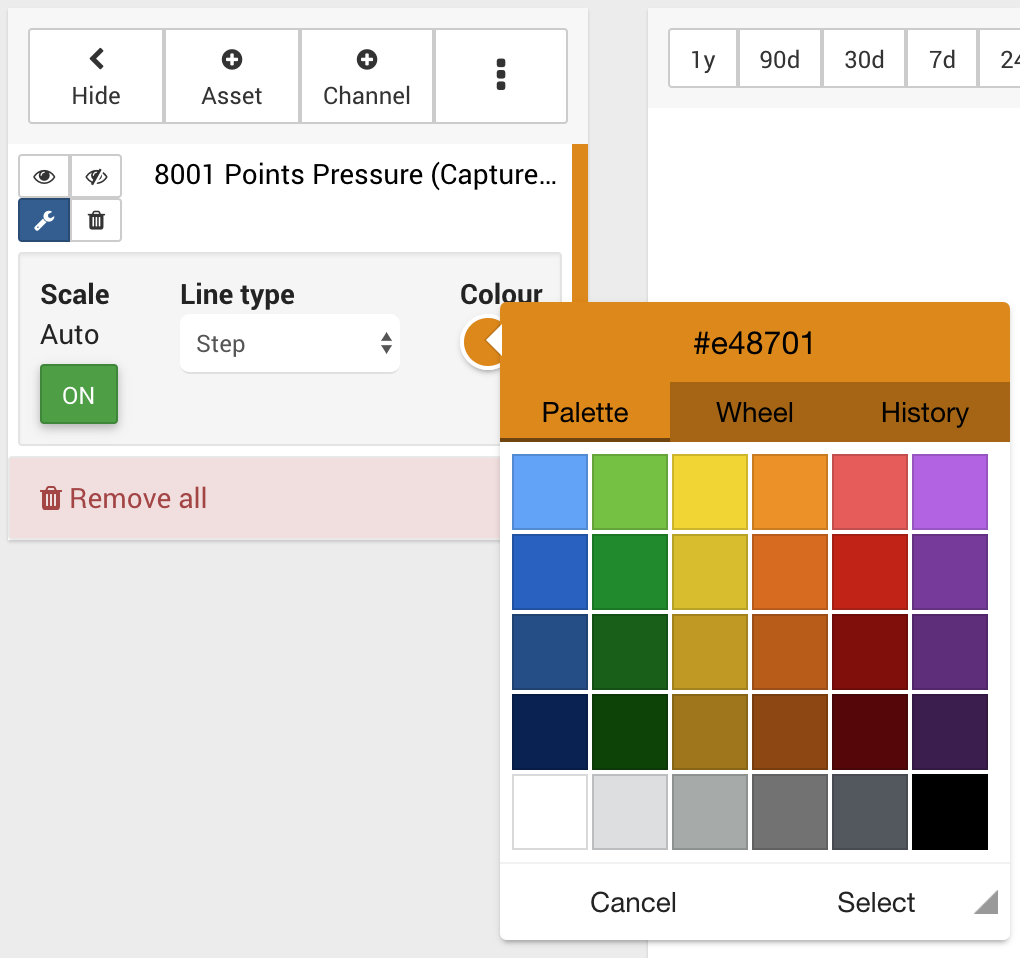
Colour of series can now be configured
You can now change the colour of a series on the graph. A default colour will be chosen for each new series, but this can now be changed to any desired colour from the provided palette.
Delete graphs from graph listing
Graphs can now be removed from the main Graph listing. Previously, you could only remove graphs through the Playback panel, even if the graph was created using the new Graph page.
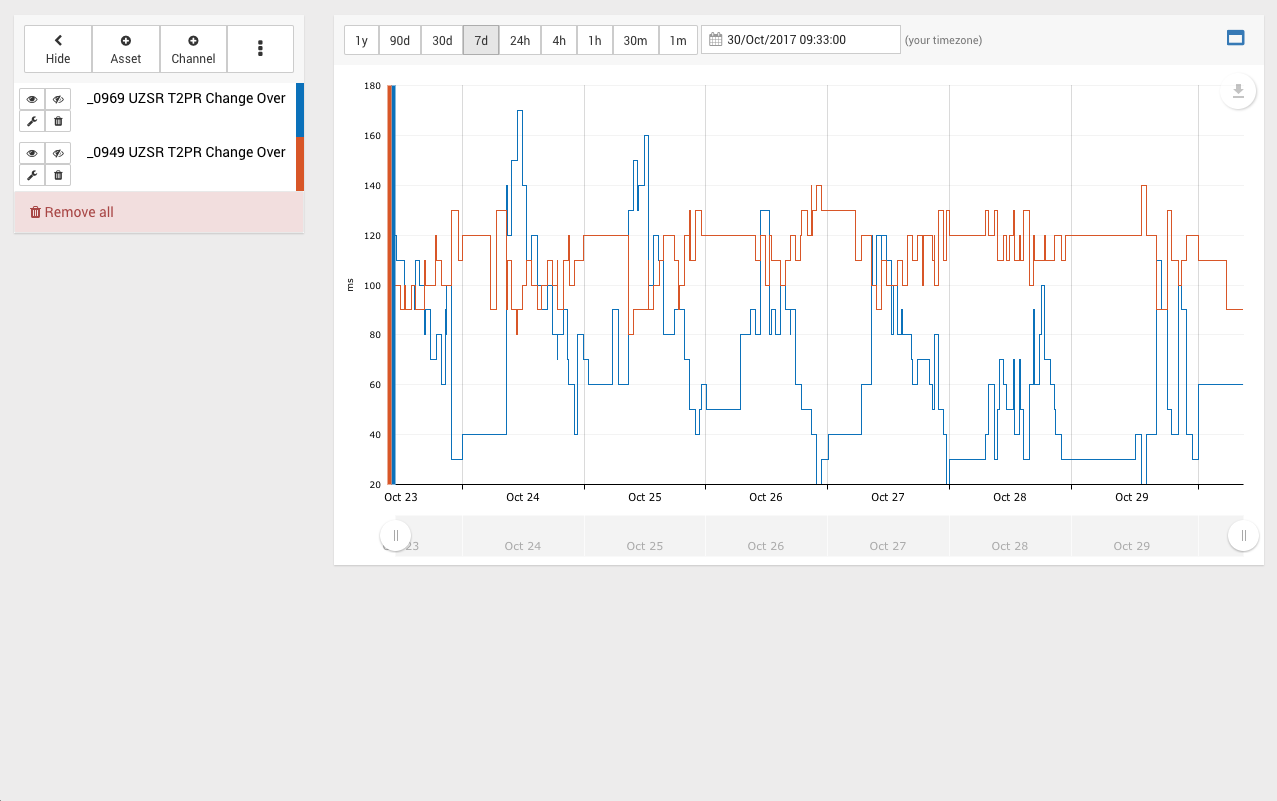
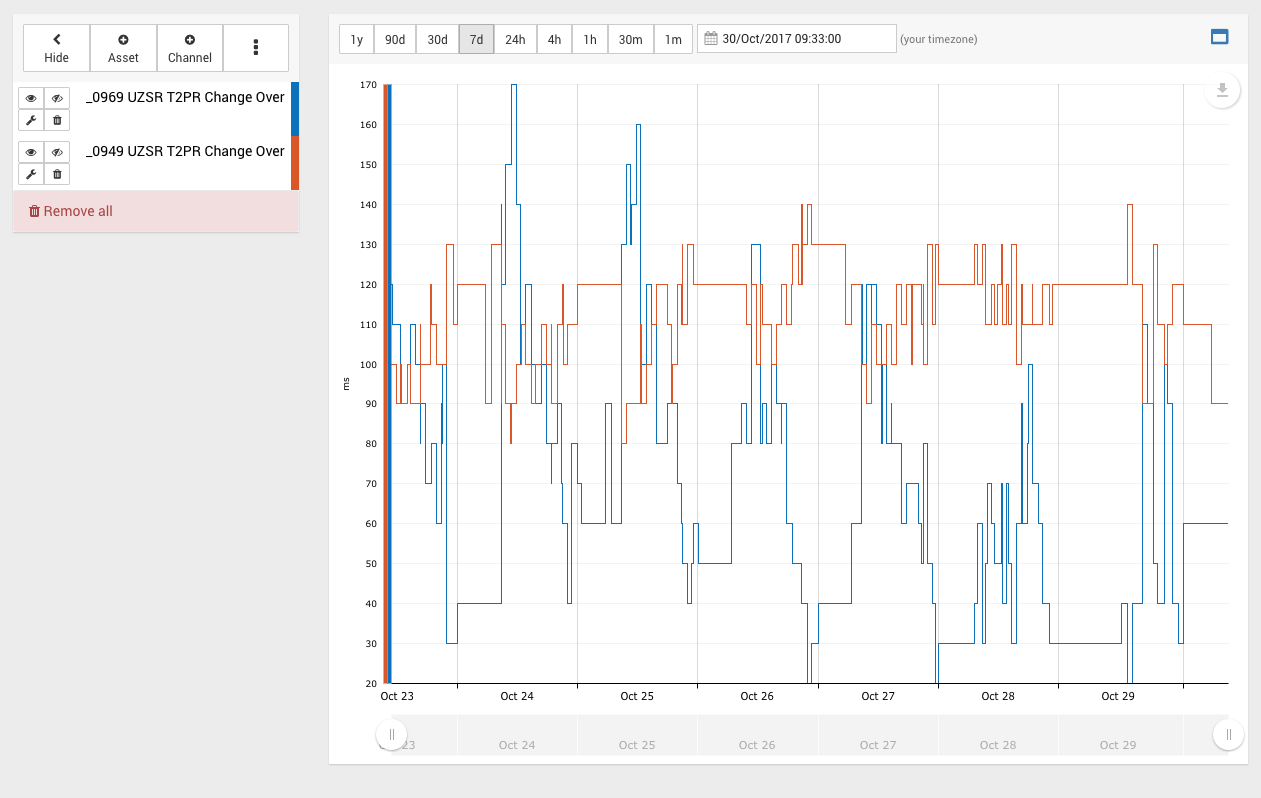
Graph now fills vertical space on screen
Previously, the graph had a fixed height on the page so no matter how large or small your screen is, the graph would not grow. Now, the graph will automatically stretch to fill the vertical space on the browser.
| Before | After |
|---|---|
|
|
Graph now indicates when there is no data
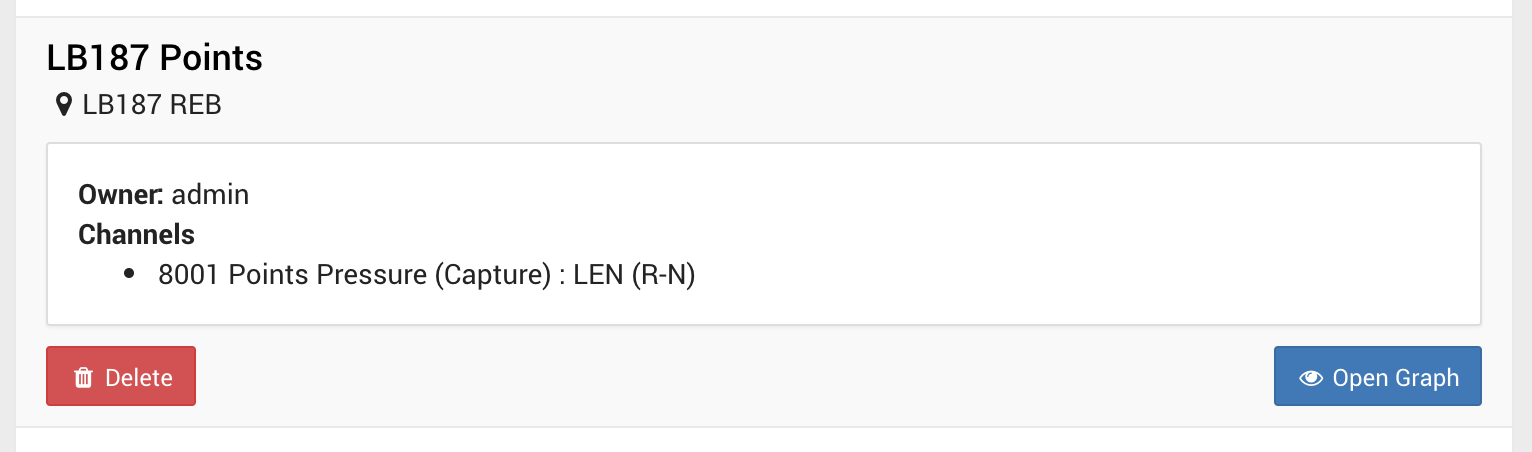
Previously, when viewing a graph with no data for the selected time range, a blank panel would be shown in place of the graph. Now, the graph appears but there will be no data shown.
Also, if a channel on a graph has no data at all, a message will be displayed next to the channel name.
%20(1).png?version=1&modificationDate=1509355711000&cacheVersion=1&api=v2&width=750&height=585)
Graphs with capture channels will now load
Previously, any existing graph that had Captures assigned would (silently) fail to load.
Note: Capture channels are still not supported on the new Graph component, however the graph will now load with the remaining analogue channels.
Improved graph zooming
The graph will now zoom to the region you have selected, rather than snapping to the nearest point.
Group selector replacement
Previously, form group input used the group selector shown below. However, we observed a number of usability issues with this component, so replaced it with our own selection component that had been introduced in other areas of the system.
.png?version=1&modificationDate=1509022683000&cacheVersion=1&api=v2&width=500&height=279)
Now, group selections uses the new, generic, selector;
.png?version=1&modificationDate=1509022902000&cacheVersion=1&api=v2&width=640&height=492)
.png?version=1&modificationDate=1509022987000&cacheVersion=1&api=v2&width=640&height=479)
Minor amendments & fixed issues
- Return to top link on listings didn't scroll page back to top as expected.
- Username field was disabled when creating a new user, removing ability to create new users.
- Sequence timing report failed to load for data sets with a very wide value range (usually due to anomalous data).
- It was not possible to create new assets from the map designer.
- Menu no longer contains duplicate items for "Assets" and "Captures" (note: "Captures" is now "Inspect")
- Certain groups could not be edited via the "User Admin" page.
- Fixed a bug where md5 hashed passwords were failing to update to use bcrypt hashing. Any user with a md5 hashed password would have been unable to login.