Centrix R78 Release Notes
Track circuit alarm wizard
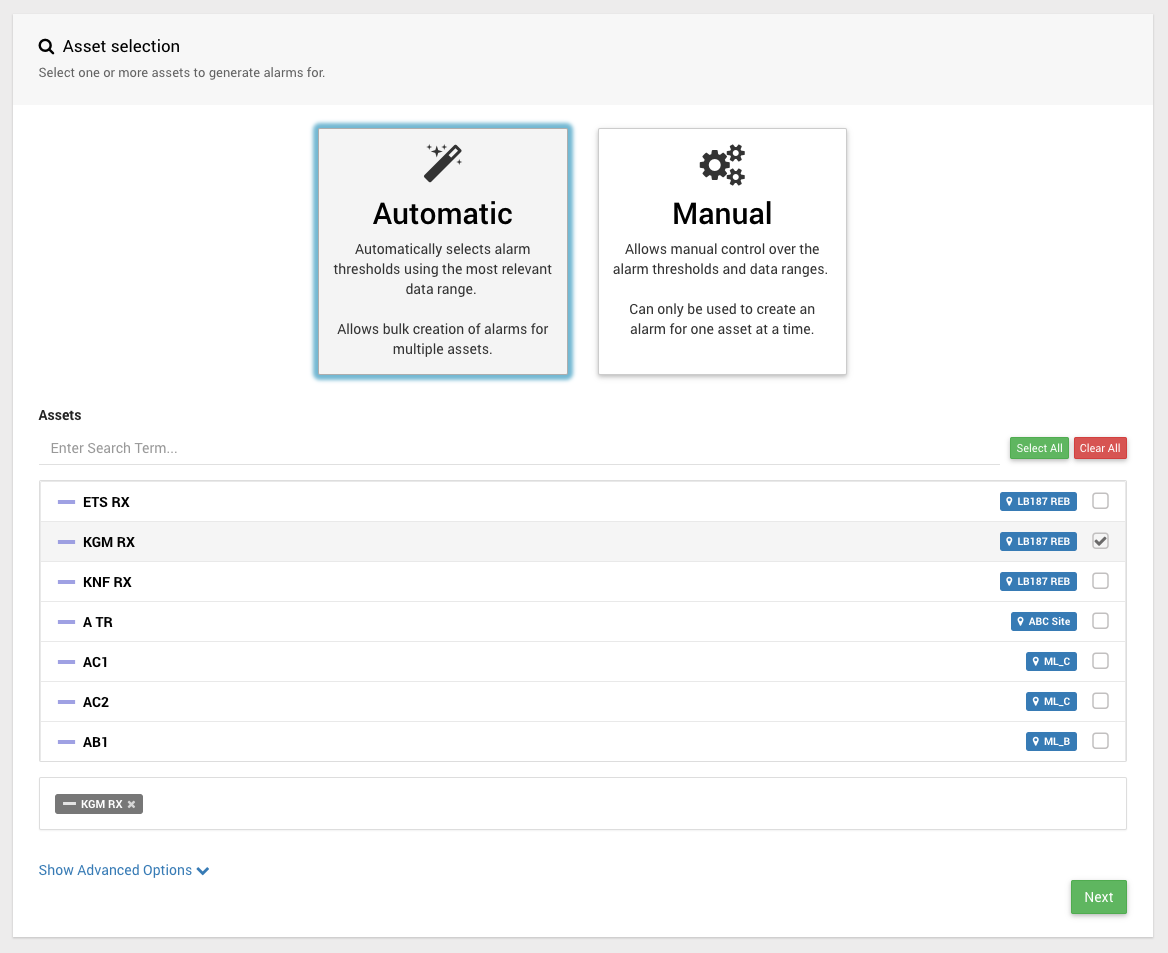
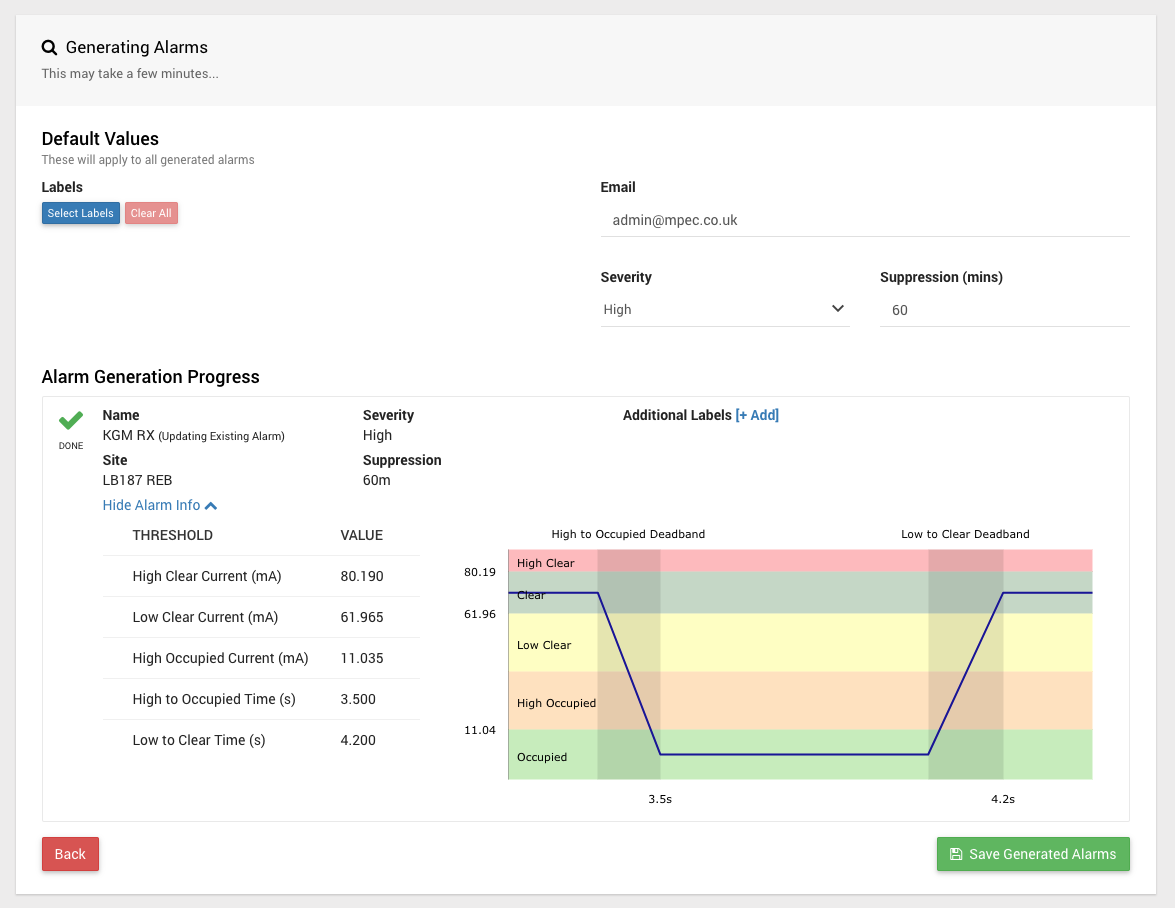
The track circuit alarm wizard has been updated to simply the process of configuring track circuit alarms.
The process is very similar to what has been adopted for the Points Alarm Wizard.
The new Automatic mode allows you to configure multiple assets in one process;
The Manual mode works similarly to the previous Track Circuit Alarm Wizard, however the process has been streamlined.
Visit Track Circuit Alarm Wizard for full usage documentation.
Points performance graph on Alarm Raise page
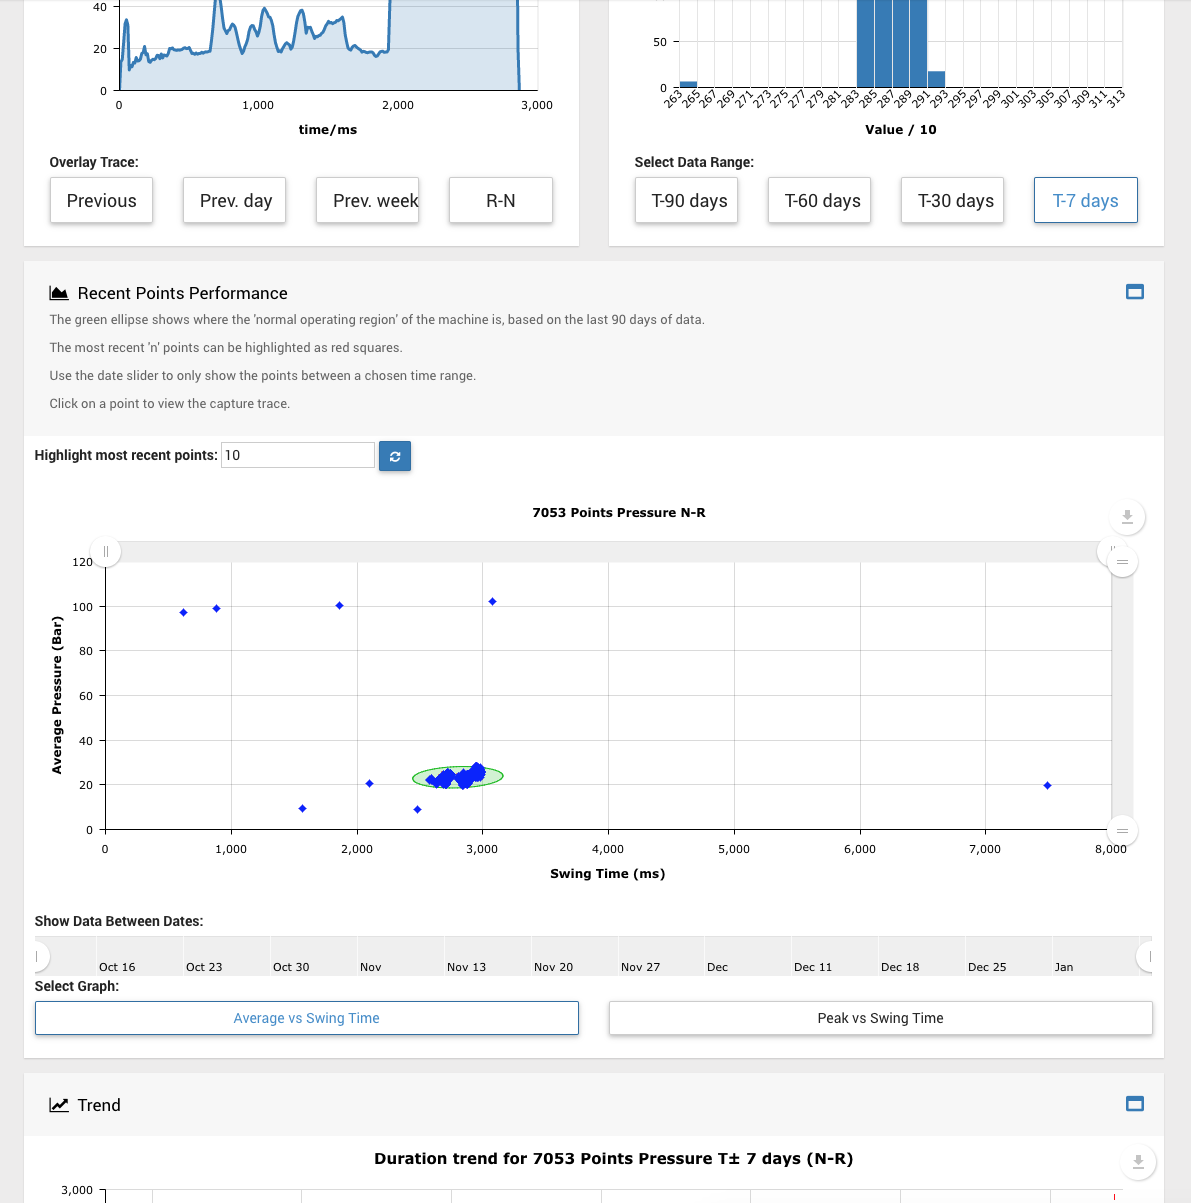
A new graph has been added to the Alarm Raise page for track switches associated with an asset.
For hydraulically actuated points machines (e.g. Clamp lock machines), the average or peak pressure (during the time switch blades are moving) is shown vs swing time for all the points data in the last 90 days prior to the alarm raise.
For electrically actuated points machines (e.g. HW machines), the average or peak current (excluding the inrush current) is shown vs swing time for all the points data in the last 90 days prior to the alarm raise.
A green ellipse is drawn over the data which shows the 'normal operating region' of the points machine, based on the last 90 days of data. Any points lying outside of this region may be subject to scrutiny.
Each point on the graph represents a single capture trace and can be clicked to show that capture trace. In this way, suspicious looking data points can easily be investigated.
A number of most recent points can be highlighted as red squares. This can be used to see if recent behaviour has drifted away from the normal behaviour.
Data points can be hidden and show using the date range slider below the graph. This can be used to visualise how the data points populated the graph over time.
Points performance report
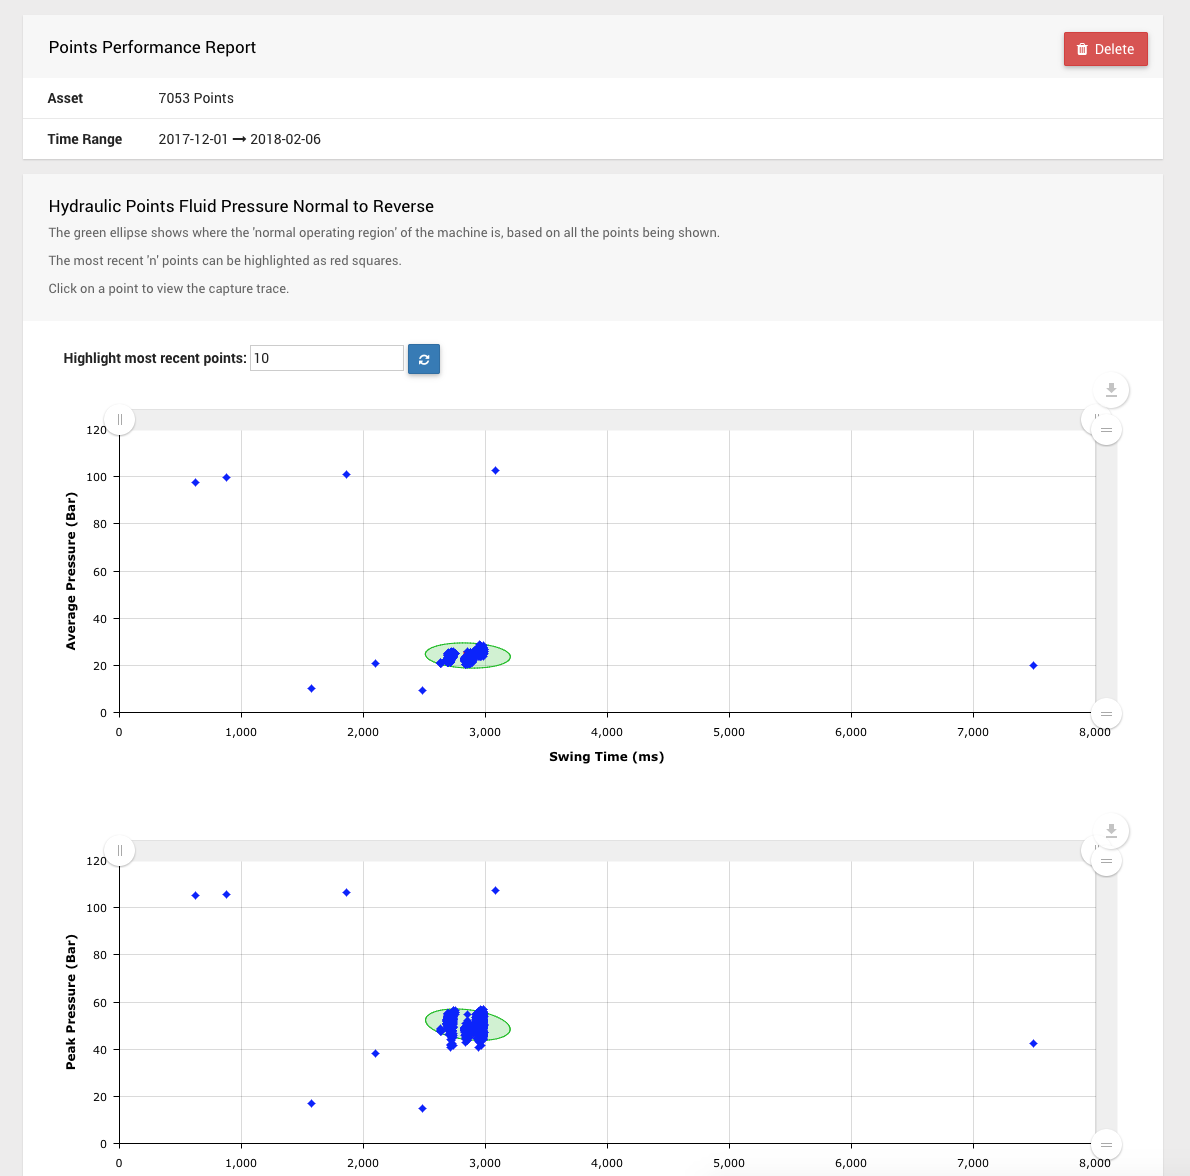
The points performance report generates new graphs, in a similar manner to the Alarm Raise page, shown above.
There are graphs for hydraulic fluid pressure and electric current for hydraulic points, and electric current for electric points.
The average vs swing time and peak vs swing time graphs are plotted one below the other and the recent points selector and date range slider affect both graphs.
Separate graphs are shown for the normal to reverse direction and the reverse to normal direction.
The green shaded ellipse overlaid on the data shows the typical performance region for the points machine.
Lower limit on track circuit flick alarm
The track circuit alarm detects flicks through the configuration of an expected minimum occupation time of the track.
We have added the ability to ignore flicks with durations below a configured threshold, in addition to the existing upper threshold.
For example, if you wanted to only capture cases where the track changed state between 0.5 and 3 seconds, you would configure;
- Flick duration lower limit: 0.5s
- Flick duration upper limit: 3s
To maintain the previous functionality, set the lower limit to zero.
Minor amendments and fixed issues
- Reports can be deleted.
- Health dashboard stays in full screen mode, if in full screen mode, when navigating between dashboard pages.
- Improved detection of failed reports.
- Report listing now differentiates "Generating" and "Pending" states.
- Pending reports (those waiting for a report executor thread), will be coloured orange.
- Generating reports (those currently running), will be coloured blue.
Bug fixes
- Fixed: No graphs on state transition counts report.
- Fixed: Table data overflowing card width on state transition counts report if more than 12 columns.
- Fixed: Site could not be saved if it belonged to a group you are not a member of.
- Fixed: Groups did not show up on site listing for sites that belong to a group you are not a member of.
- Fixed: Links on health dashboards had a higher Z-order than links on the main menu, restricting access to some main menu items when viewing a health dashboard.
- Fixed: Can't save points alarm from manual alarm wizard
- Fixed: Manual mode on points alarm wizard loaded incorrect data set for the R-N direction.


