Centrix R88 Release Notes
- Robert Hunt (Unlicensed)
- Former user (Deleted)
- James Spencer
- Tom Forster
Asset Updates
Over the next few releases, we aim to make Assets much more powerful and central to the Centrix workflow.
For example, searching for things should have the option of searching by Asset as well as by Site and then Channel.
Alarms should be linked to an asset. This would allow for more sophisticated logic and analysis to be done when an alarm raises. Prior to this release, only Points Alarms and Track Circuit Alarms have been linked to Assets (when created via the Alarm Wizards).
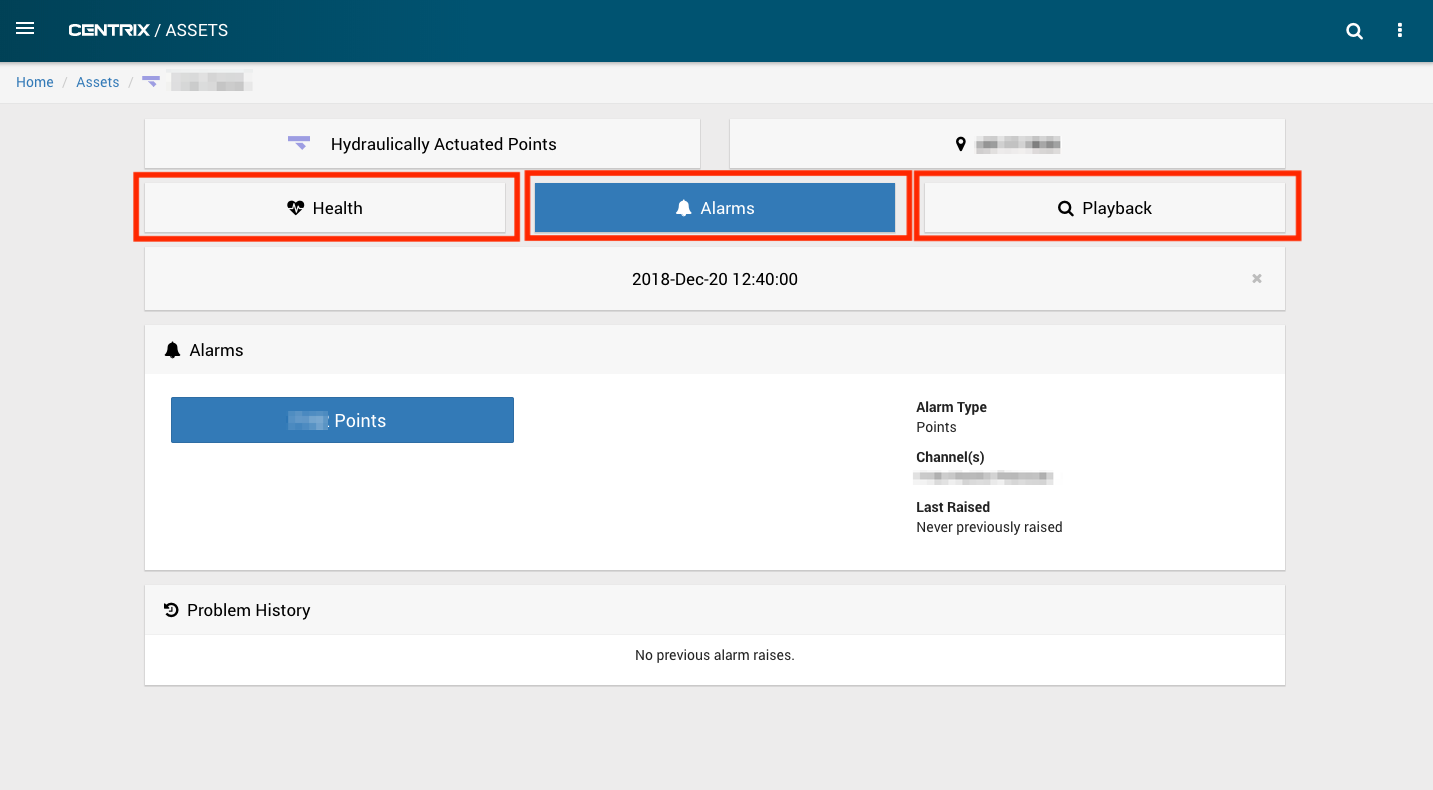
This release splits the asset view page into multiple tabs: Health, Alarms and Playback. This speeds up each individual tab and allows a user to focus on the one aspect they are interested in.
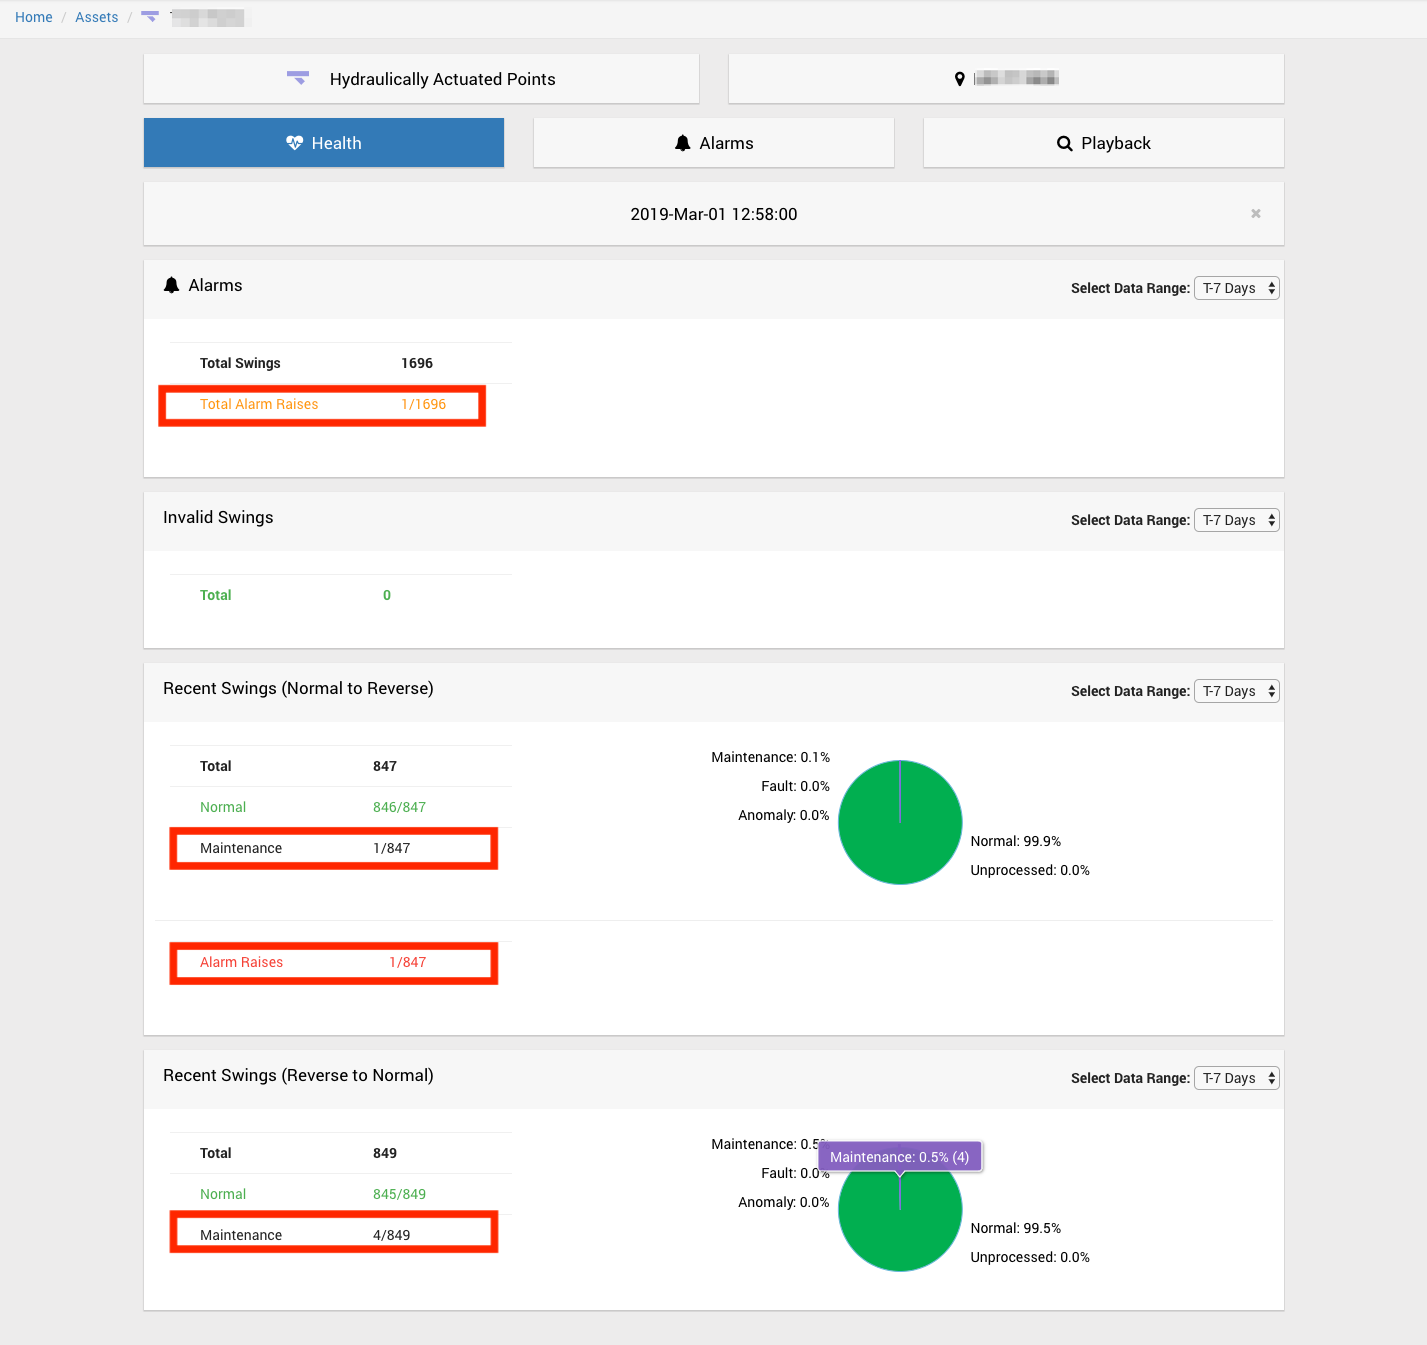
Asset Health Tab
The Health tab is designed to be a high level overview of the Health of an asset. As a bare minimum, this shows the number of alarms which have been thrown by the asset in the last x days.
Until all of the alarm types are linked to assets, this page will not be useful for many assets.
However, for something like a Hydraulic or Electric Points asset, Centrix shows a more detailed breakdown of the Asset's health (based on alarms and the tags applied to the capture traces). A user can click on many of the numbers to view the capture traces or the specific alarm raise pages.
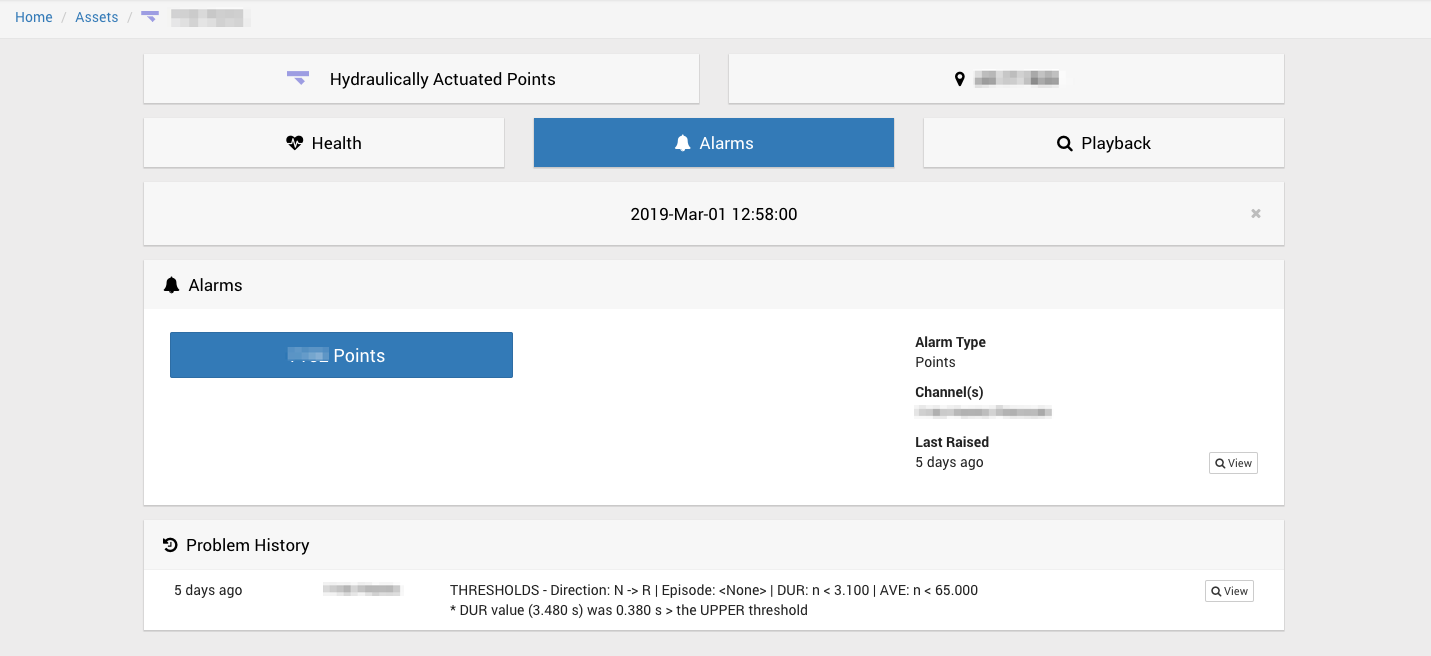
Asset Alarms Tab
This tab allows a user to solely focus on recent alarm raises on the asset. If an alarm has been raised, the user can jump straight to the alarm raise page.
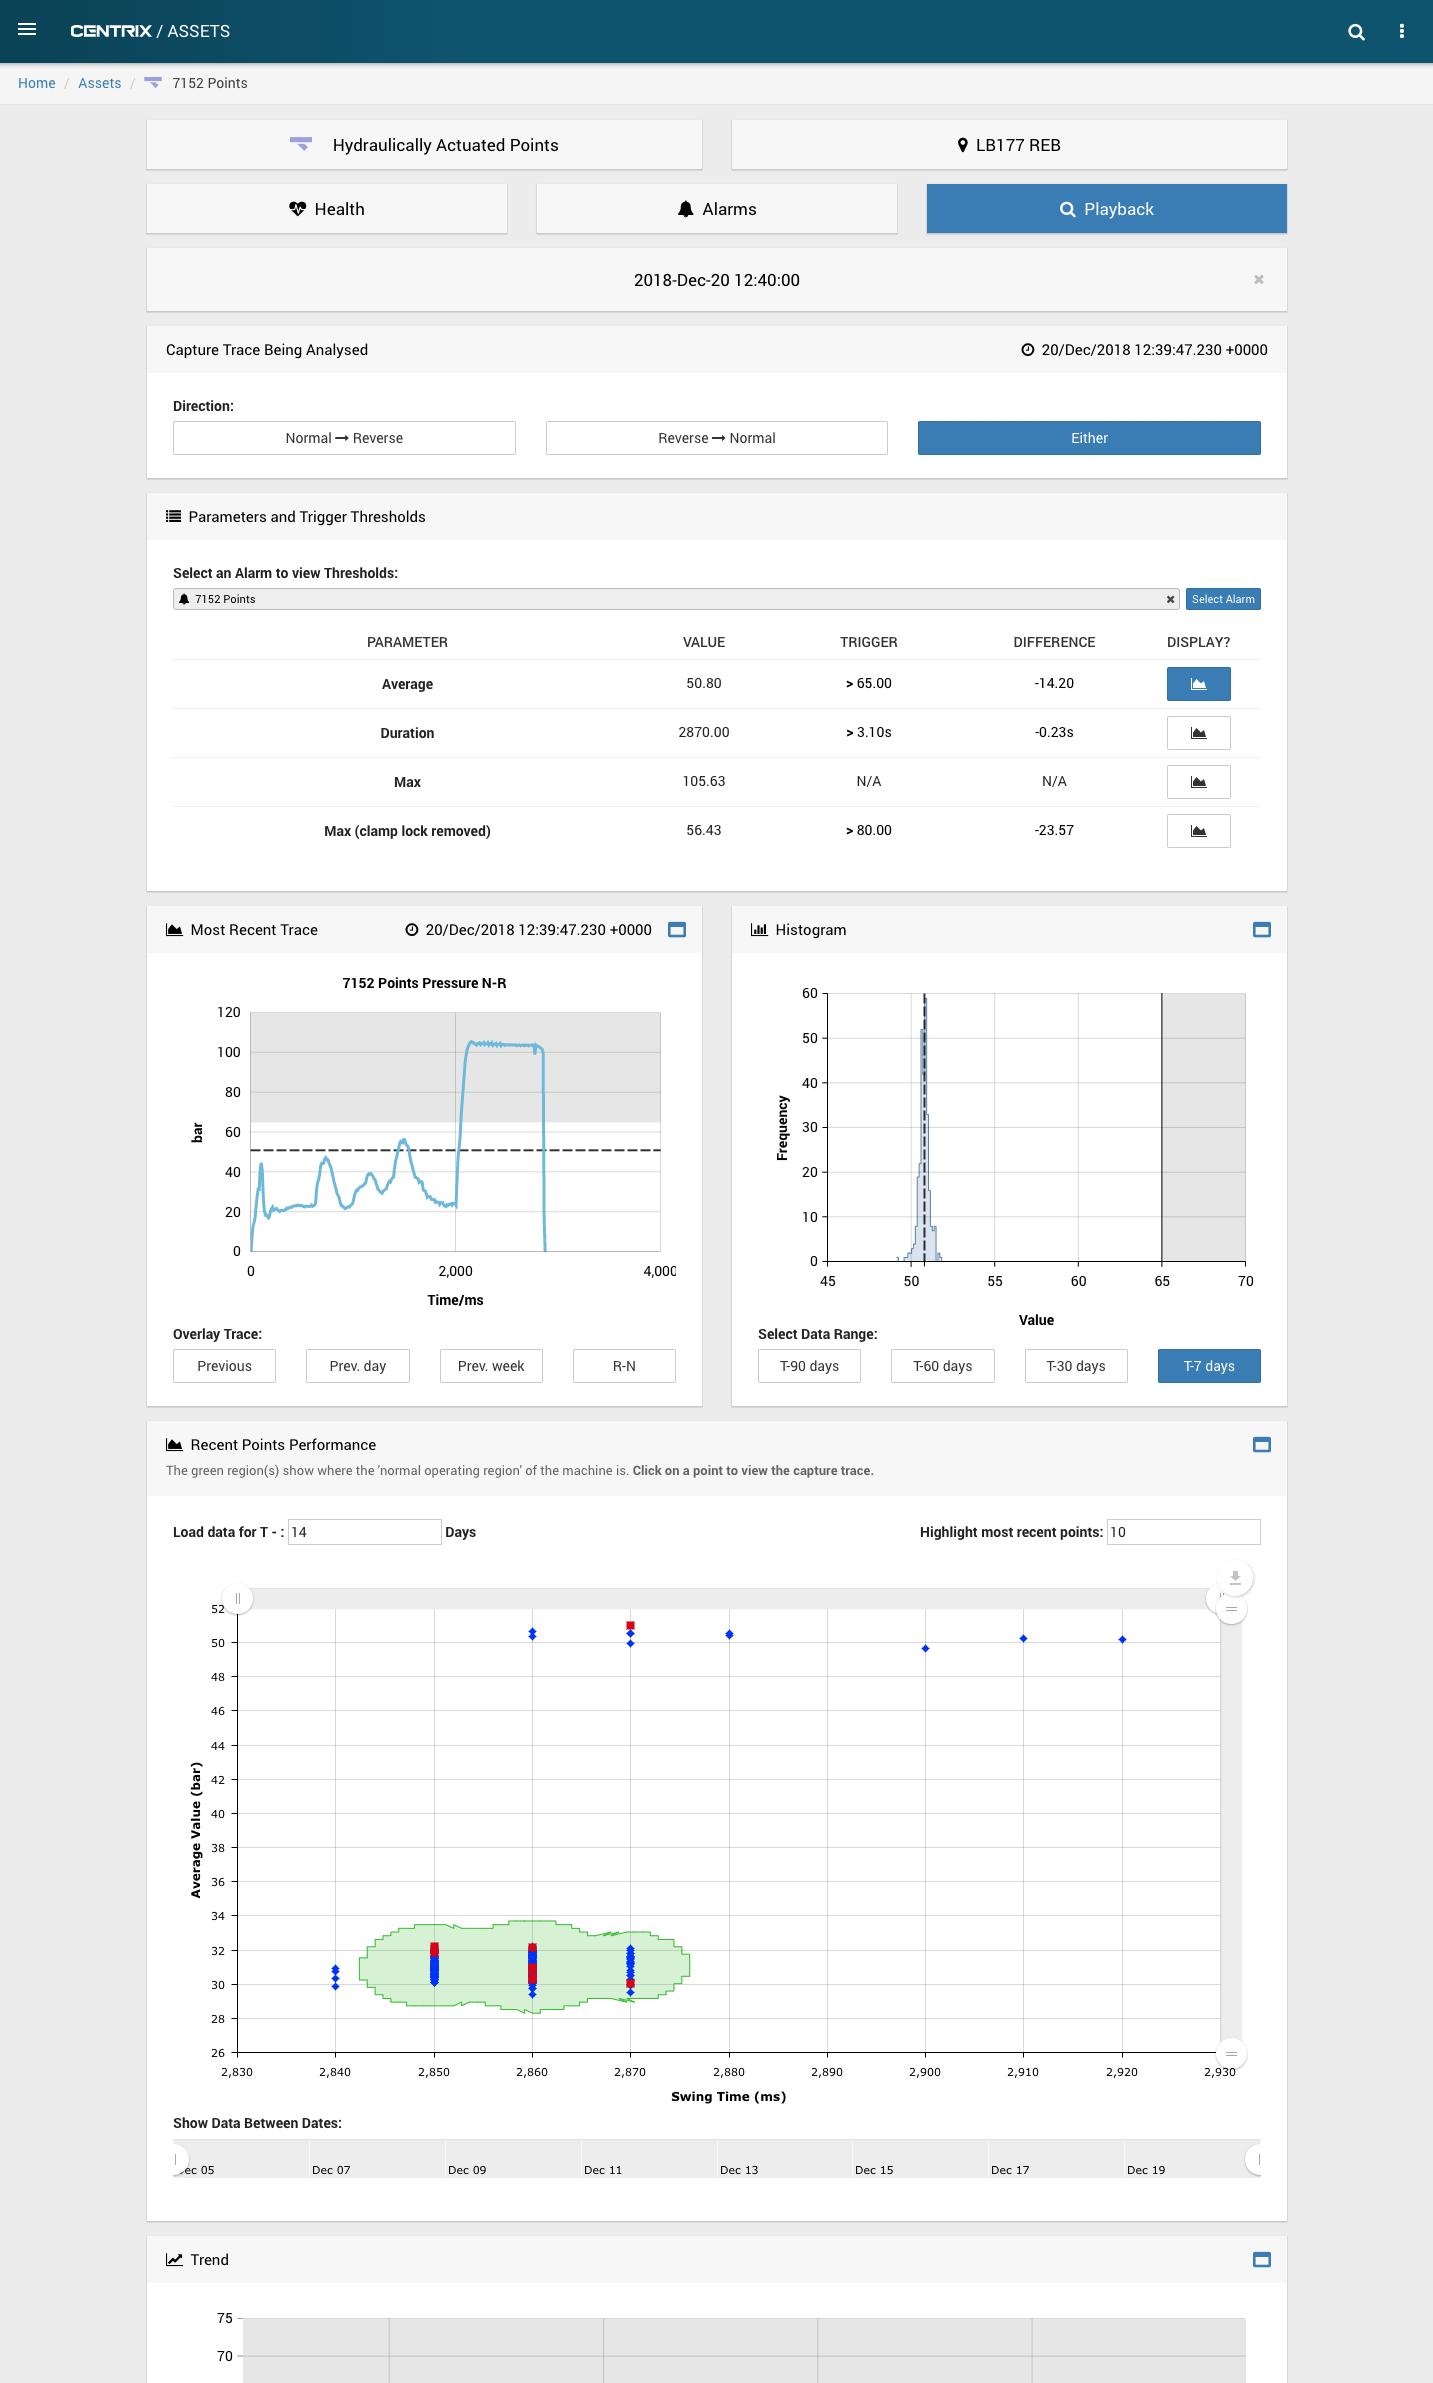
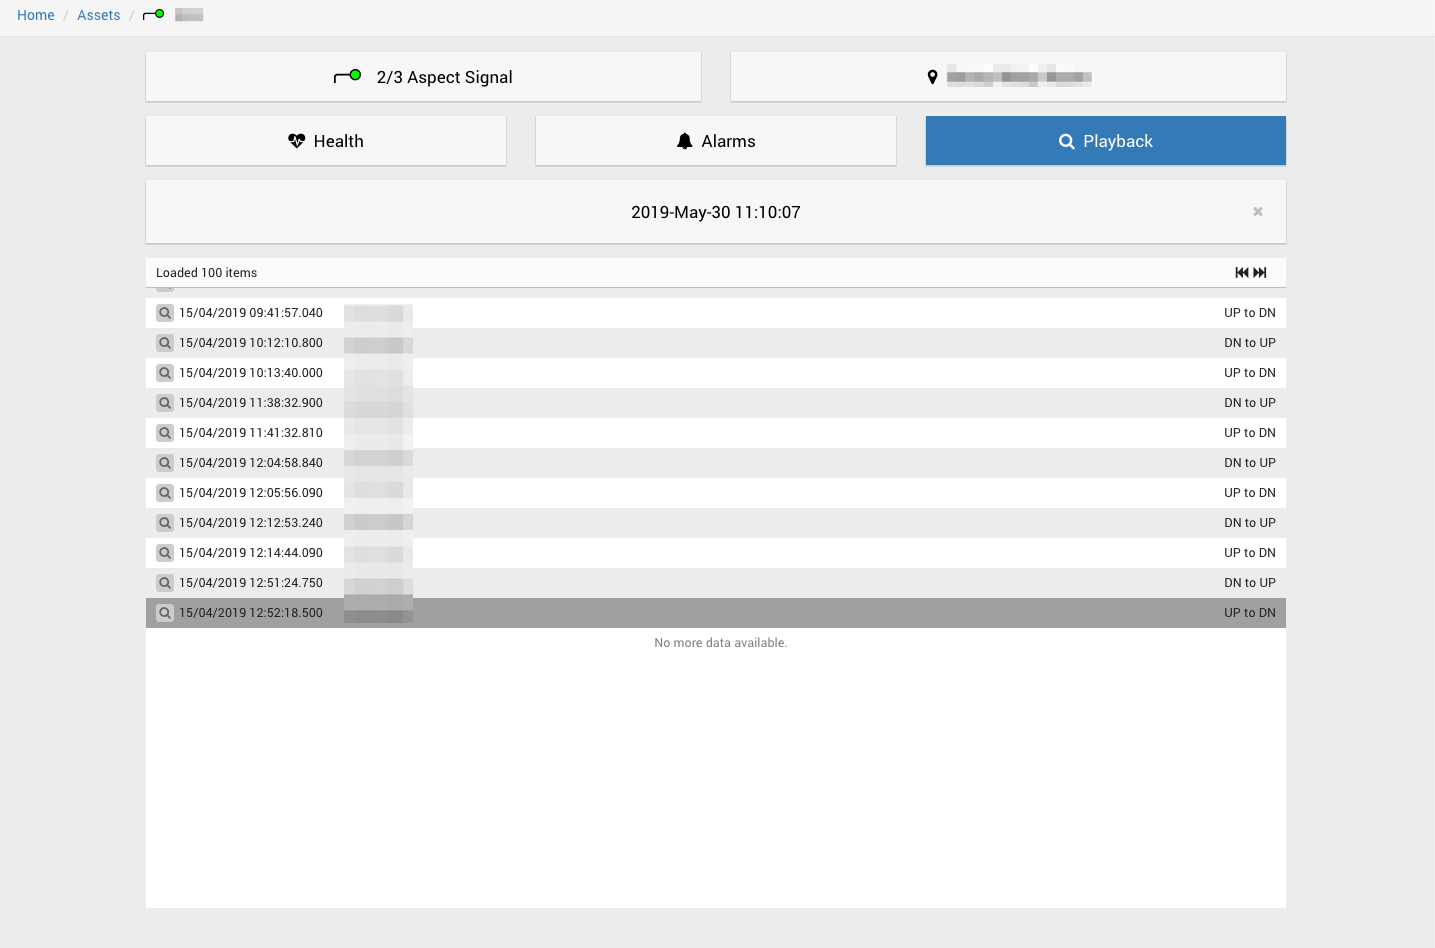
Asset Playback Tab
The playback tab is designed to give an in depth analysis of an asset, it's most recent events and how most recent behaviour compares to historical behaviour.

For Asset types where Centrix does not have any in depth graphs to show yet, it instead shows the most recent events which have come in from the assets channels - just like the Inspect > Events page.
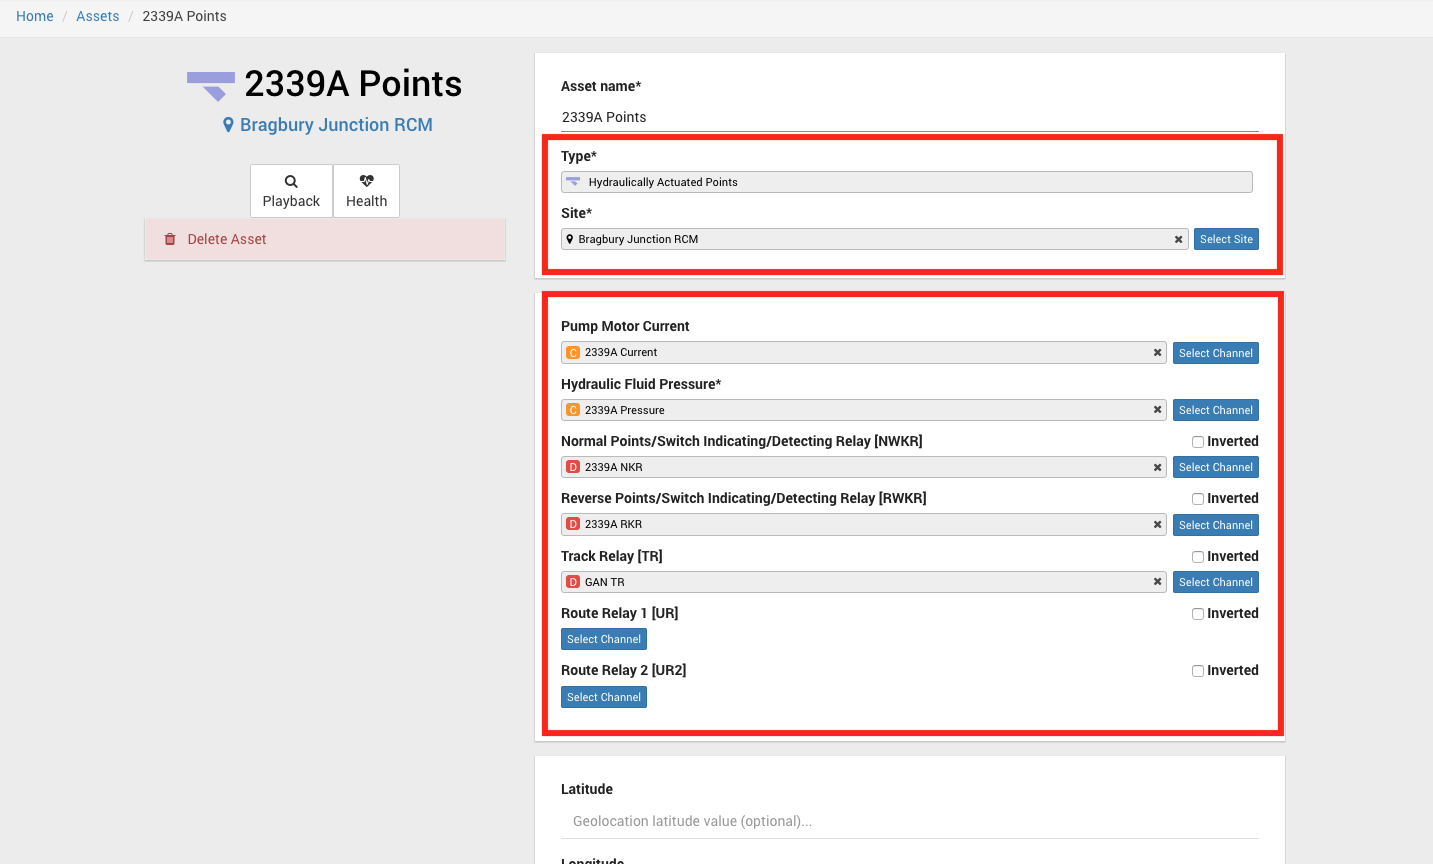
Asset Edit Page
All of selectors (Type, Site and Channels) are now more consistent with the rest of the selectors in Centrix.
You are no longer allowed to change the Asset Type of an existing Asset. This is to protect existing assets and alarms associated with those assets.
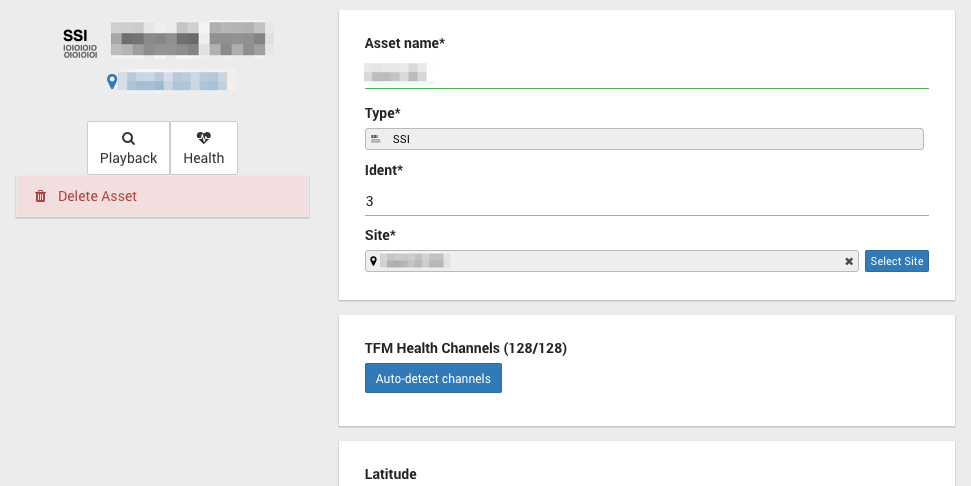
SSI Asset
A new SSI Asset type has been added. This represents a collection of TFM health channels sent by a logger monitoring an SSI.
In order to create an SSI asset, all that is required is the site name and the SSI ident. Required channels can be automatically detected if available.
The new SSI Asset allows for historical replay of data link health. This makes it simple to check for inconstancies between the data links or other communication issues.
SSI comms health data is received by Centrix every 10 minutes, as a percentage of successful messages sent over that period. Each grid cell represents the lowest percentage comms health over a one hour period. Green cells indicate zero communication loss, colours between yellow and red indicate 99.9% - 0% communication loss.
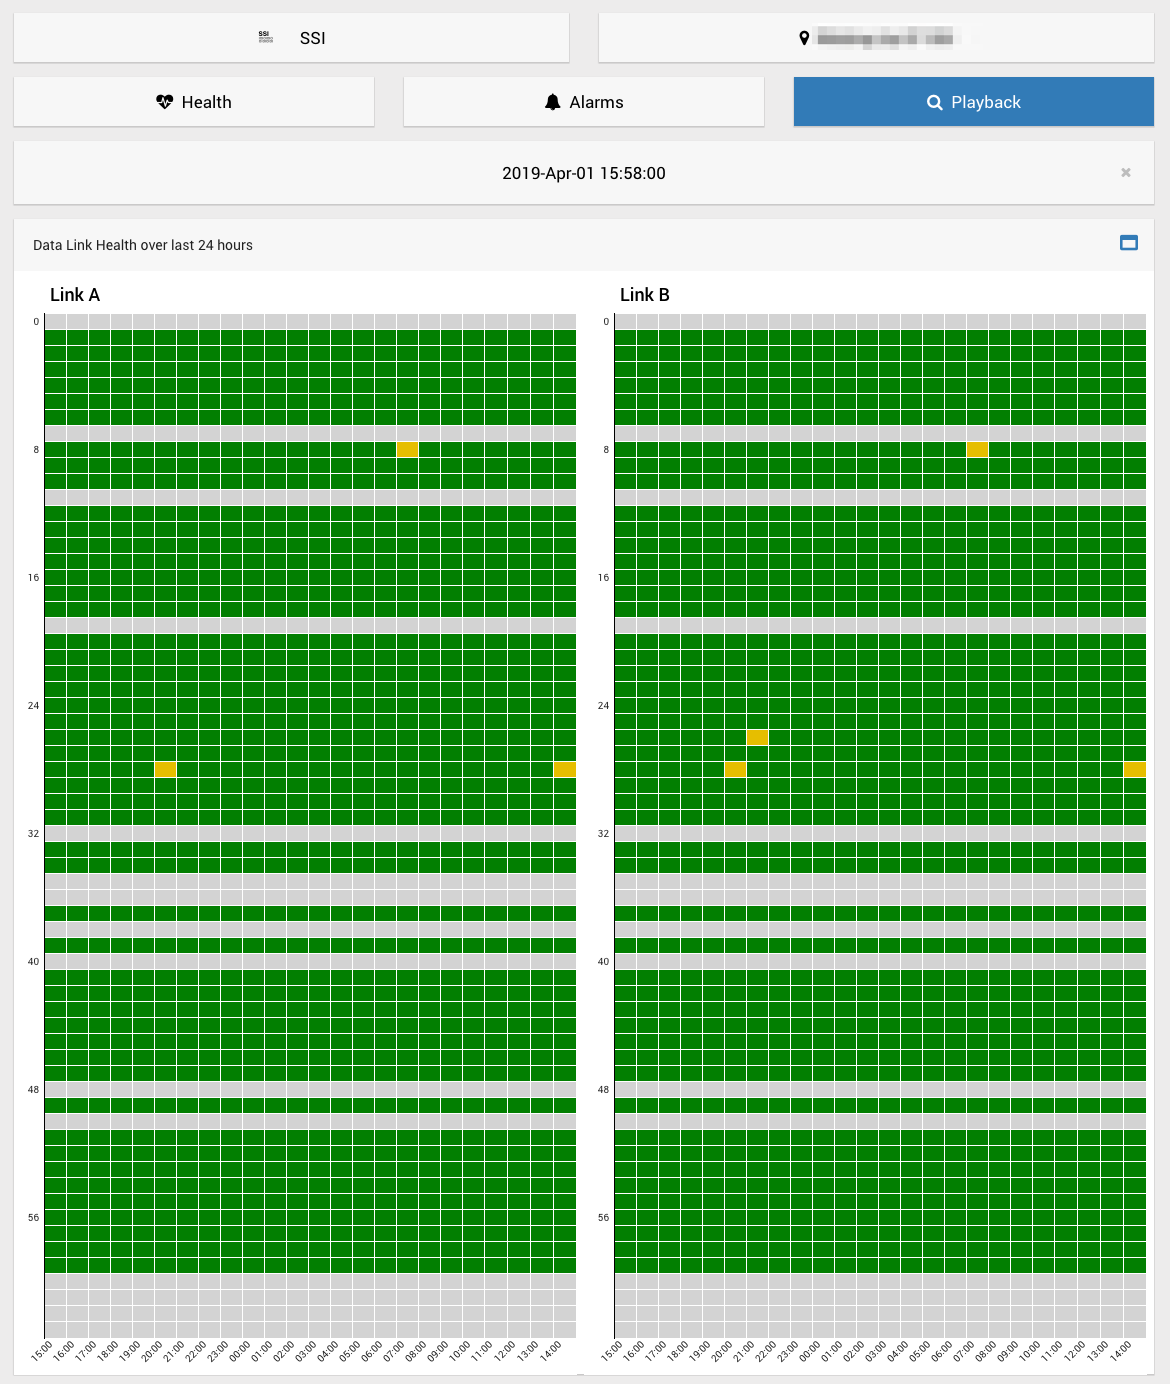
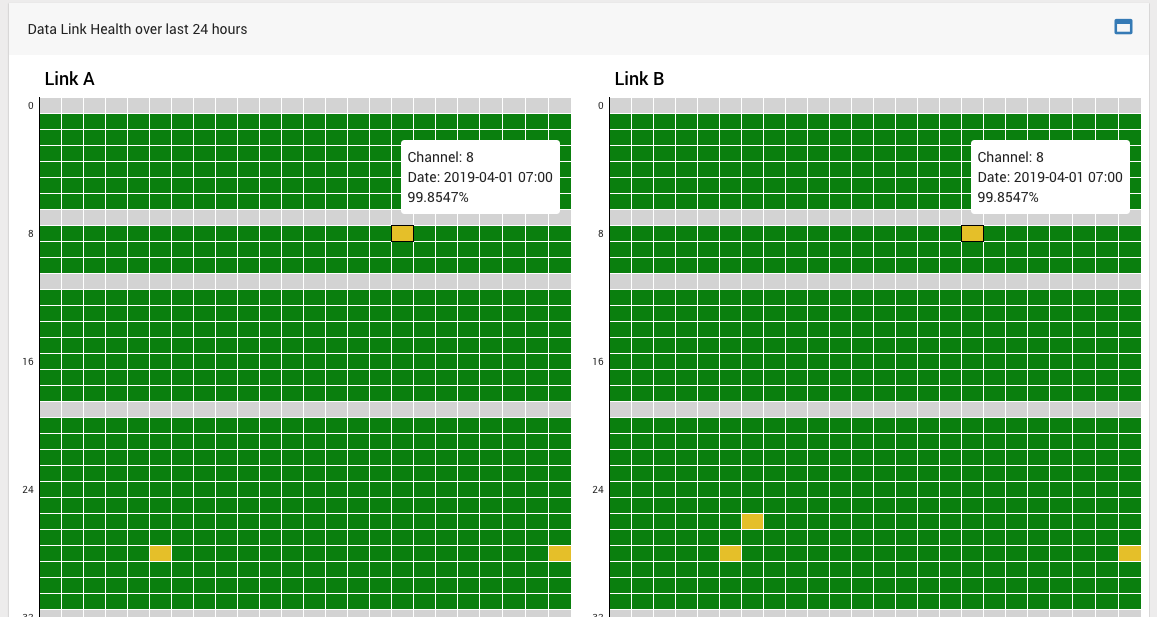
Each grid cell can be hovered or clicked to display exact communications health data for that channel.
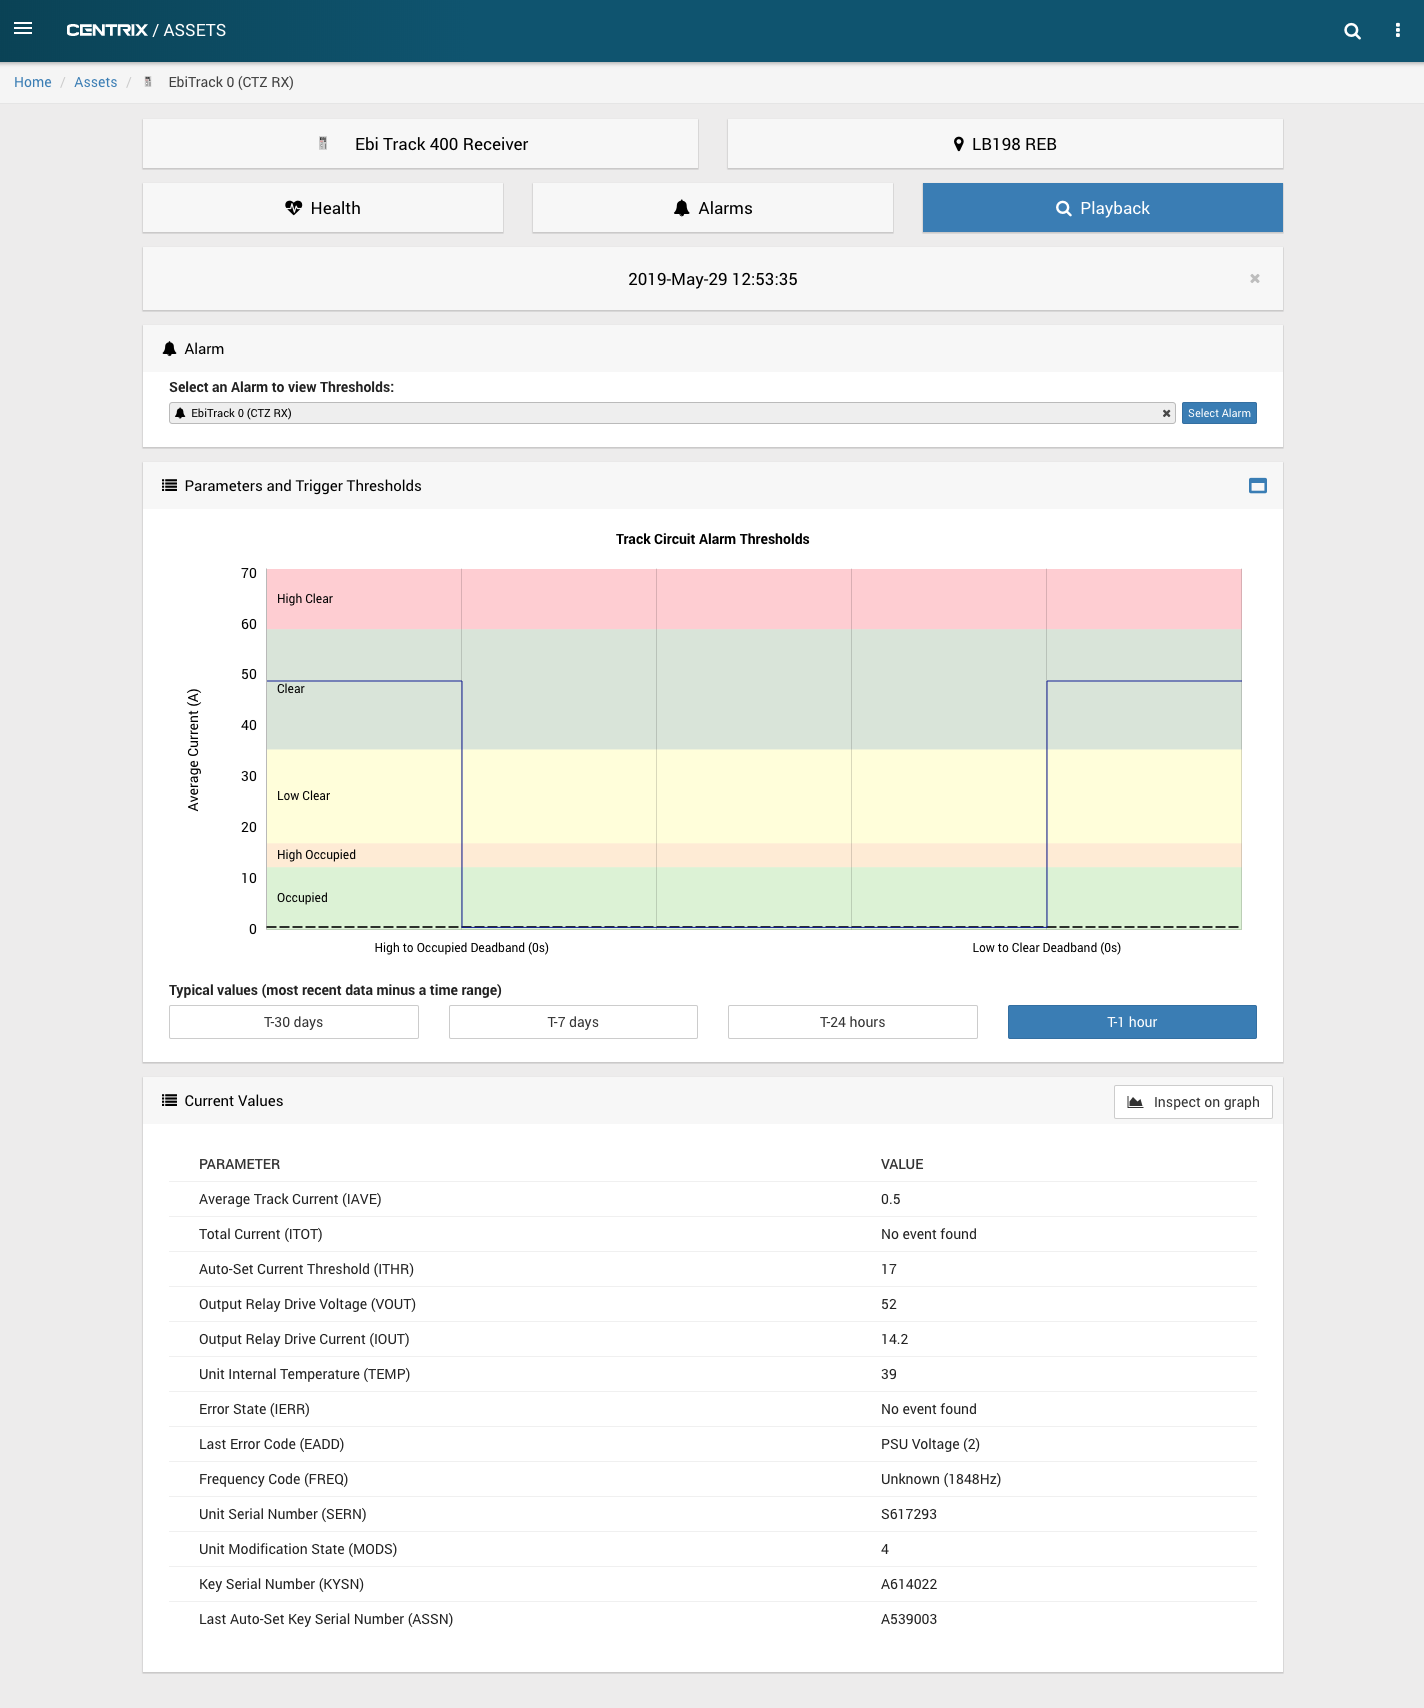
EBITrack 400 Receiver Asset
Previously, any EbiTrack 400 Receivers were stored in Centrix as an Audio Frequency Track Circuit Asset.
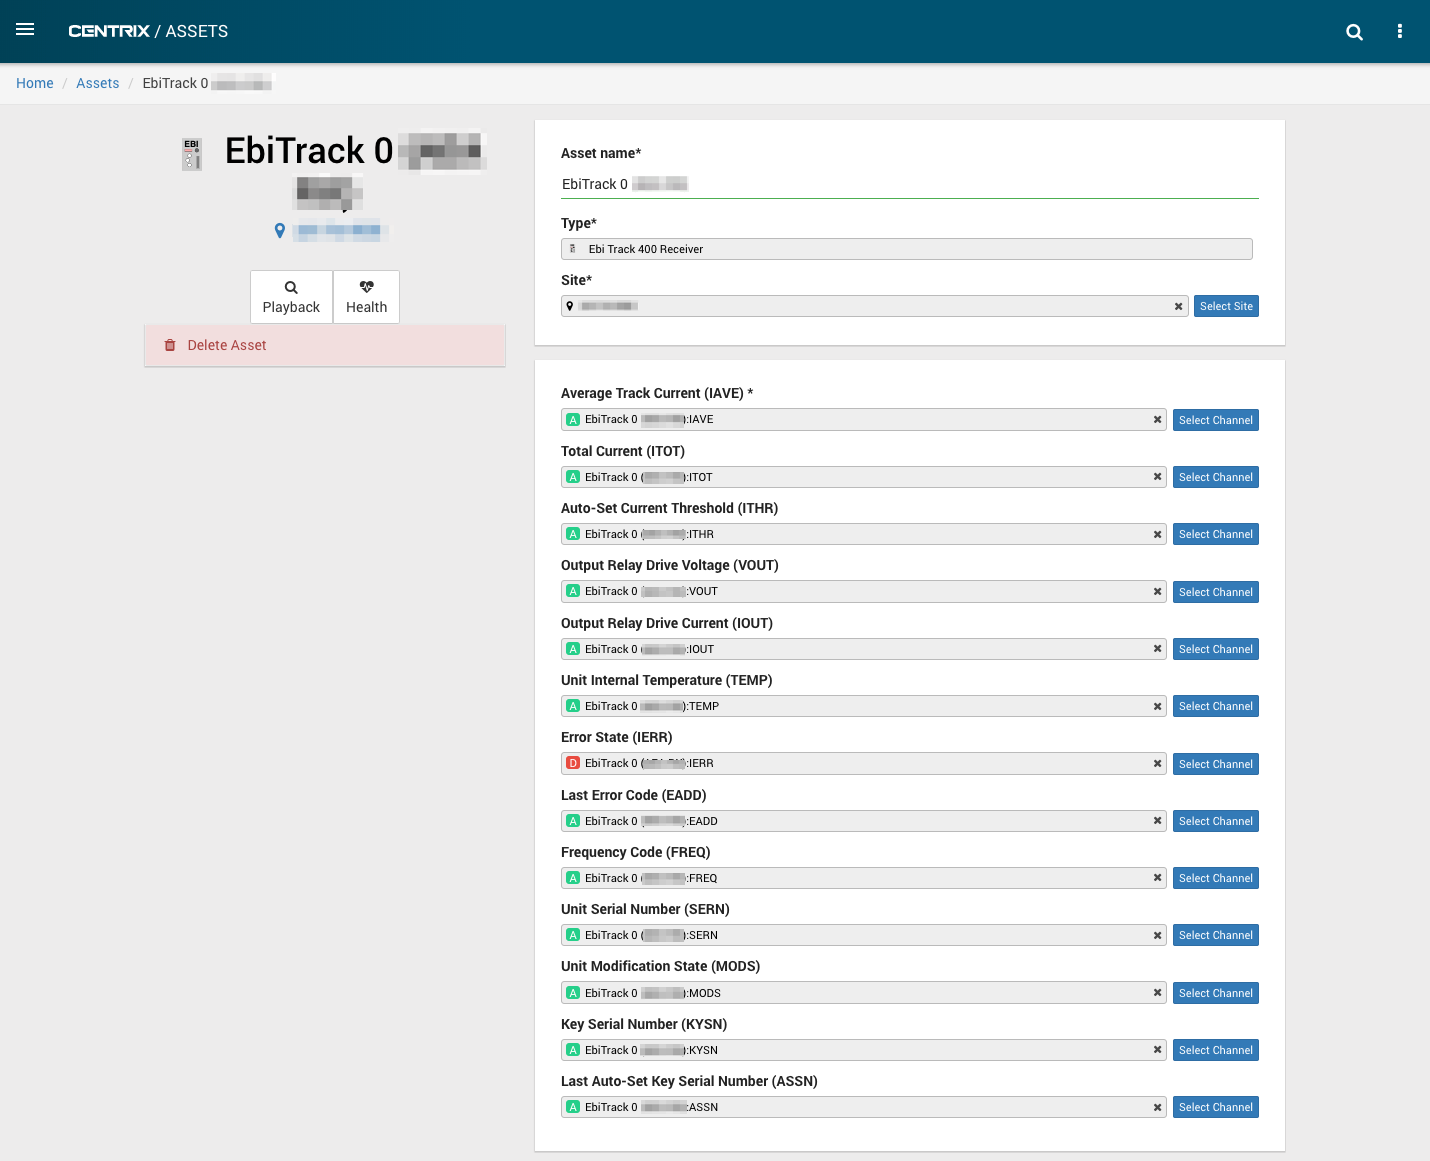
A new Asset type has been made specifically for these so that extra channels specific to the EbiTrack 400 Receiver can be shown in Centrix.
These Assets have automatically been migrated to this new Asset type. This has been done by using the naming convention of the Asset and its channels: All EbiTrack 400 Receiver Assets have a naming pattern of EbiTrack * ( * ) and all of the mapped channels follow a naming pattern of EbiTrack * ( * ):* e.g. EbiTrack * ( * ):IAVE
Any that did not follow this naming pattern will not have been migrated and will still be Audio Frequency Track Circuit Assets.
Only the IAVE channel is required.
As well as automatically adding these new channels, an alarm has automatically been generated for the EbiTrack * ( * ):IERR channel. This is a digital channel which, when true / up, signifies that the EbiTrack Receiver device is an error state.
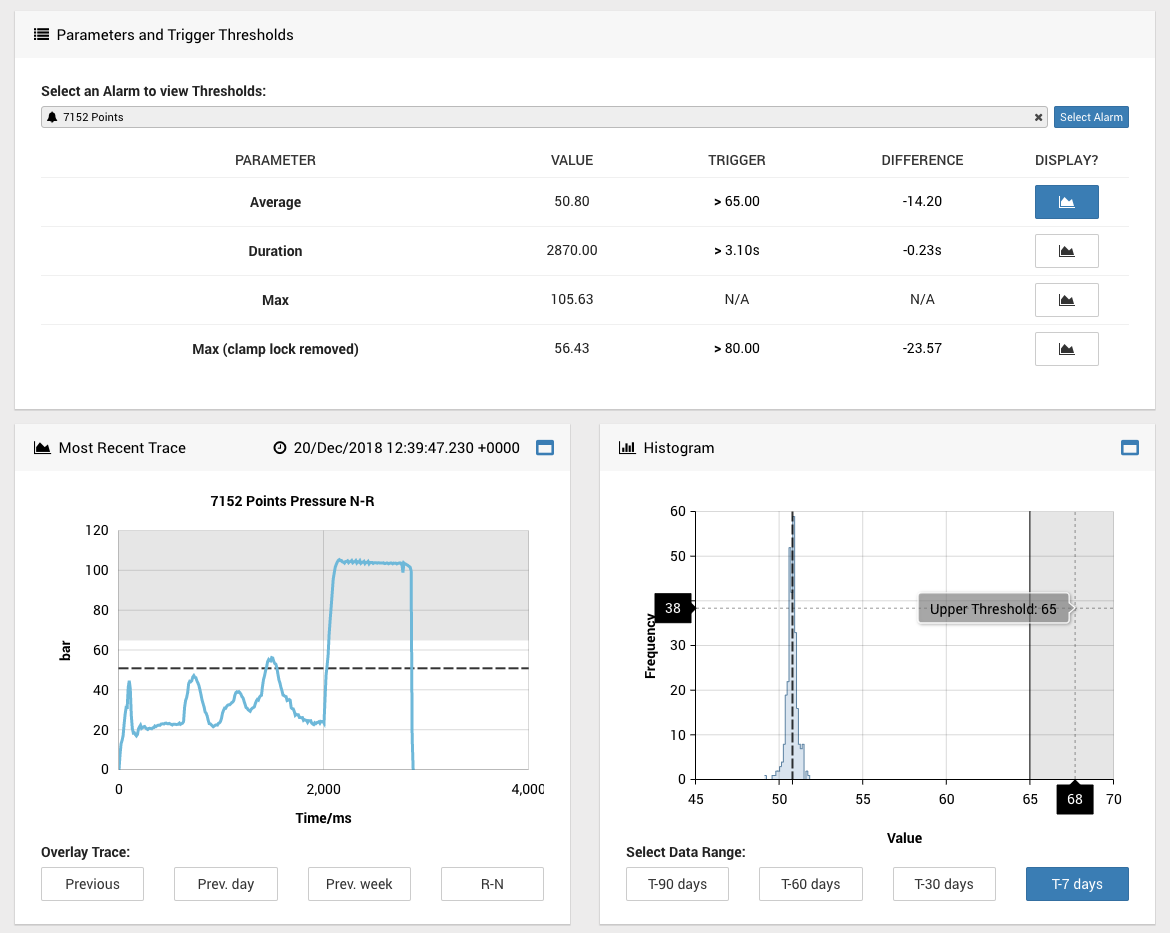
The playback tab for the EbiTrack 400 Receiver Asset shows a graph of the alarm thresholds and the current / most recent values received from all of the channels. The most recent value for IAVE is also plotted on the alarm threshold graph.

Points Asset Playback Graphs
The capture trace, histogram and trend graphs on the Points Asset Playback tab should now always show a line for the threshold of the currently selected alarm.
This is very useful as it shows you how close the previous traces were to triggering an alarm. Previously this wasn't guaranteed but sometimes the threshold line was shown.
Total item counts added to list views
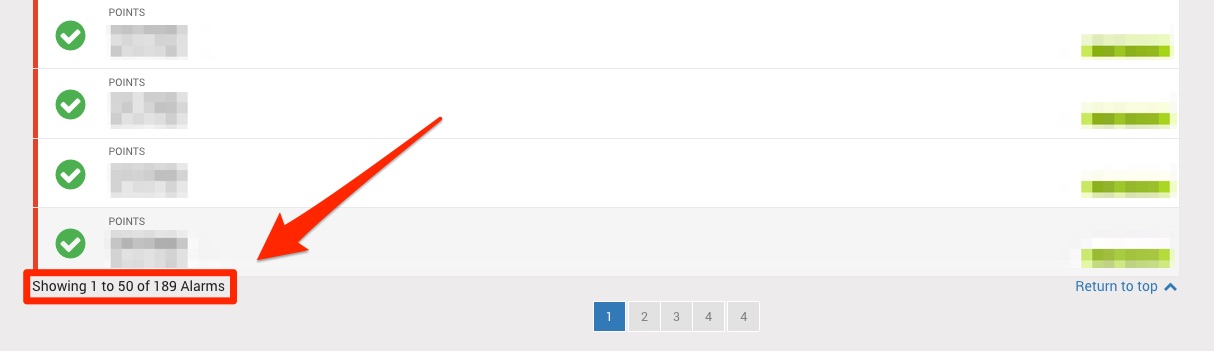
There is additional text at the bottom of all list views which now show the total number of items and the items that are currently in view on the page. This is based on any filters that you may have applied and can be useful for getting an idea of how many items are setup in Centrix.
Hidden channels are now persisted in the URL on the Inspect Graph
Channels can be quickly hidden on the Inspect Graph by clicking the "eye" button on the channel.
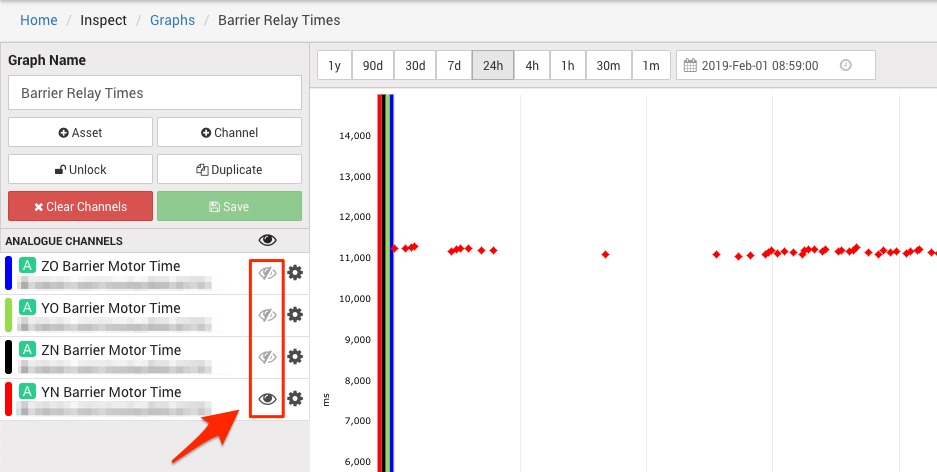
The visibility of each channel is now represented as part of the URL which means that it can be shared with colleagues and only the visible channels will be displayed.
![]()
Inspect graph splits series with the same unit but different scales
The Inspect Graph now splits series with the same unit but different scales into multiple series. Each unit can have one autoscaled series and any number of manually scaled series.
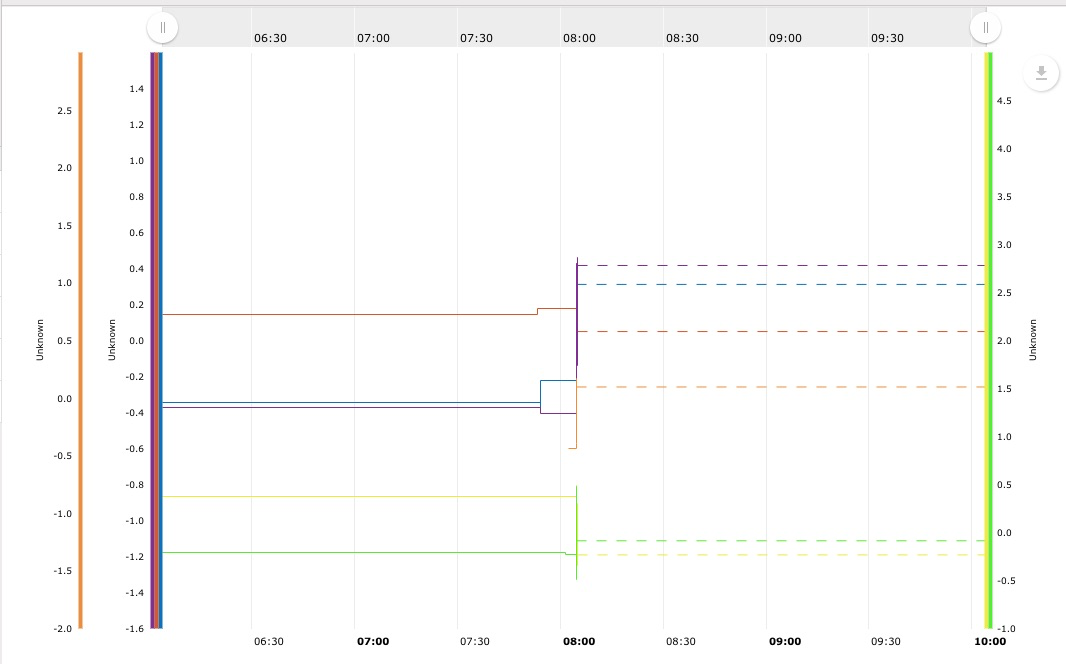
The image above shows a graph with 3 groups of Y-axes, for channels all with the same unit ("Unknown" in this case). The orange axis has scale of -2 to 3, the purple, red and blue axes are autoscaled, the yellow and green axes have a scale of -1 to 5. You can see that there are 3 distinct groups each with their own scale, previously these would have all been combined into a single axis based on the minimum and maximum value.
| Series | Auto | Min | Max | Axis Grouping |
|---|---|---|---|---|
| Orange | N | -2 | 3 | Left #1 |
| Purple | Y | - | - | Left #2 |
| Red | Y | - | - | Left #2 |
| Blue | Y | - | - | Left #2 |
| Yellow | N | -1 | 5 | Right #1 |
| Green | N | -1 | 5 | Right #1 |
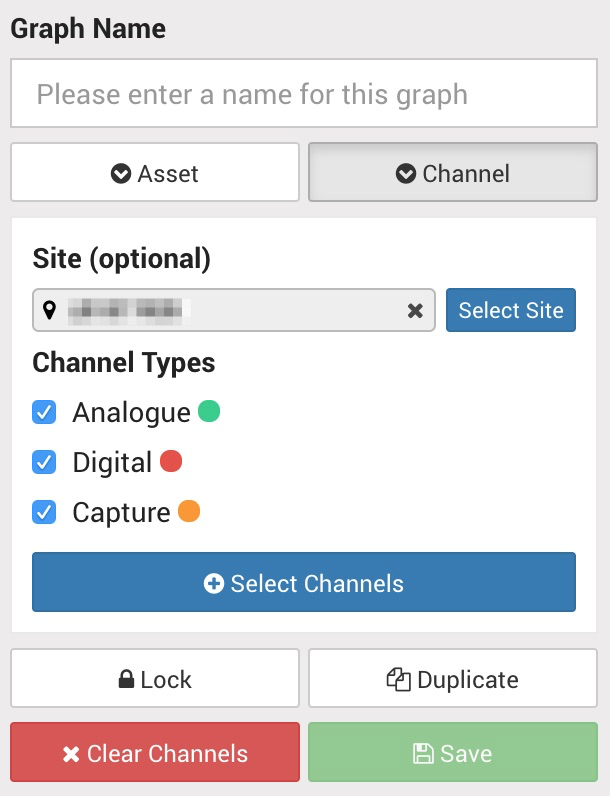
Inspect graph asset and channel filtering
Previously, when adding an asset or a channel to the graph you could only filter by name in the item selector.
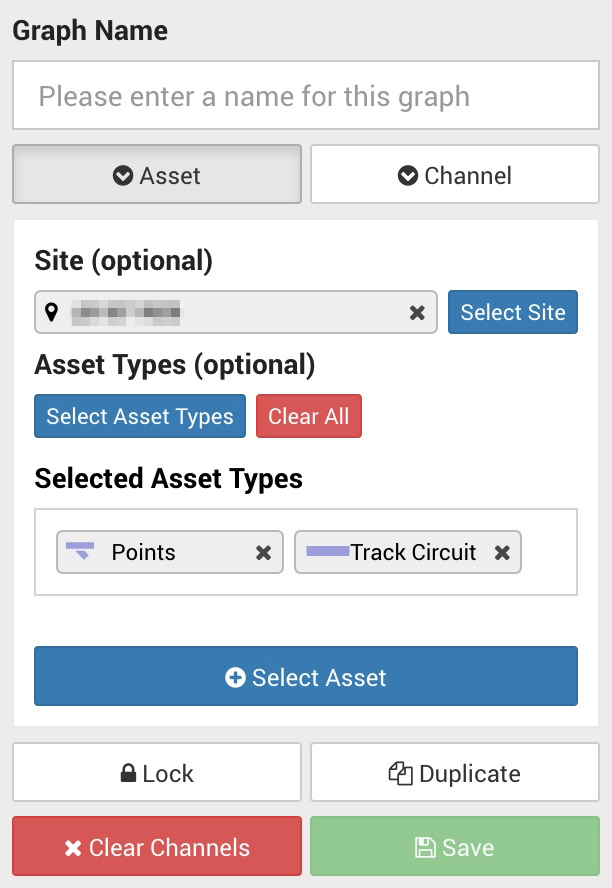
Clicking the "Asset" or "Channel" buttons on the inspect graph toolbar used to open the item selector, now it expands a section which contains filters for the item selector.
Now a site and channel or asset type can be selected before opening the item selector and all items will be filtered by these options.
Inspect captures print view
The "Inspect > Captures" page now has a print view, which makes taking a screenshot, for example to attach to a trouble ticket, much easier.
To toggle between print view and normal view there is a new button next to the "Clear Traces" button (highlighted).
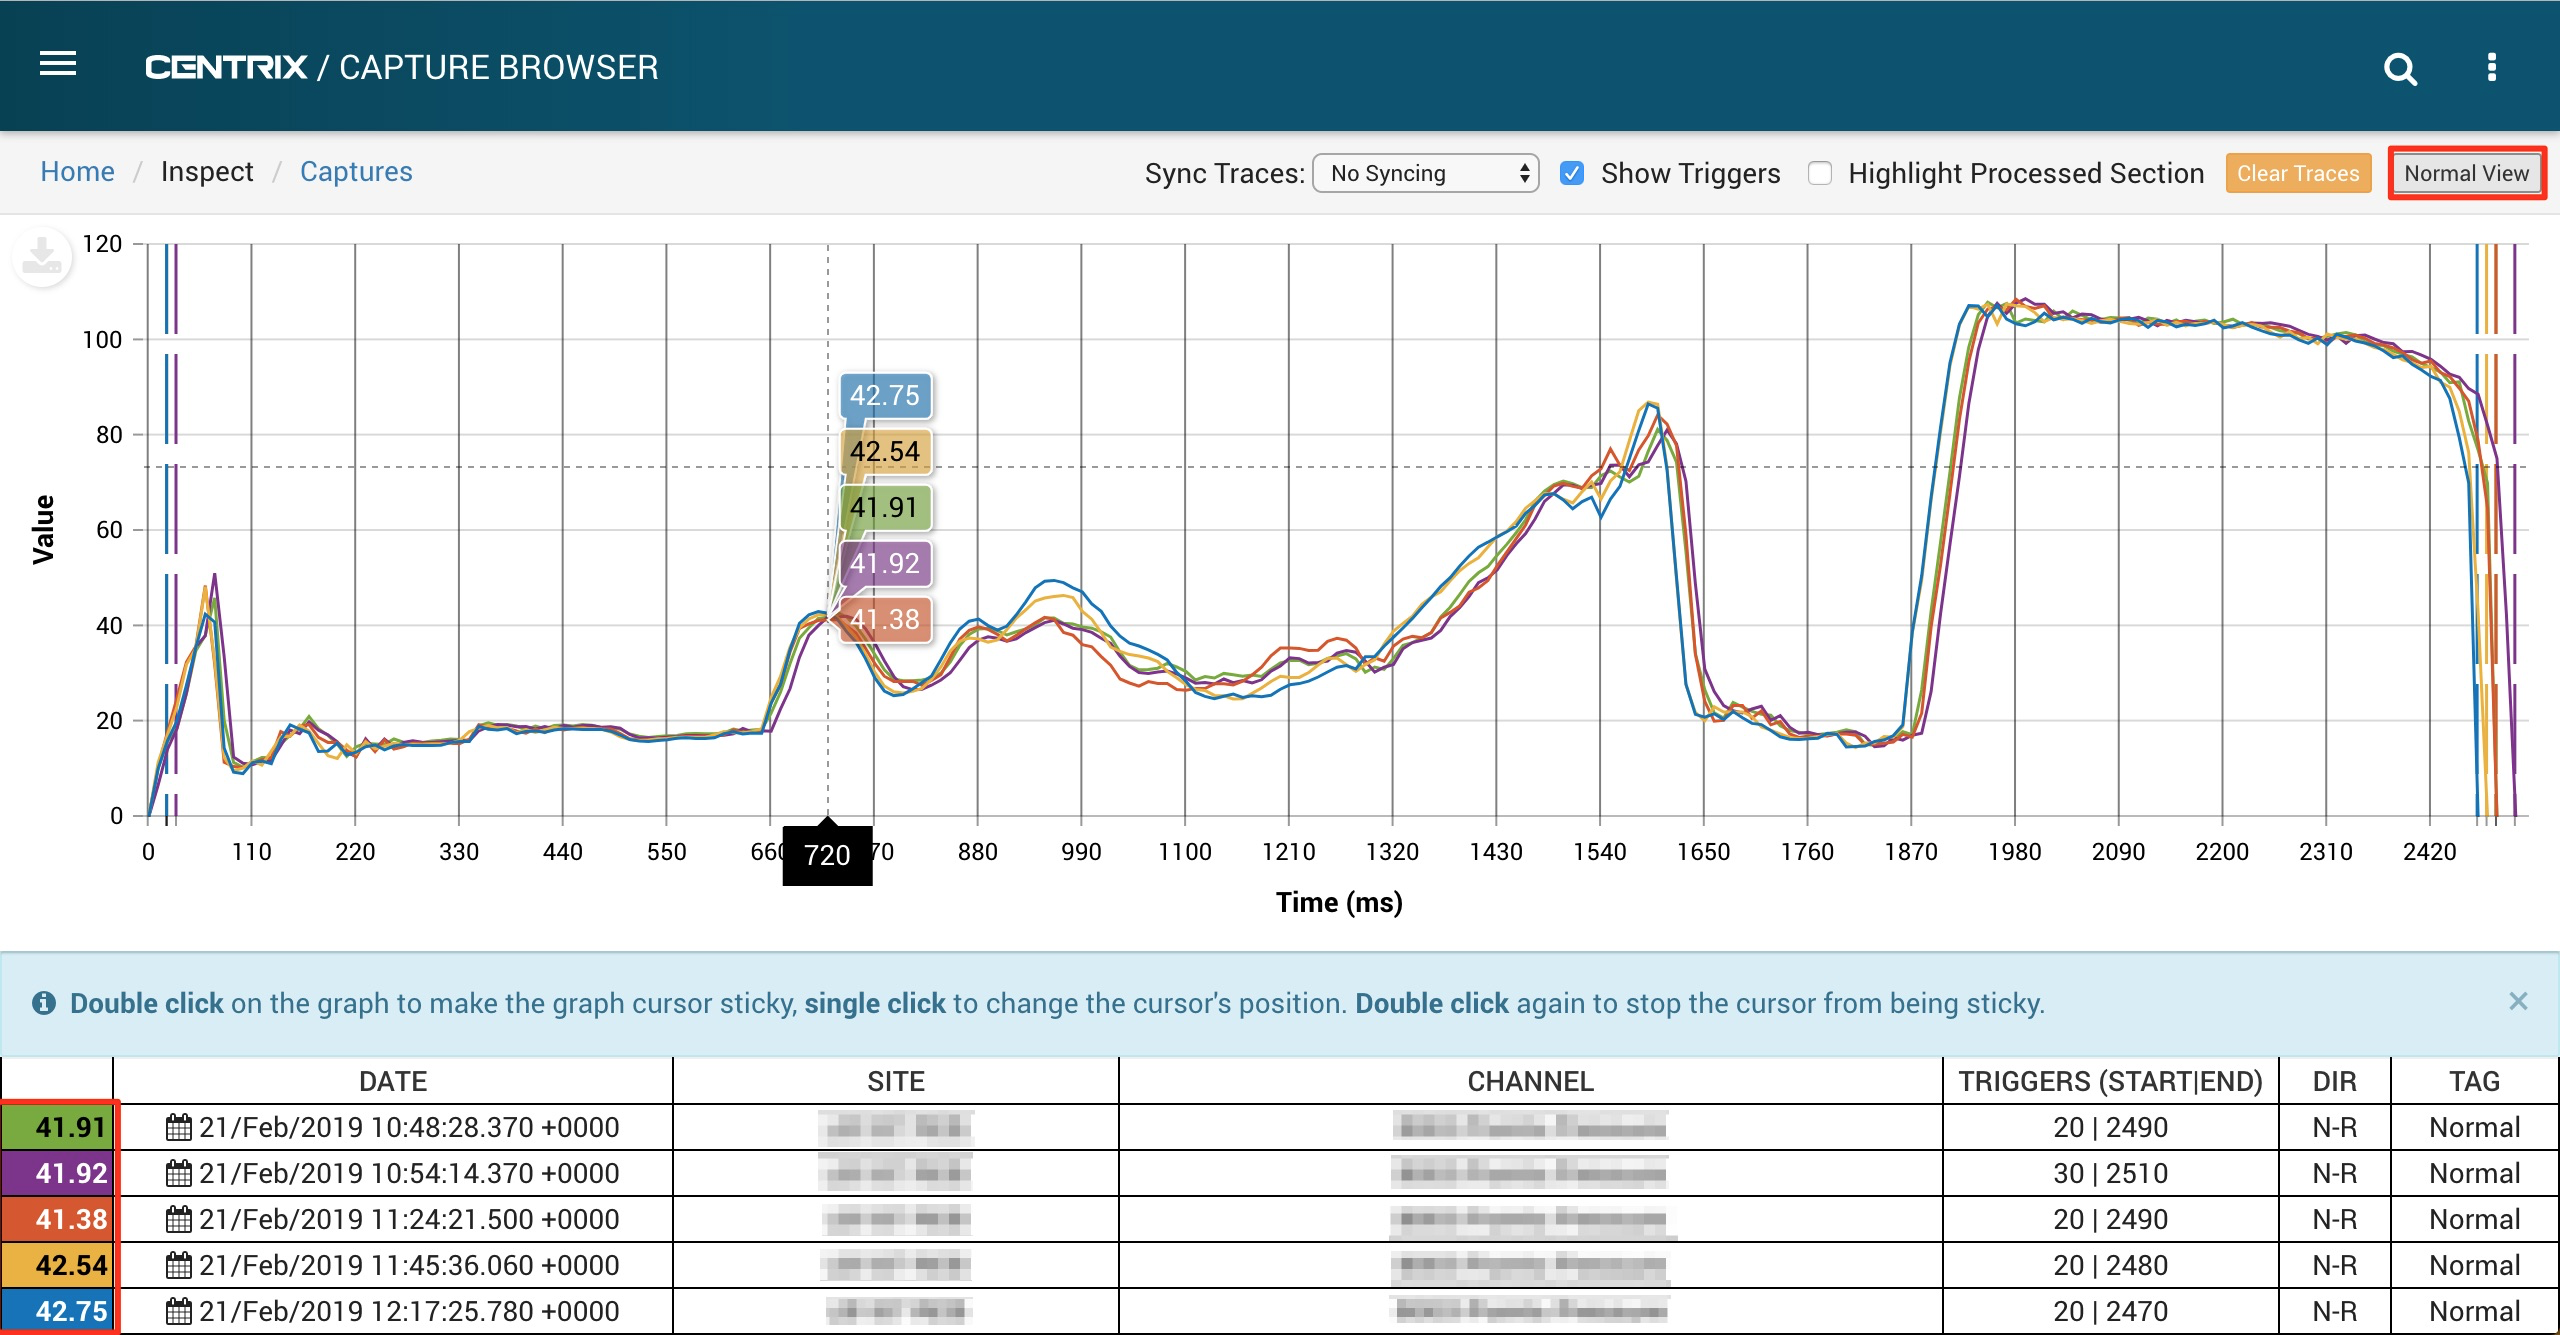
When in print view double click on the graph to make the graph cursor sticky, single click to change the cursor's position. Double click again to stop the cursor from being sticky.
The values on the graph at the current cursor position will be displayed in the first column of the table, with the colour matching the corresponding line on the graph.
Asset selector on Inspect Captures
The "Inspect > Captures" page now has an asset selector which makes it easier to locate capture traces for assets without having to know site and channel names.
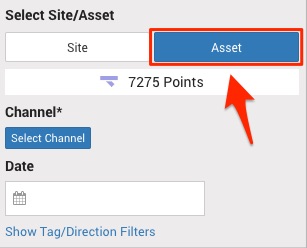
For assets which only have a single capture channel (such as electrically actuated points) it will be selected by default and the captures list will be loaded below, ready for selection.
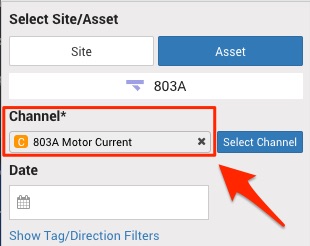
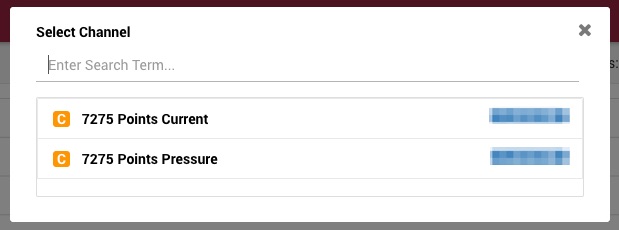
For assets which have multiple capture channels associated with them (such as hydraulically actuated points) you will need to select which channel to load captures for. Clicking the "select channel" button will display a dialog with any channels available on the asset ready for selection.
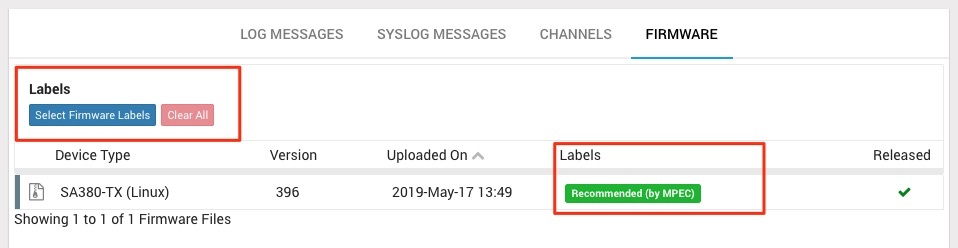
Firmware Management - Firmware Labels
Centrix firmware management now has the concept of firmware labels. The labels will be managed by MPEC technicians and used to mark specific firmware, making it easier to filter the list of firmware and find the most appropriate firmware to upgrade to.
Minor amendments and fixed issues
- The "Inspect > Capture" graph now supports non-integer time deltas, this allows non-standard capture data such as frequency to be plotted.
- Digital channels plotted on the Inspect Graph from the MIMOSA channel page were being drawn incorrectly.
- Analogue channels added to a graph now have step line type by default rather than segment.
- Adding an asset to graph which has capture channels wasn't adding the capture channels.