Problem Details Page
- Tom Forster
- Jamie (Deactivated)
Each time an alarm is raised, further details of the events causing the raise can be viewed on individual Problem Details Pages.
Further problem details are currently available for Points Alarm and Capture Trace Levels Alarm. Other alarm types work, but do not display any additional information. This feature will be rolled out to all alarm types over future releases.
The problem details page is available when looking through the Alarm Raise History for an alarm on the Alarm Status page.
Details & Shortcuts
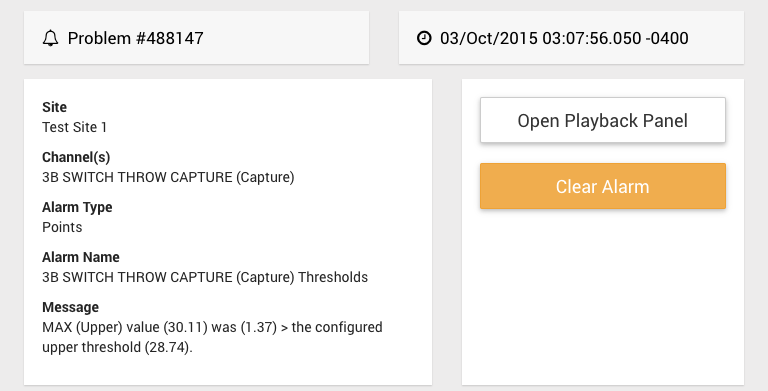
The top of the page shows the basic alarm raise details and links to common tasks for this alarm type.
Problem History
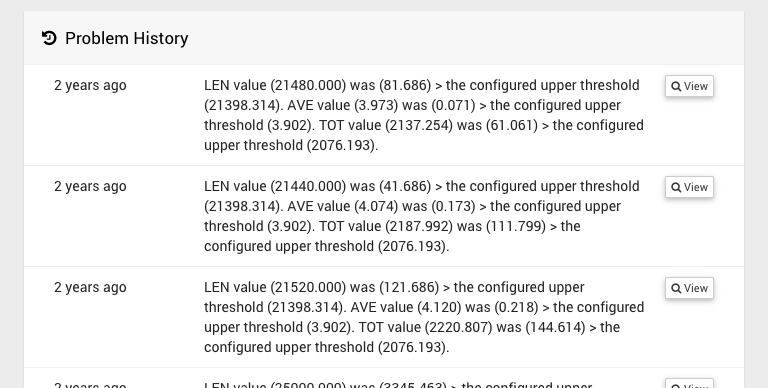
View problem details pages for previous alarm raises for this alarm. This panel currently shows up 5 raises before the time of the currently viewed alarm raise.
Notes
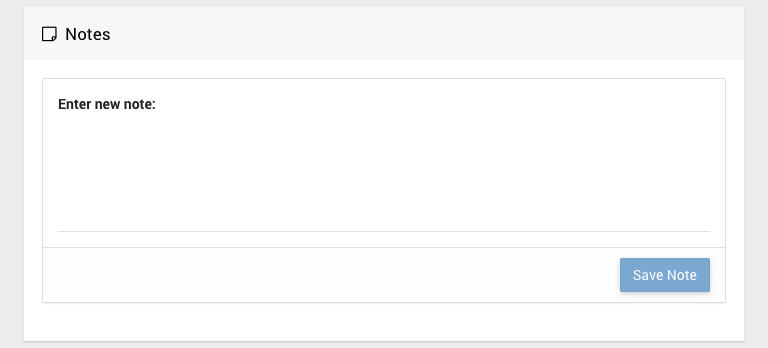
Users can add notes to specific problems by typing in this field and pressing Save Note. Notes can be deleted by their original authors by pressing the grey X by each note.
Points Alarm
Parameter and Trigger Thresholds
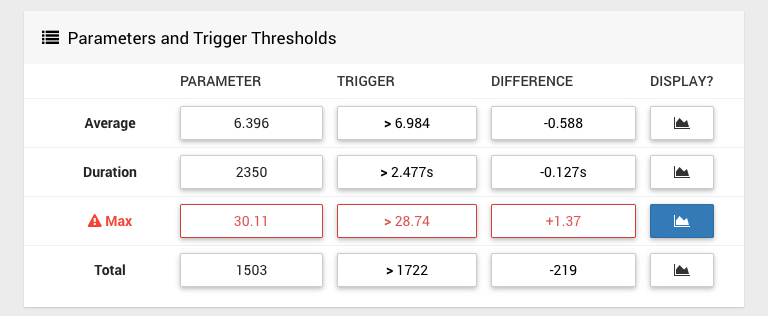
The Parameter and Trigger Thresholds panel displays the following information:
| Column | Explanation |
|---|---|
| Parameter | Contains the current value of that particular capture trace parameter, e.g. Max shows the peak value of Points Swing Pressure for a set of Hydraulic Points |
| Trigger | Contains the current trigger threshold values configured for the alarm. |
| Difference | The difference in value between the trace parameter and the configured threshold value |
| Display | Show these threshold values on the Problem Trace graph and show the range of values for the value on the Histogram graph. |
Rows displayed in red indicate that the threshold was exceeded and caused the alarm raise.
Problem Trace
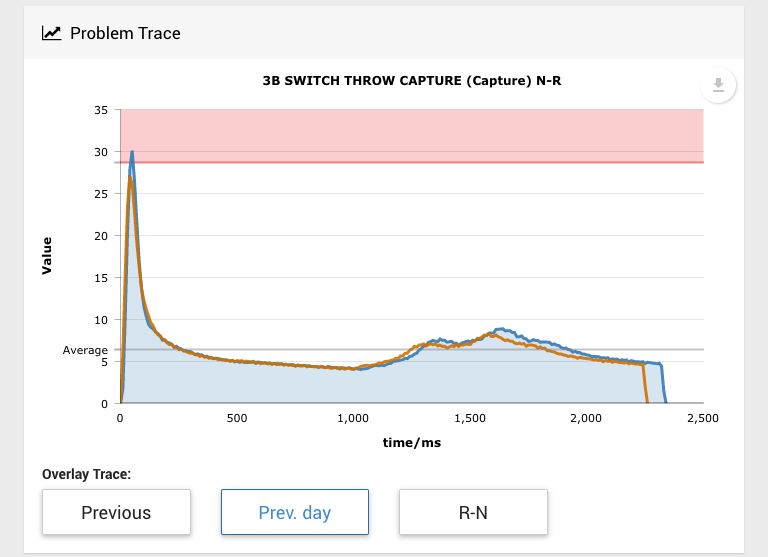
Trace can be exported in a variety of formats using the export button in the top right hand corner. The shaded threshold can be configured or disabled using the threshold panel (see above). The shaded area shows the current threshold value, and is shaded in grey if the current problem is within the threshold, or red if the current value exceeds the threshold.
Histogram
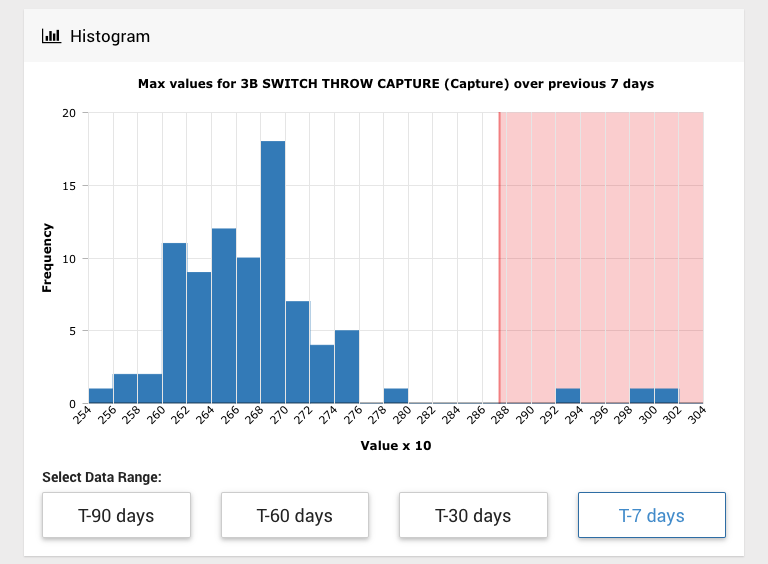
The histogram displays the counts and max values for the monitored capture trace waveform channel for a preset data range. The data range can be configured using the buttons at the bottom of the panel. The data type (depending on the available thresholds) can be changed using the threshold panel (see above). The shaded area shows the current threshold value, and is shaded in grey if the current problem is within the threshold, or red if the current value exceeds the threshold.
Capture Trace Levels Alarm
Parameter and Trigger Thresholds
See Parameter and Trigger Thresholds
Problem Trace
See Problem Trace