Centrix R42 Release Notes
- Former user (Deleted)
- Jamie (Deactivated)
Track Circuit Alarm Wizard
This release brings a much slicker and fully featured track circuit alarm wizard. This module now follows the new design guidelines used for the Points Alarm Wizard released in Centrix R41.
Video walkthrough
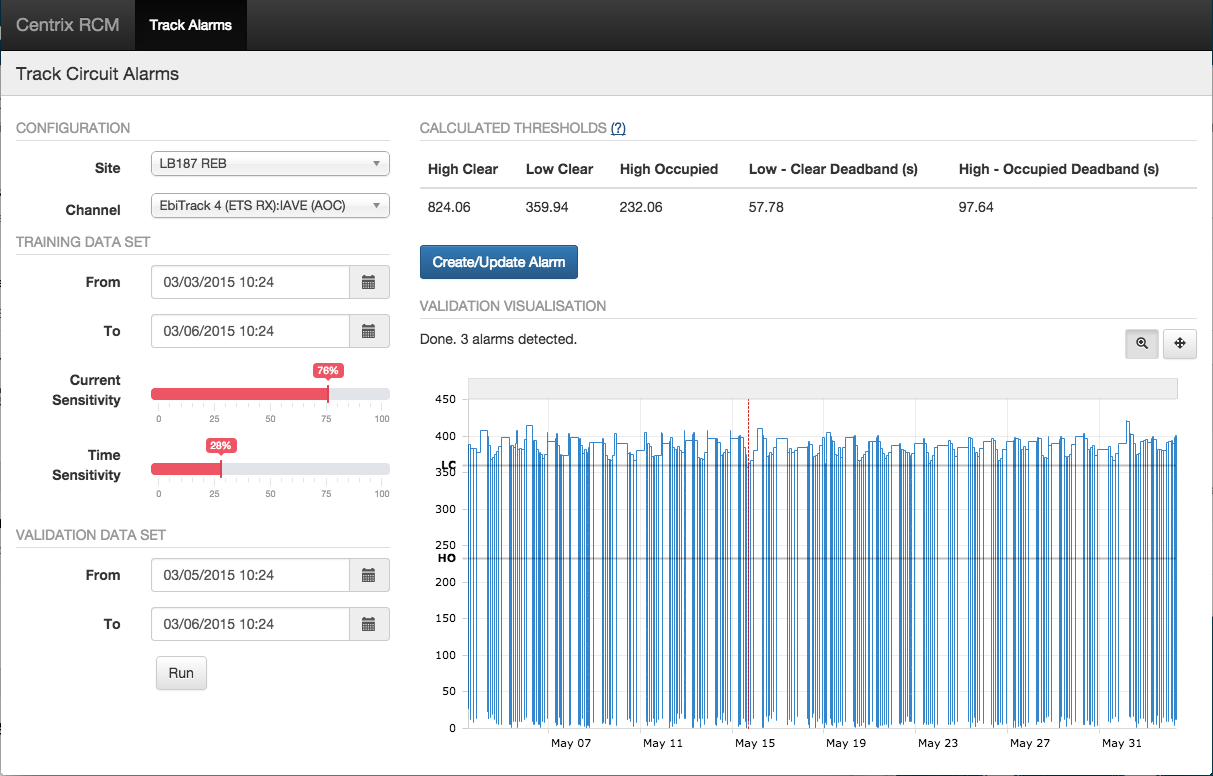
User interface changes
The track circuit wizard now uses the material design guidelines so the user interface has undergone a complete transformation from the previous prototype.
| Before | After |
|---|---|
 | 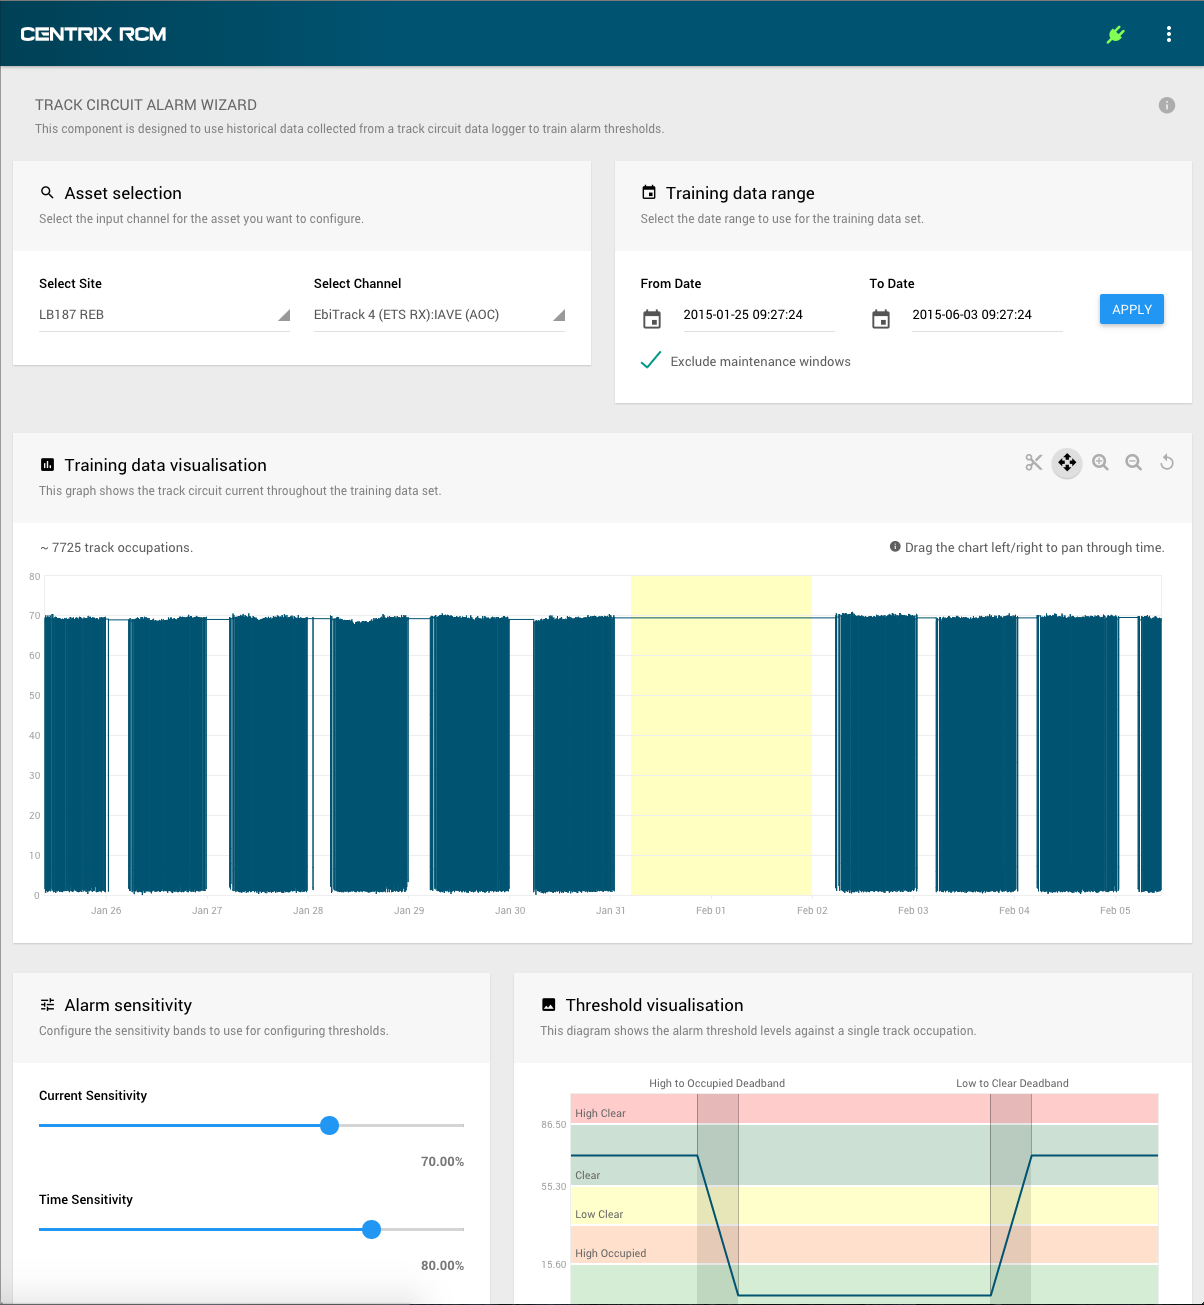 |
Exclude maintenance windows
Existing maintenance windows can now be excluded from the training data set, this means you can now select a date range that includes any known maintenance works without affecting the quality of your data set. Excluding maintenance windows is enabled by default, but you can disable this feature by unchecking the box in the training data configuration.

Maintenance windows are highlighted in yellow on the Training data visualisation panel.
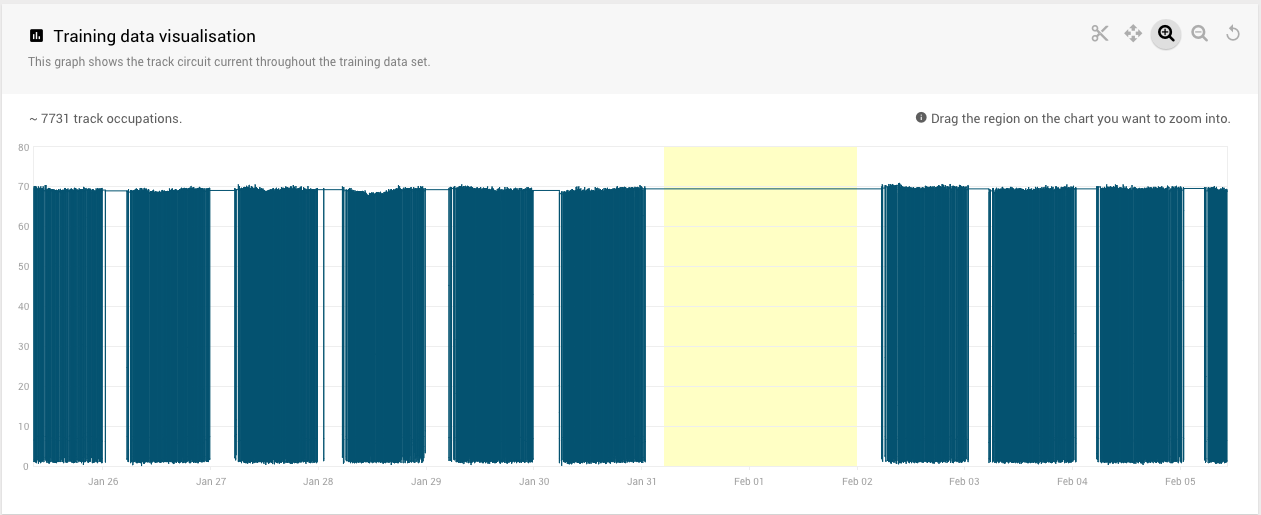
Training data visualisation and outlier exclusion
The training data is now shown in a graph like the validation was in the previous version. This allows you to check that the training data looks good before you calculate the thresholds.
If there are any periods of bad data that is not covered by a configured maintenance window, you can now manually exclude this by using the exclusion feature. Simply click the  icon and select the range you want to exclude on the graph. The data will be immediately removed from the training data set.
Threshold visualisation
The previous version of the track circuit alarm showed the threshold values and had a static diagram that explained what the thresholds represented. This version now has a dynamic graph representation of a track circuit occupation with all the threshold bands shown and annotated. The diagram will change as you configure the alarm sensitivity.


Validation visualisation
As before, the validation data set is shown with the alarm projections overlaid. However, this has now been enhanced to not only show the number of "alarm conditions" but also a more realistic value that represents the number of alerts that would have been raised based on a 1-hour suppression period.
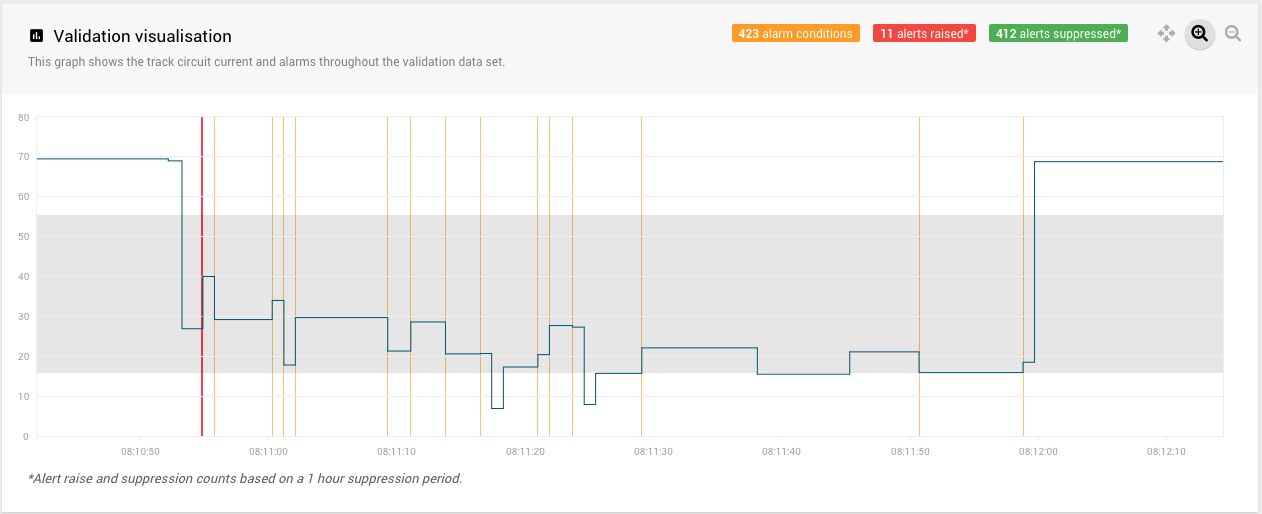
We are currently working on reducing the alarm conditions to a single condition per track occupation. Whilst this doesn't affect the e-mail alerts raised (as these additional points will be suppressed), it does pollute the alert history. This will also allow us to reliably implement a count before fire restriction on the alarm to only alert once N alarm conditions have been raised. We hope to complete this in a near upcoming release.
Alert configuration
The alert configuration pane has been enhanced to allow labels and priority to be configured from within the wizard. Previously you had to do this from within the Alerts panel in Centrix.
Conflict warning
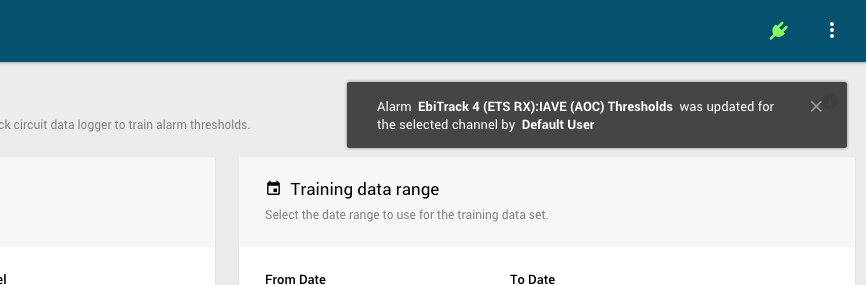
The track circuit alarm wizard now maintains a connection to the Centrix messaging system, so will receive messages for various updates. We have added a specific warning message if another user edits an alarm for the channel you currently have selected, this is designed to protect against conflicting or overwriting alarm conditions for the same channel.
This also means that any updates to sites, channels, alert labels, alerts (etc) will be automatically populated into your current wizard session so you don't need to refresh the page to see any changes made by other users or from within the Centrix application.
Points Alarm Wizard
The points alarm wizard has undergone some major enhancements in this release.
Video walkthrough
Exclusion by trace
Previously, values were excluded on a per-feature basis so excluding a trace on one feature didn't remove the associated value on the other features. The outlier removal has now changed to exclude the selected trace(s) across all the features. Consequently, excluding values on any of the features will update the histogram for all the other features for the same swing direction.
Outlier selection
Rather than selecting the inclusion range, the removal of outliers is now performed on an exclusion basis. This is to fit in with the approach explained above. To remove outliers, you should now select the range of values you want to remove from the data set and then click the cut button. Repeat this process until you are satisfied with the remaining data set.
You can revert all selected outliers for a swing direction by clicking the revert button on any of the features for the direction. This will only revert the outliers for the direction of the feature you have selected, to revert all outliers you will need to repeat this on a feature for the other direction.

Data inspection
Previously, the inspection/zooming process was tied to the removal of outliers. Now, you can zoom into any region of each histogram to see a distribution based on the selected range. This will not affect the training data set. You can inspect a range by selecting it on the histogram and clicking the zoom in button. To zoom out to see the whole data range, click the zoom out button.
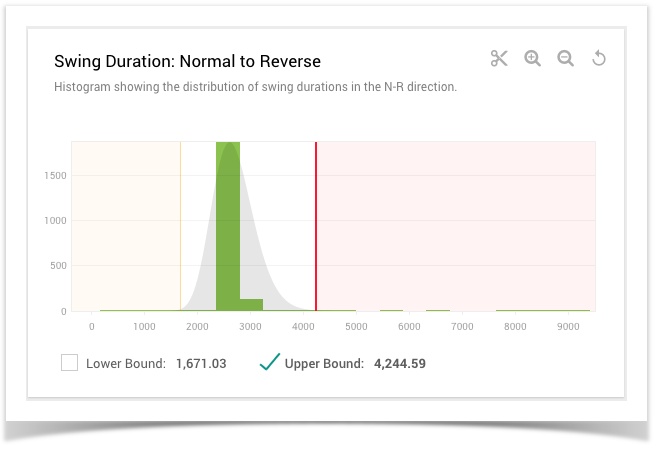
Threshold activation/de-activation
We have now added the ability to de-activate each specific threshold for the alarm, previously you could exclude specific features but could not exclude the upper/lower boundaries. The (de)activation of the threshold boundaries is now done using the checkboxes underneath the histogram for each feature. By default, only the upper boundaries are activated.
Both the upper and lower boundaries will be shown on the histogram (if in range), activated thresholds will show in red and de-activated thresholds will show in yellow.
Total value feature
In addition to the existing 3 features (duration, average, max) we have now added the total feature to the alarm wizard.
Combined "points alarm"
The previous points alarm wizard generated up to 6 individual analogue alarms that were linked to the feature channels for the selected capture channel. This was problematic when alerts fired as features are generally tightly related (e.g. A long swing duration will generally cause a higher average value), and as such multiple alerts would be sent for a single swing.
We have now introduced a new Points Alarm that contains all the possible thresholds for a single capture channel. If any of the conditions of the alarm are met then a single alert will fire with detail on which features caused the alarm to fire.
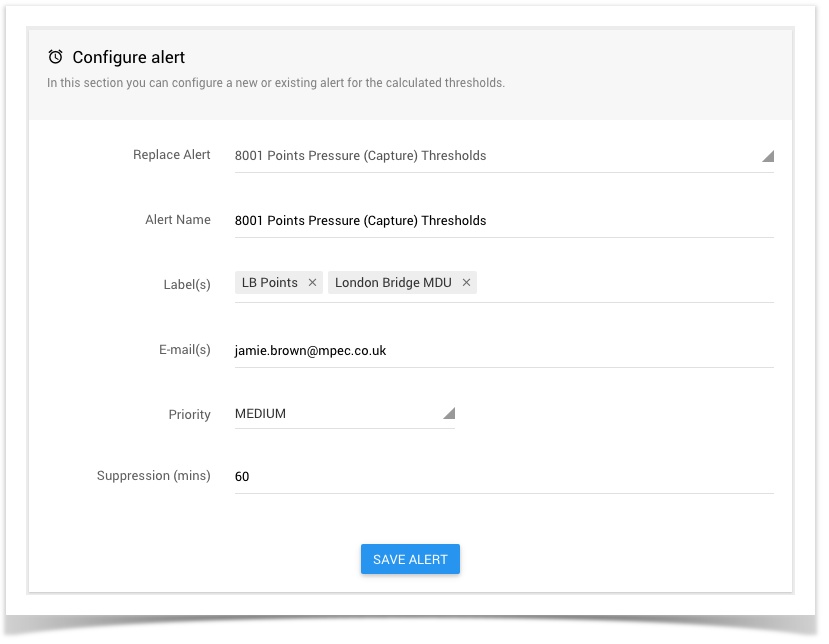
Improved alert configuration
You can now elect to replace an existing points alarm (if available) or create a new one. This allows you to set-up multiple alarms for the same channel if desired. Additionally, we have added the selection of labels and suppression period to the alert configuration dialog so you can configure everything from one place.
Live updates
The points alarm wizard now maintains a permanent connection to the Centrix messaging system and listens for specific updates. This means that any new site, labels or alarms that have been created since opening the page will now be added to the corresponding selectors without the need for a page refresh.
If another user edits an alarm for the channel you have selected, you will receive an immediate notification in the top right of the screen.
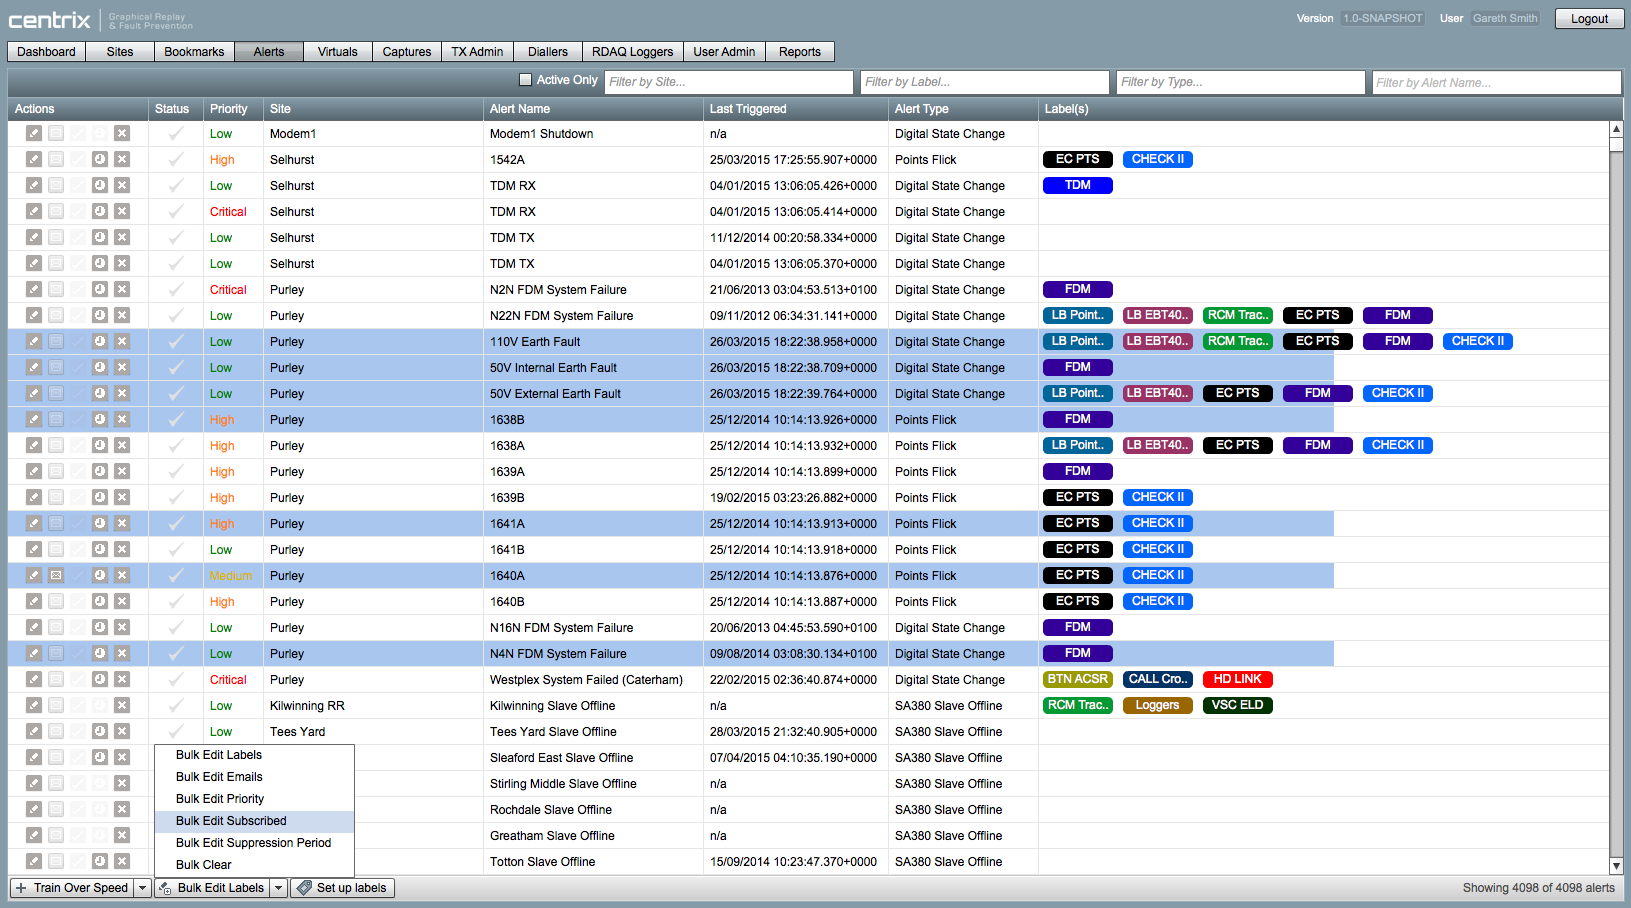
Bulk Alert Editing
You can now edit multiple alerts in one go. You could add or remove labels or emails, or bulk-clear or bulk-subscribe to alerts.
Click on a row and then hold shift and click on another row to select multiple rows. Use Ctrl+Click to add or remove items from the selection. The bulk-edit functionality is available via a button at the bottom of the screen.
Replay & Alerting of SSI Alarms
Centrix now processes technician terminal alarms captured from the SA-SSI data logger. These alarms are imported as a new SSI Alarm event type which can be shown on the replay panel by adding the SSI Alarms widget;
- Open playback for the SSI site
- Click Configure
- Tick the checkbox next to SSI Alarms
- Click Apply or Apply and Save
You can opt to receive SSI alarms as e-mail alerts by using the new SSI alert type on the Alerts screen;
- Open the Alerts screen
- Open the Create Alarm dropdown in the bottom left of the screen
- Select the Site and fill in the basic alarm fields
- Select the specific SSI alarm types you want to be alerted for
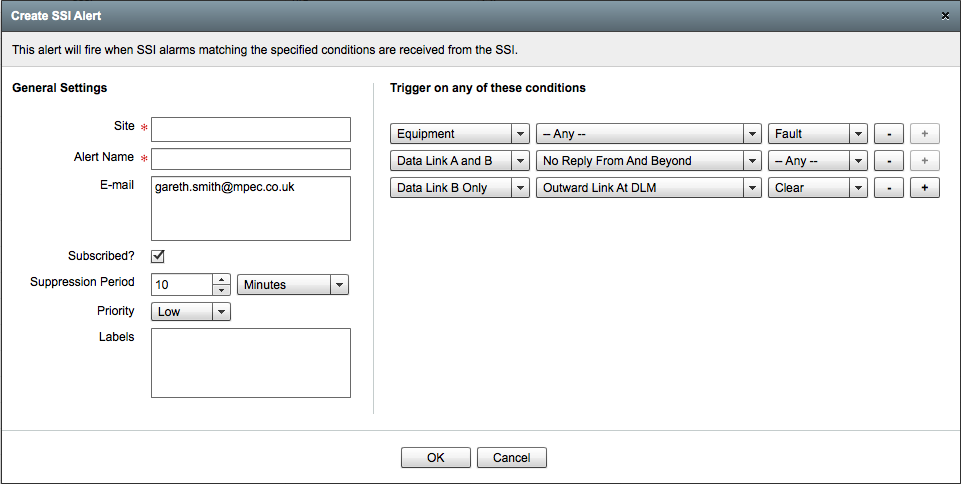
Centrix currently only processes (understands) a subset of the possible technician terminal alarms; Points alarms are supported, as well as a subset of the TFM and Data Link Fault alarms, and Common Trackside Fault alarms. Signal alarms are not supported.
We are currently working on obtaining the required documentation and test cases that will allow us to process the remaining alert types.
Points Swing Time Report BETA
We have introduced a specialised report for analysing the swing duration of points for a site using the configured assets and inferring the swing time by calculating the time between relay movements.
You can access the report through the Reports menu and select Points Swing Time. This will open a new browser tab.
- Select the Site you want to run the report for.
- Select the From Date and To Date to use for the data range.
- You can exclude durations that are Below or Above specified values. By default these are set to 0.5 seconds and 60 seconds.
- Click Run Report to run the report.
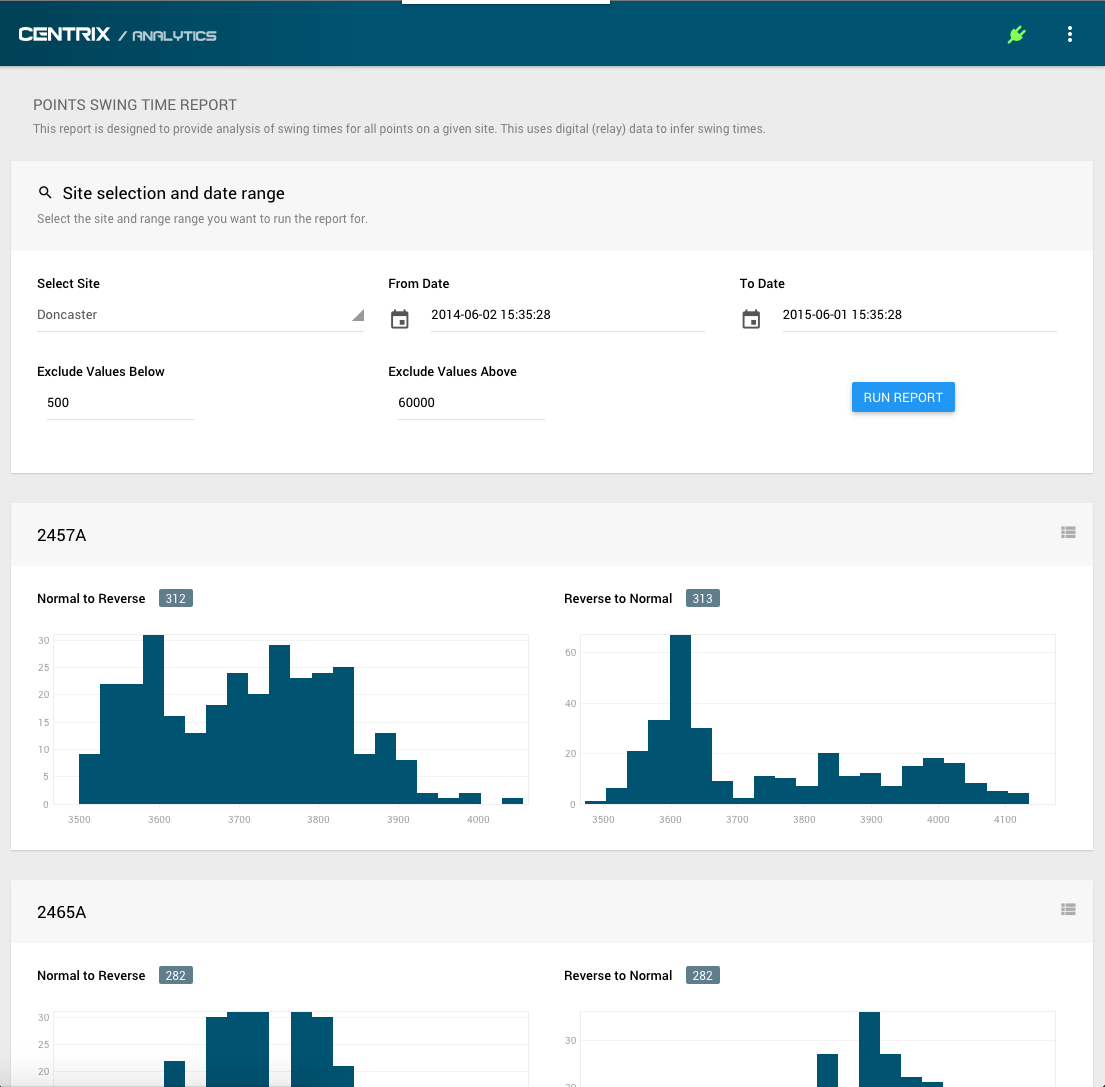
The report will show a histogram showing the distribution of durations for each asset for both the normal to reverse and reverse to normal directions.
Click the  icon to show the raw events that the histogram represents.
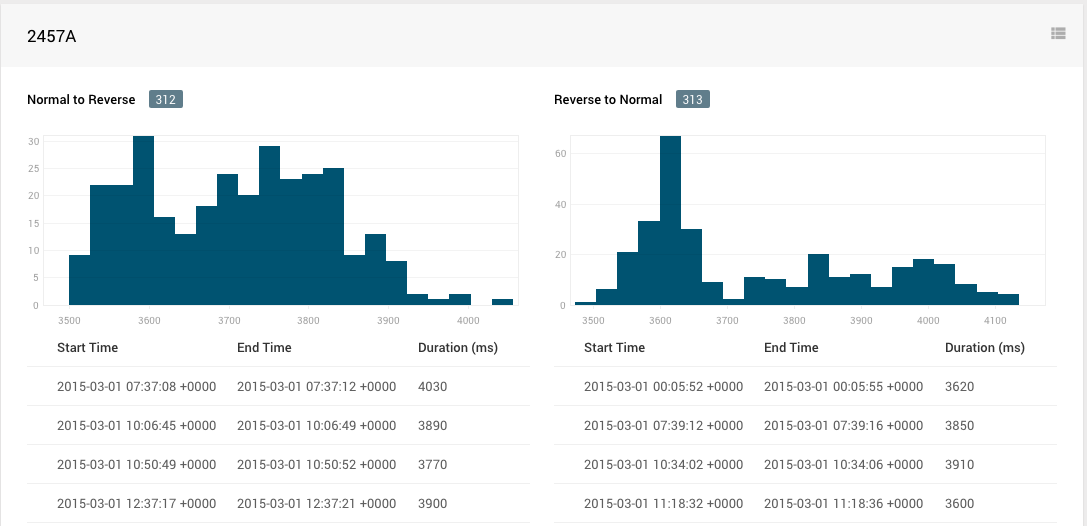
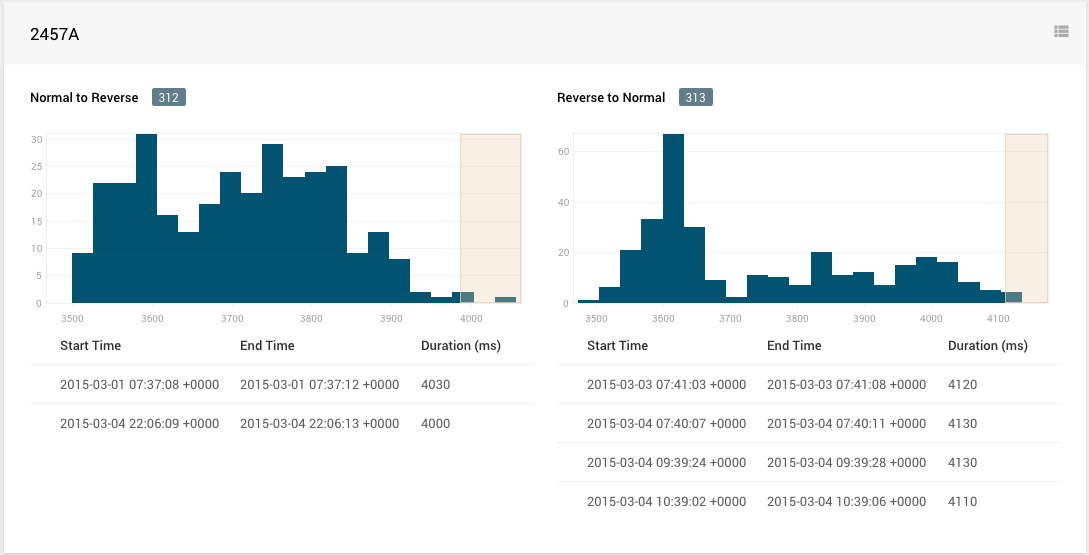
You can filter the raw events for a specific duration range by selecting a range on the histogram.
BETA
This functionality was added into this release with minimal features as a basis for further development and to gather requirements feedback. If you have any comments or requests for enhancements, please get in touch. We acknowledge this feature is lacking some expected basic functionality and has an increased risk of containing bugs.
Browser compatibility
As per the previously issued Browser Compatibility Notice, this feature will not function on legacy browsers.
Logger Contact Alarm Enhancements
The Logger Contact Alarm has been extended to support all currently available logger types; SA380, SA380TX/L, SA-SSI, TDM. Consequently you can receive an alert if any of your loggers have not communicated with Centrix for a specified period of time.
Sequencing Timing Report Filtering
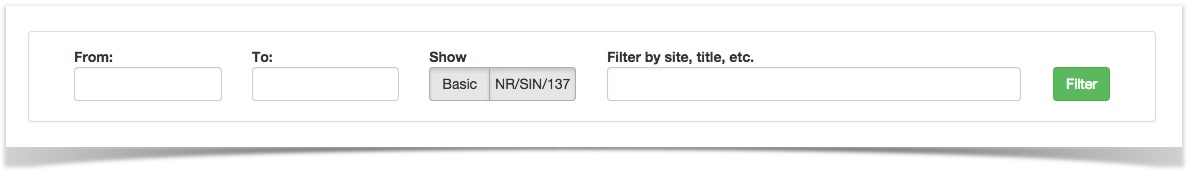
The sequence timing report listing can now be filtered by specific parameters to more easily find the report(s) you are looking for;
| Field | Description |
|---|---|
| From | The date from which to find reports for (uses the start date of the report data range) |
| To | The date to which to find reports for (uses the start date of the report data range) |
| Show (Report Type) | Show only Basic or SIN/137 report types |
| Text Search | Search by site name and report title |
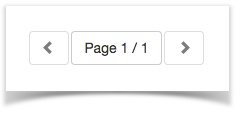
The report listing is also now "paged" to restrict the number of reports shown on the page. This improves the loading performance of the page.
RDAQ Loggers UI Fixes
- Fixed the real-time message log when using the "selected logger" filter on RDAQ loggers panel.
- Fixed the enabled tick/cross column and edit button on the loggers dialog where unicode font characters are not available.