Centrix R73 Release Notes
- Jamie (Deactivated)
- James Spencer
- Robert Hunt (Unlicensed)
Health dashboard configuration
Health Dashboards (Legacy) were introduced to in Centrix R71 for specific users as a trial.
This release extends the feature to allow dashboards to be fully configured by users.
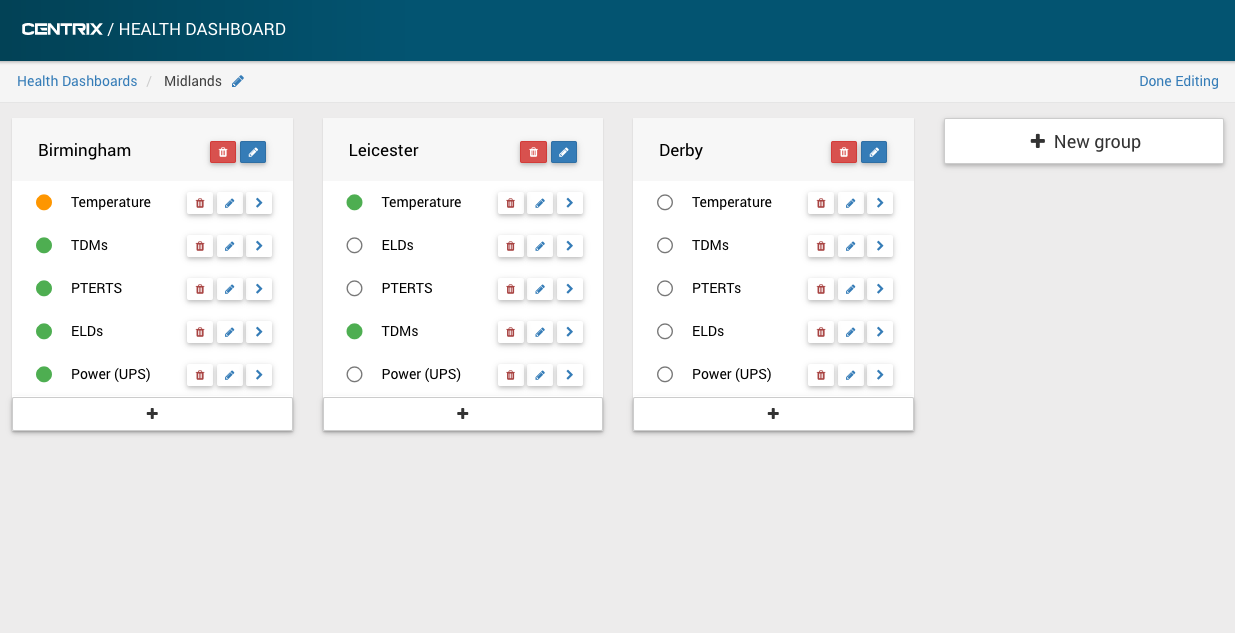
See Health Dashboards (Legacy) for full documentation of the new configuration features.
Graphs
EXPERIMENTAL
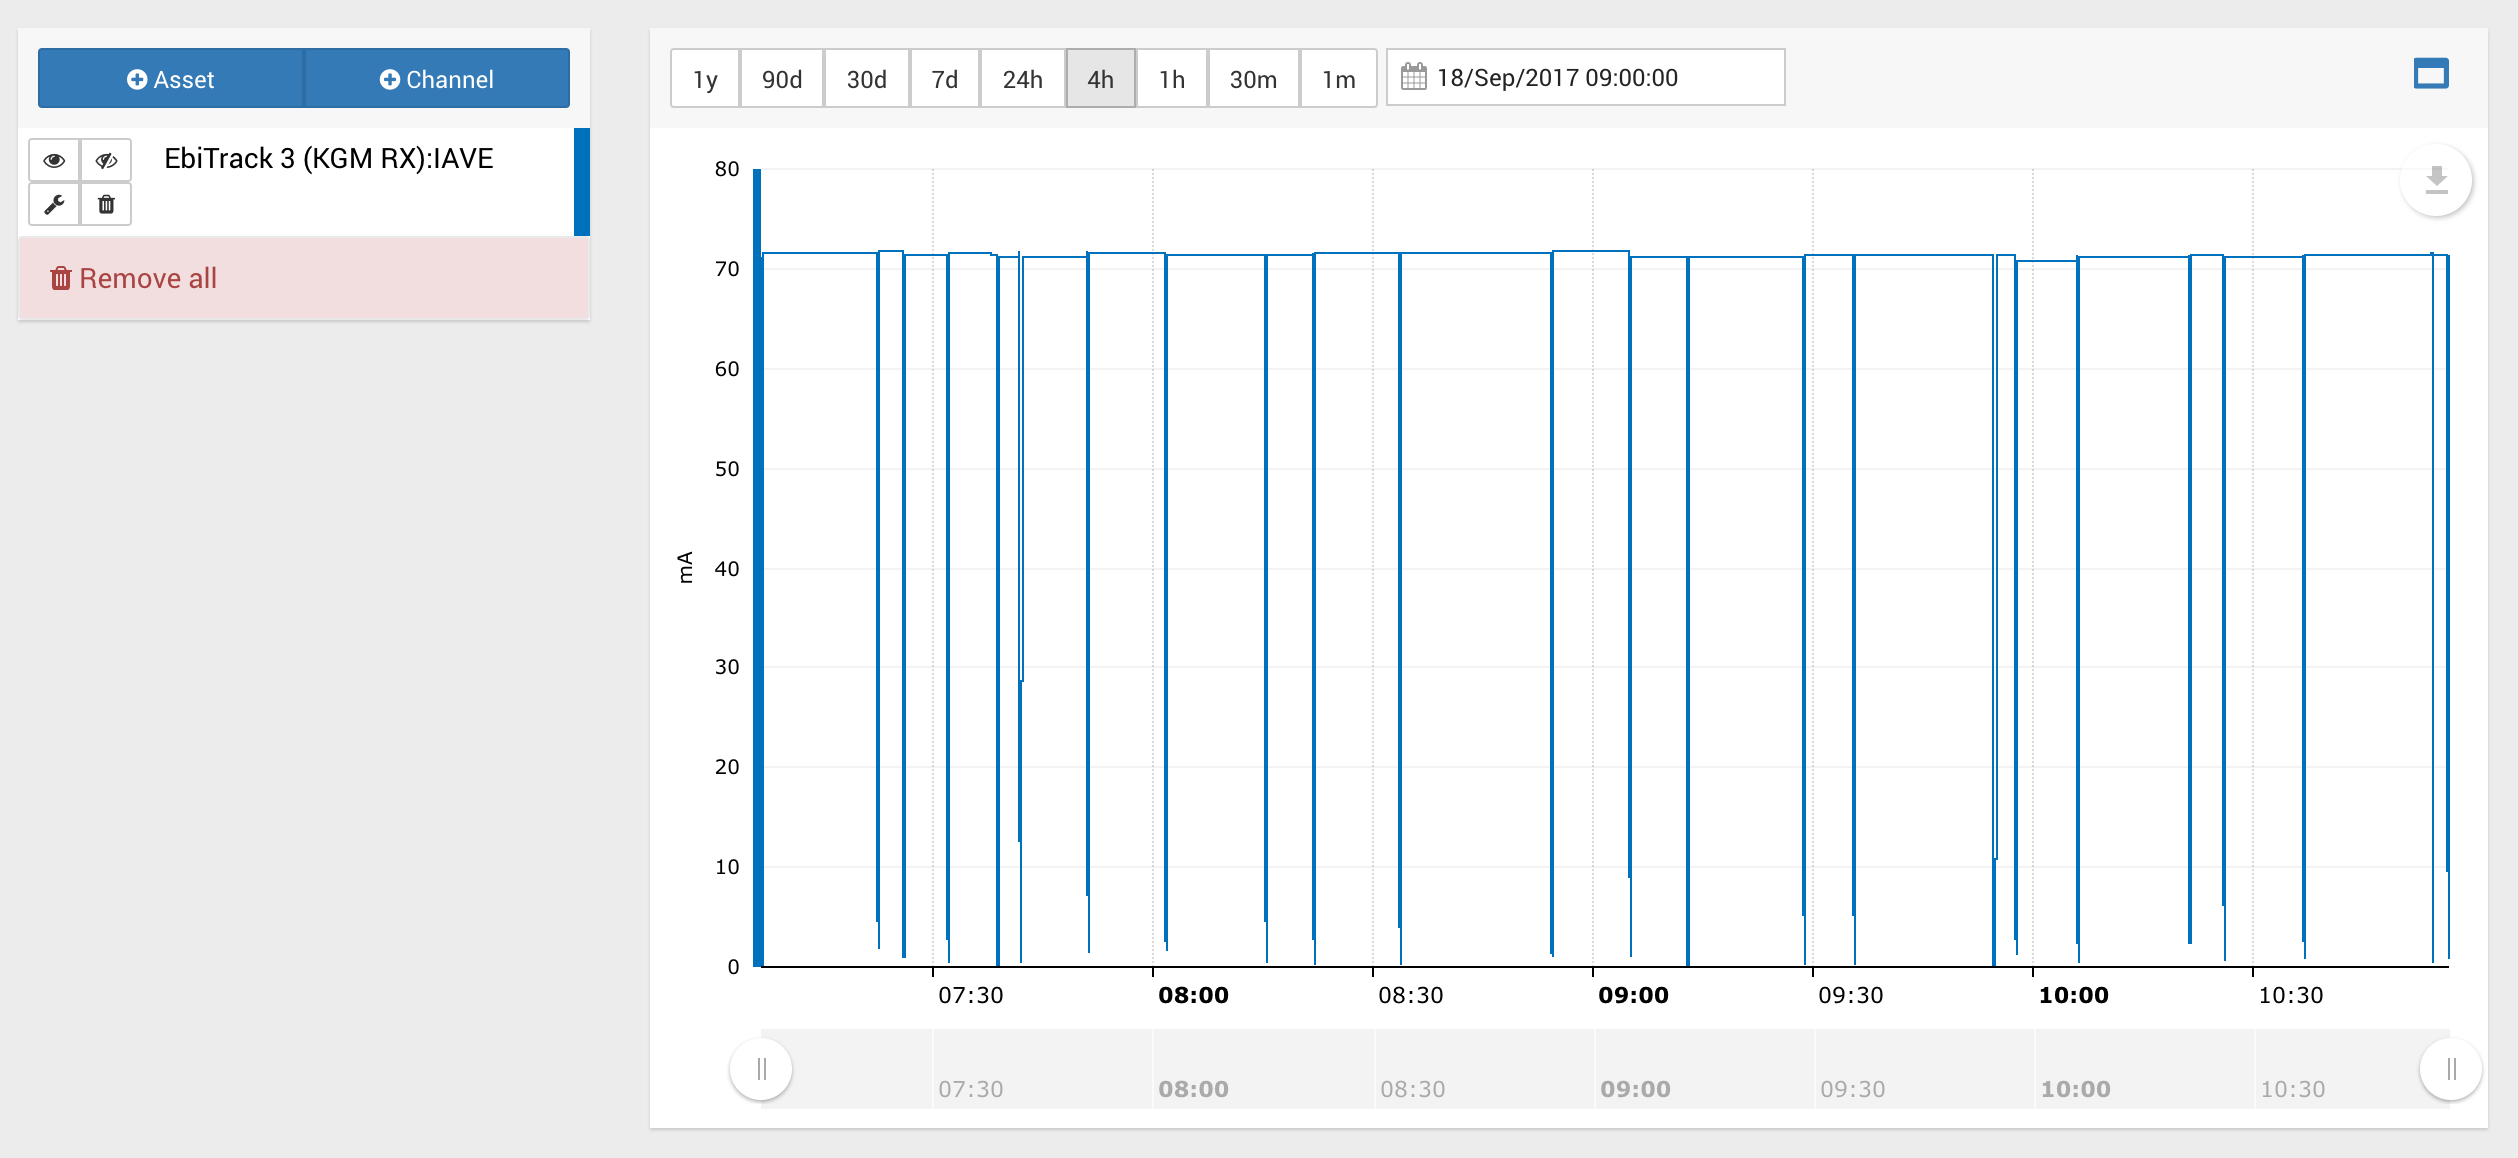
This release of Centrix introduces the new Graph feature, allowing you to graph channels/assets quickly from outside the Playback panel.
The Graph feature is available from the main menu; Inspect > Graph.
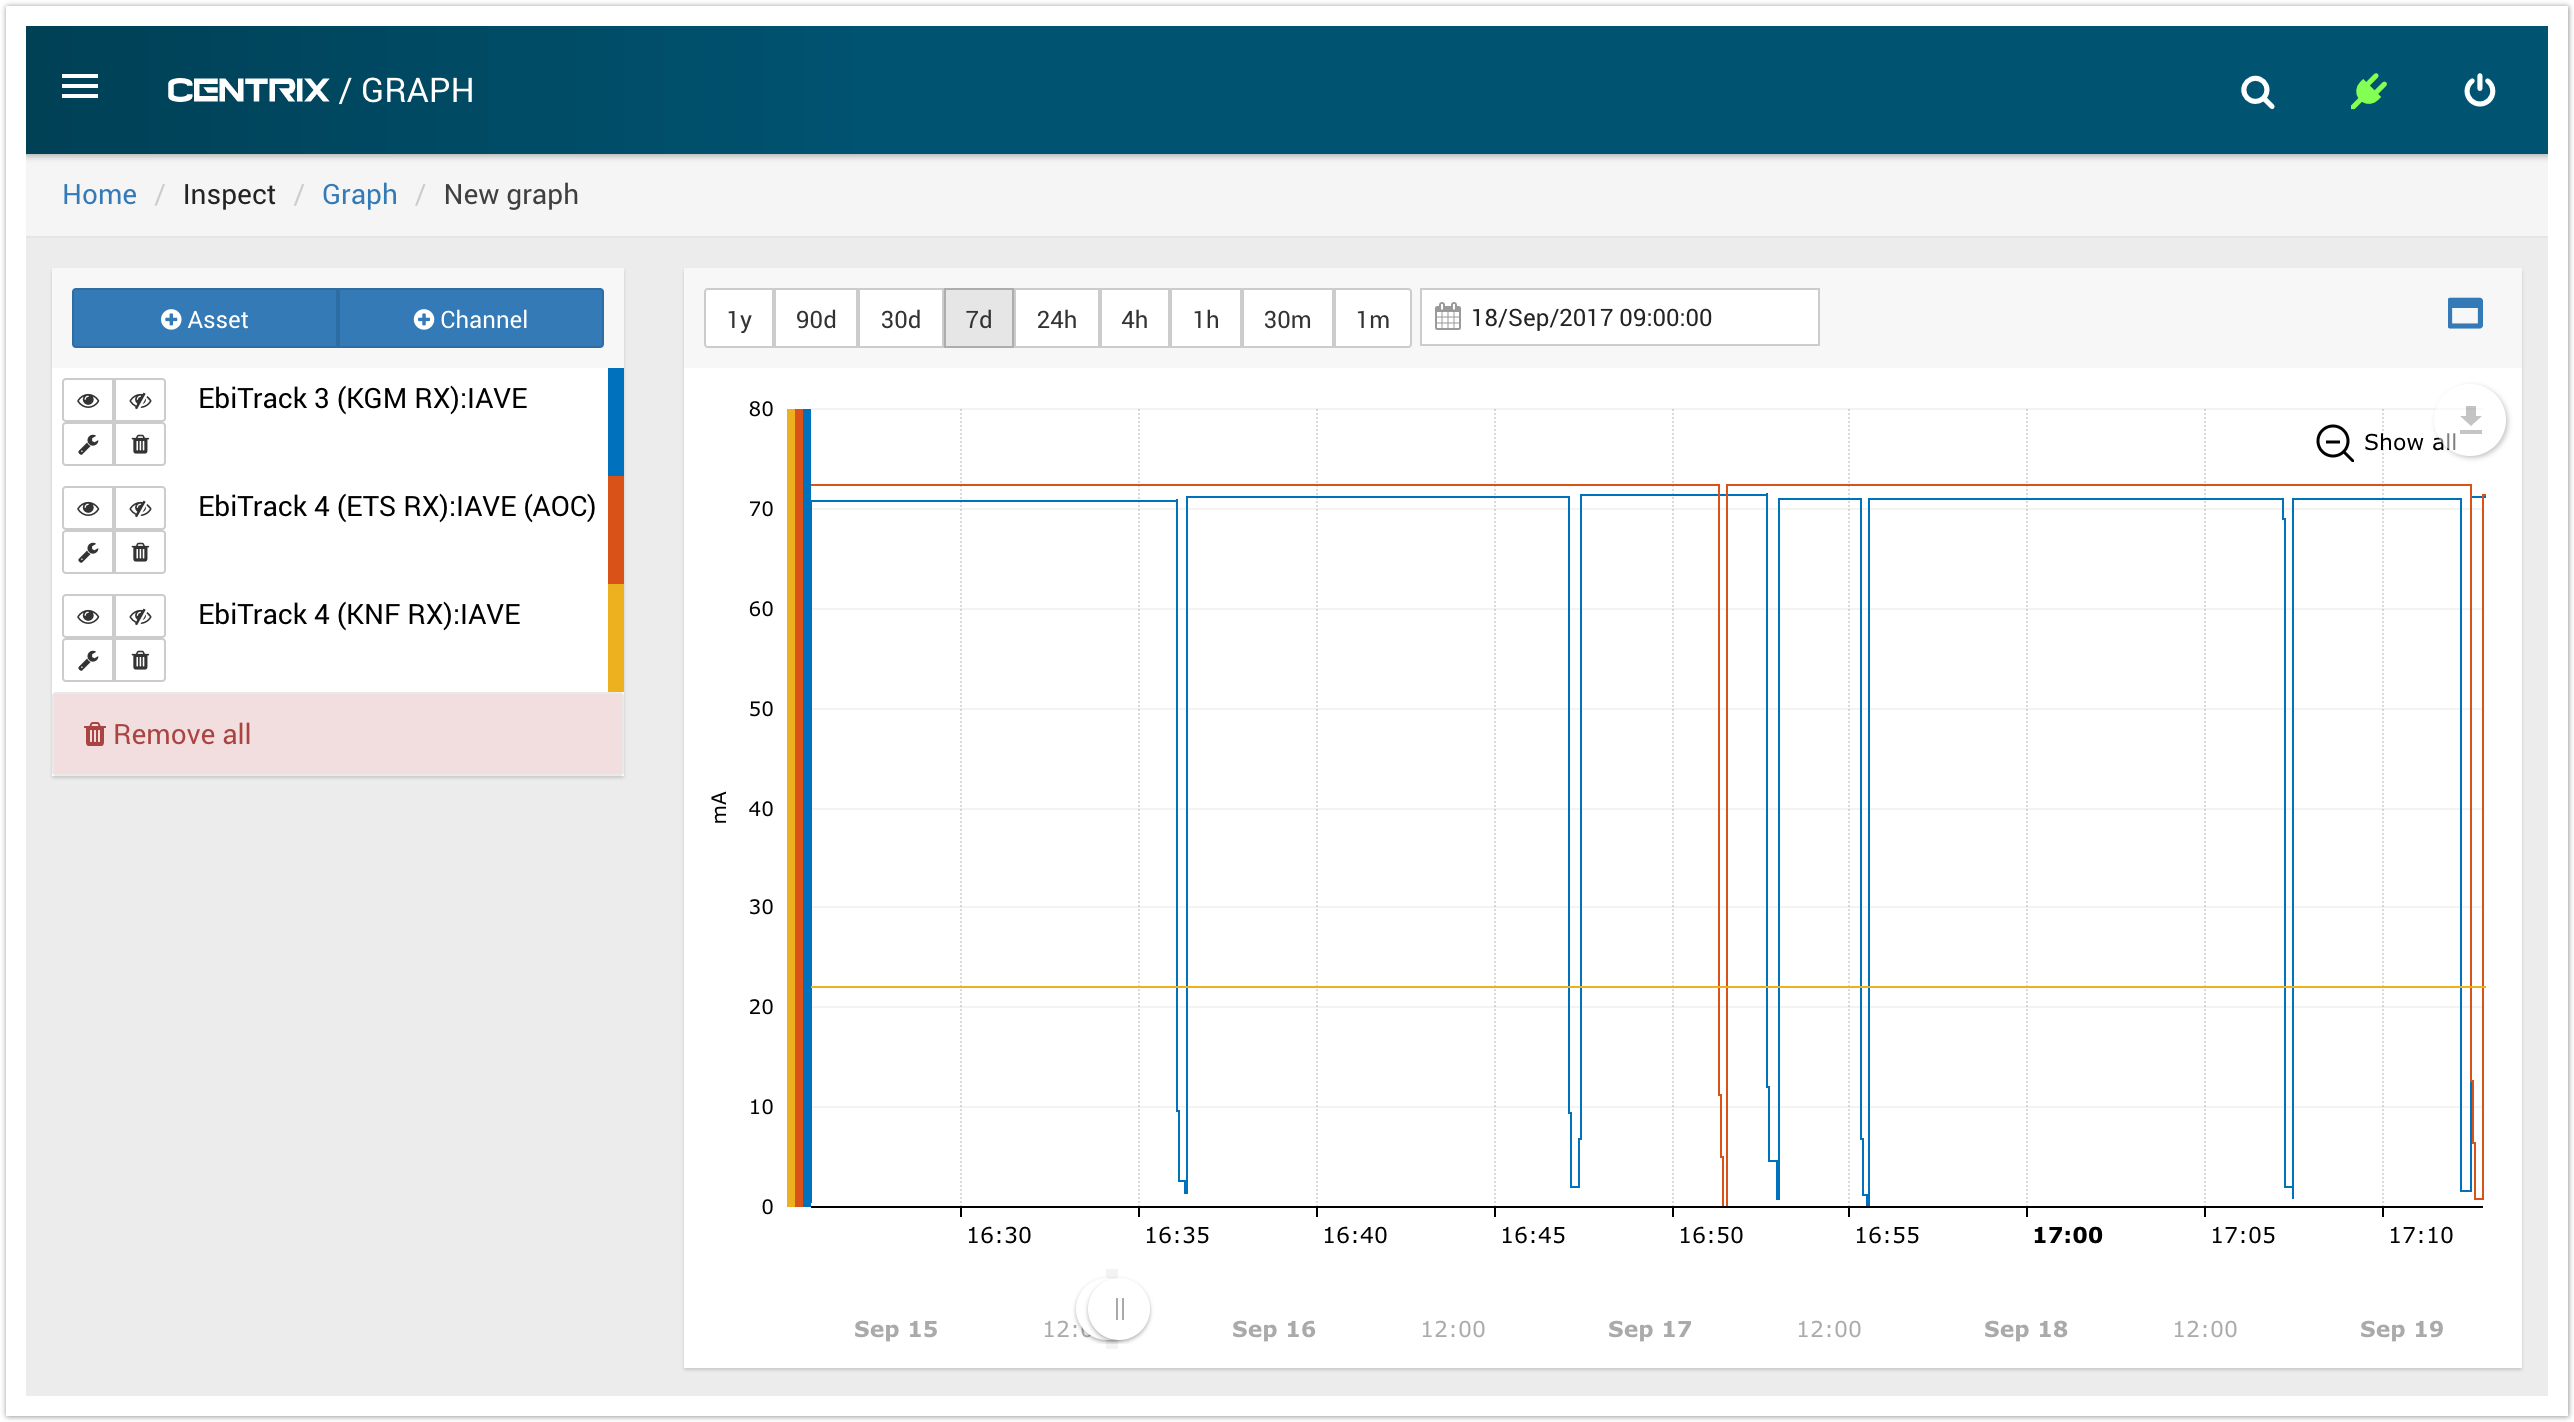
See Graph in the Centrix User Guide for more details of current functionality.
The following items will be implemented in a forthcoming release;
- Show data in site local time zone
- Improve data re-loading when zooming in/out of graph
- Configure colour of channel on a graph
- Configure axis position (left/right) of channel on a graph
- Support capture channels
- Support digital channels
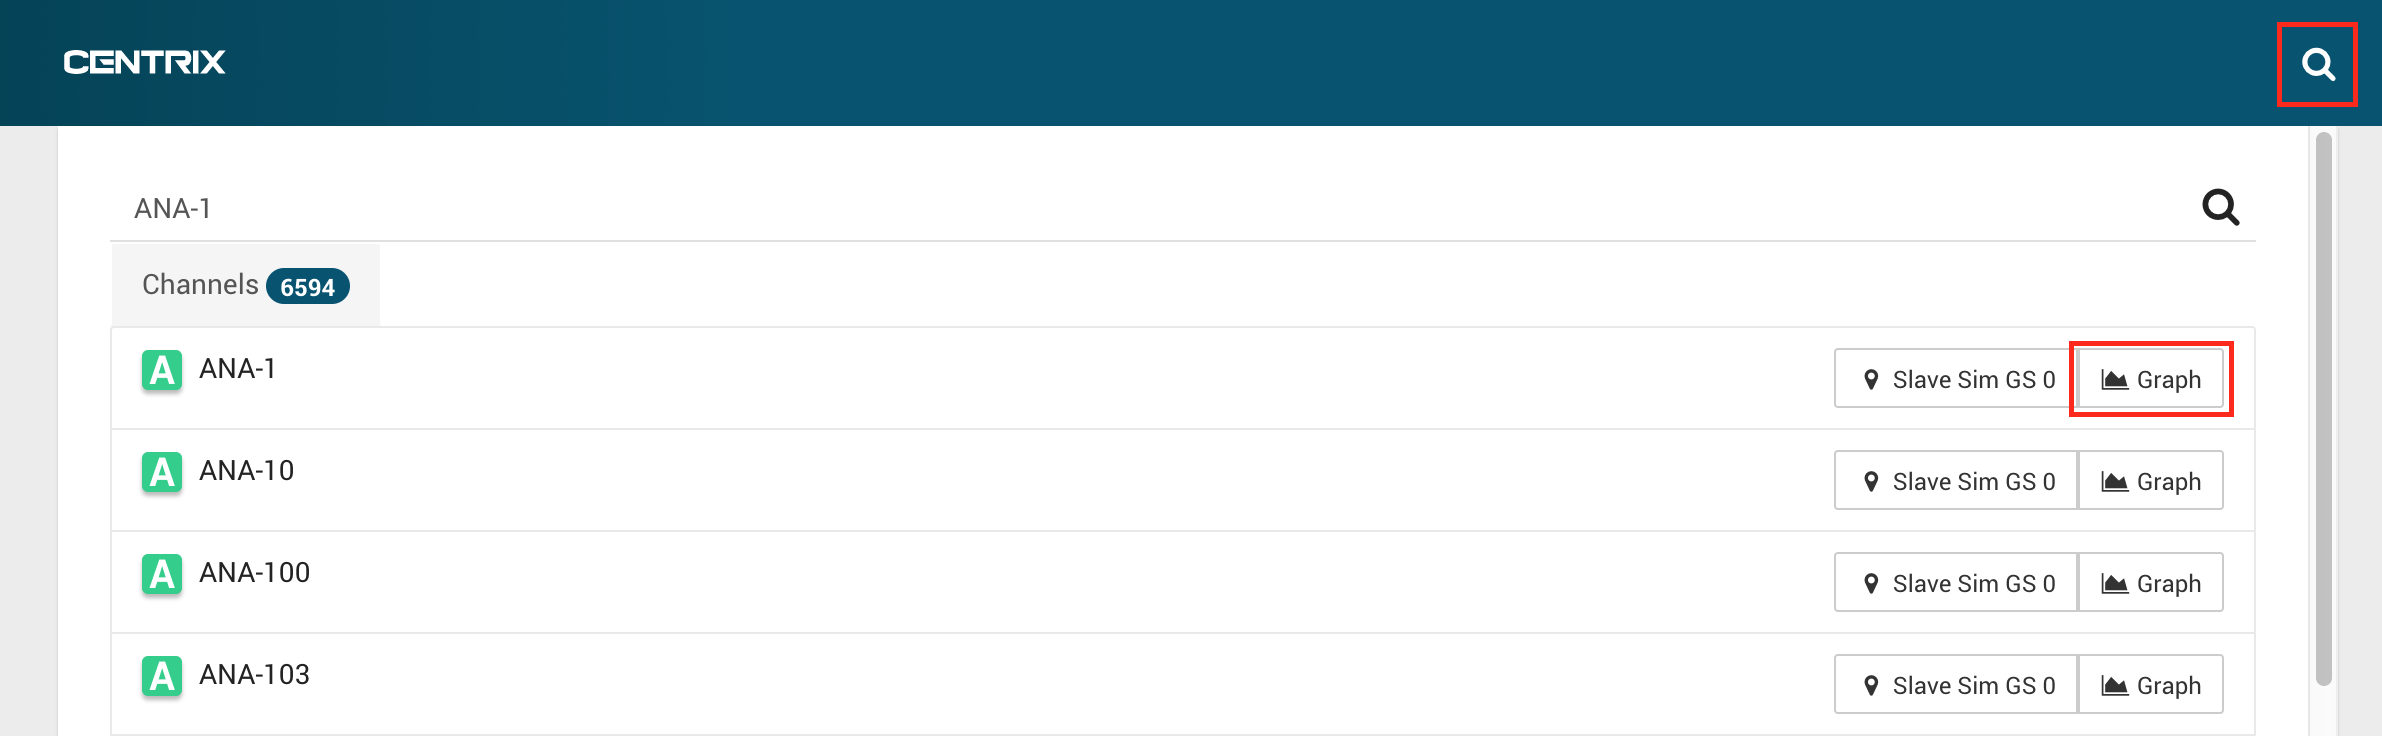
Graph a channel from global search
You can now graph a channel directly from the global search feature.
Open search > Enter the name of the channel > Click Graph.
Link to alarm detail page from e-mail
Alarm e-mails now contain a link to the Problem Details Page that was introduced in Centrix R72.
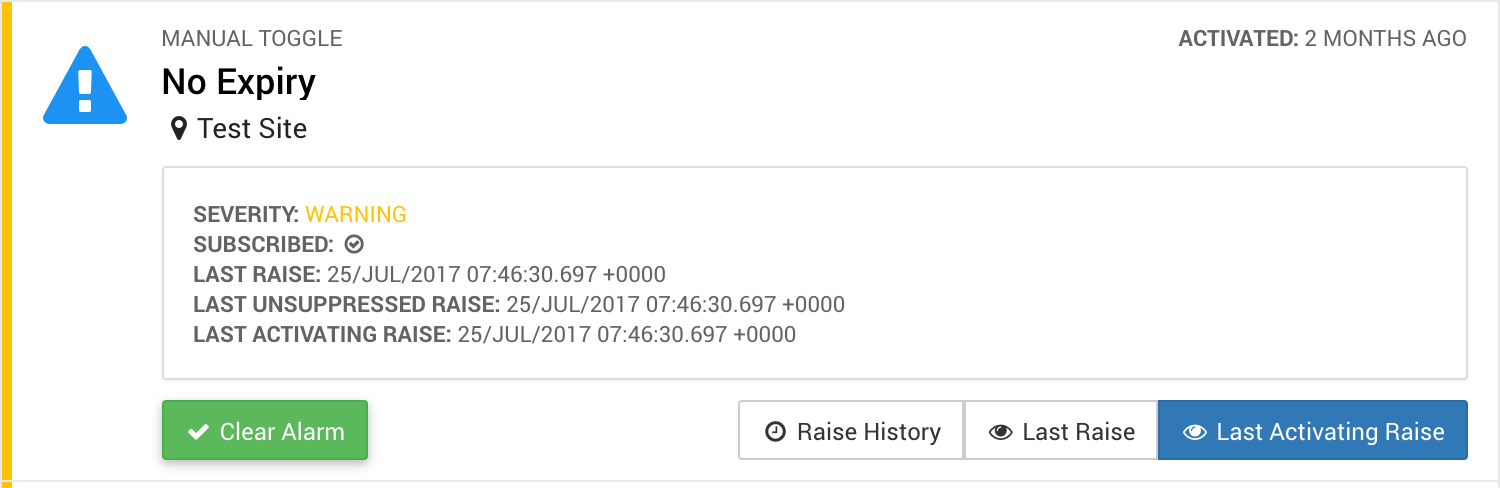
Alarm status now provides direct link to problem details page
The Problem Details Page page was previously only accessible by viewing the Alarm Raises for an alarm, and then pressing View Detail for a specific raise.
You can now get straight to the problem page from the Alarm Status page via the Last Raise and Last Activating Raise buttons.
Last Activating Raise will take you to the problem details page for the last raise that caused the alarm to trigger.
Last Raise will take you to the problem details page for the last raise that occurred, even if it was suppressed.
The existing Alarm Raises button has been renamed to Raise History.
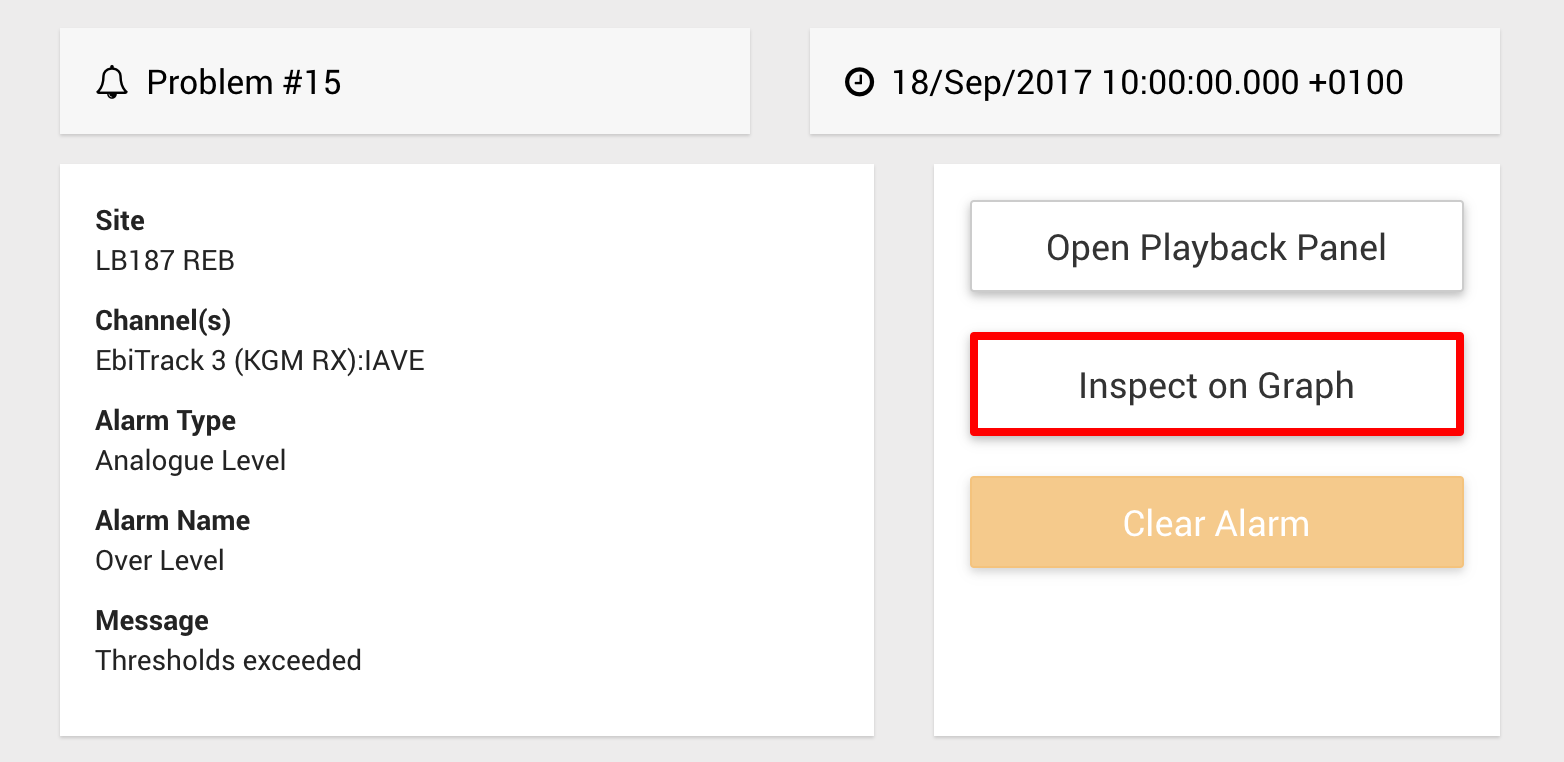
Added 'Inspect on Graph' action to alarm problem page
The Problem Details Page previously provided an action to open the Playback panel at the time of the alarm raise.
This release also adds an Inspect on Graph action for alarms with analogue channels. This will open the new Graph feature, with the alarm channel(s) and raise time selected.
|
|
|
Main menu & header changes
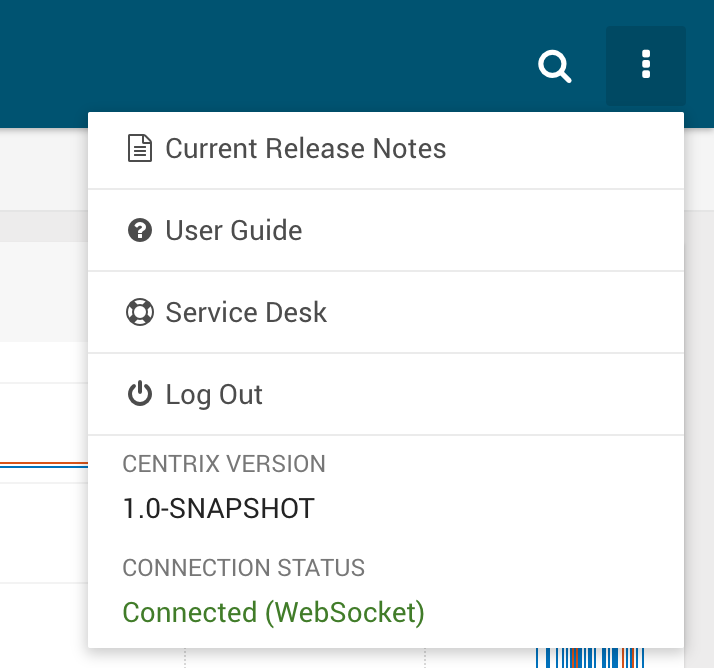
Header actions
There is now an actions dropdown located on the right of the page header. This replaces the existing connection status icon and also now houses the log out button.
User profile
You can access your user profile by clicking on your name from the main menu.
Captures / capture episodes
This release introduces a new Inspect menu item on the main menu. This will contain features for inspecting/analysing raw data.
The Captures and Capture Episodes have been moved into the Inspect sub menu.
Menu re-ordering
The items in the main menu have been re-ordered to place the most widely used functionality at the top of the menu.
User Admin converted to HTML
The User Admin page has been converted to HTML and will now work on mobile browsers.
%20(1).png?version=1&modificationDate=1506000565000&cacheVersion=1&api=v2&width=533&height=400)
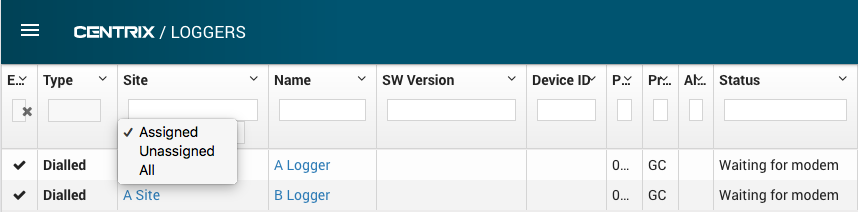
Unassigned loggers hidden by default
The Loggers page has been updated, adding a filtering option to the Sites column, hiding loggers which are not assigned to a site by default.
The filtering options are for loggers assigned to sites, not assigned to any site, and all loggers (named Assigned Unassigned and All, respectively).
Bugfixes
- Unified search now filters loggers correctly.