Centrix R36 Release Notes
- Jamie (Deactivated)
- Former user (Deleted)
- Tom Forster
DC / TI21 Track Circuit Alert Processor
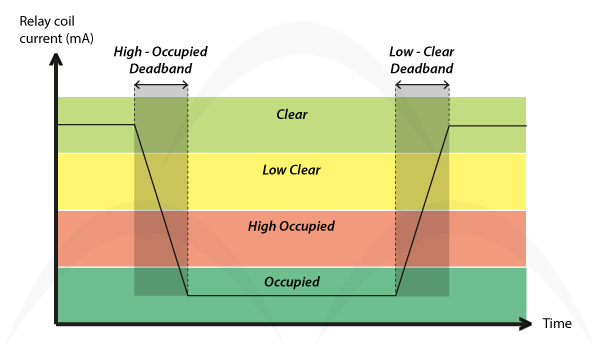
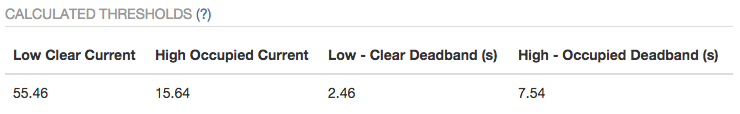
Centrix now supports alerting on track circuit current thresholds collected from analogue input channels. This alert processor uses 4 parameters to assess the health of a track circuit;
- Low Clear Current
- High Occupied Current
- Low to Clear Deadband (Rising Current)
- High to Occupied Deadband (Falling Current)
Configure a Track Circuit Alert
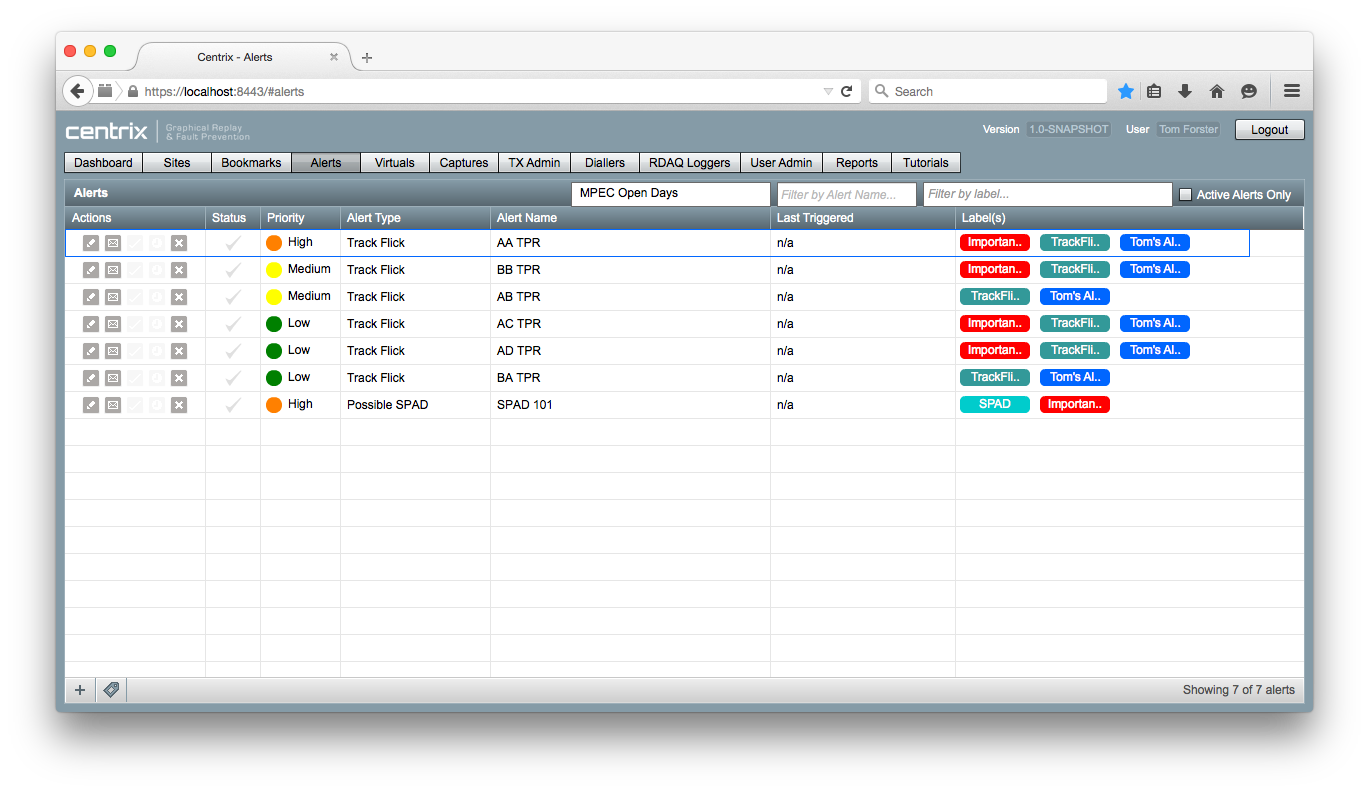
- Open Centrix and navigate to the Alerts tab.
- Click the + icon at the bottom left of the page to create a new alert
- Select Track Circuit and click Create Alert.
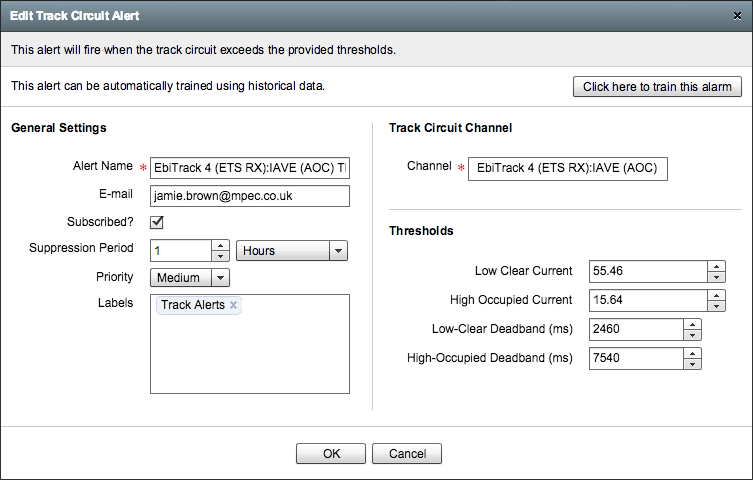
- To manually configure the alert, complete the form fields and click OK.
- To automatically configure the alert (trained from historical data), click the Click here to train this alarm button. See next section of release notes for alert training.
For TI21 track circuits you should select the average current channel (IAVE) for the track circuit channel.
DC / TI21 Track Circuit Alert Training & Validation
In addition to manual configuration of track circuit alerts, Centrix can also train the alert thresholds using an historical data set.
- Click the Click here to train this alarm button from the create/edit alert dialogue (see section above).
- A new window will open and you will be prompted for your username/password. Enter your Centrix login credentials.
Configuration
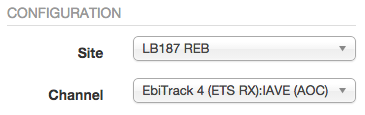
- Select the site you want to configure a track circuit alert for.
- Select the name of the track circuit channel you want to use for the alert.
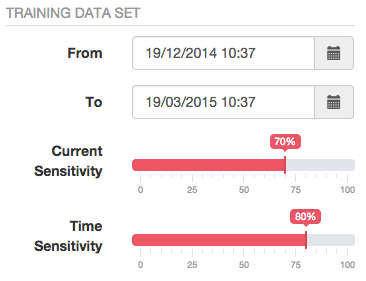
Training Data Set
This is the data set that will be used to train the alarm. You should select a range of normal operation, ideally without many faults or exceptions. The alert should ideally be re-trained after maintenance.
- Select the start date for the data you want to train the alert on.
- Select the end date for the data you want to train the alert on.
- Select a sensitivity % for the current thresholds (used to tweak the low clear / high occupied threshold calculations). Higher % is more sensitive.
- Select a sensitivity % for the time thresholds (used to tweak the falling & rising deadband threshold calculations). Higher % is more sensitive.
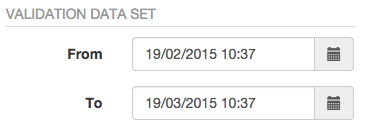
Validation Data Set
This is the data set that will be used to validate the alert thresholds. The alert will be tested against this data and you will be presented with a visualisation of the data showing how many alerts would have fired and allow you to inspect the alerts to verify their correctness. Ideally the validation data set should be different than the training data set.
- Select the start date for the data you want to validate the alert on.
- Select the end date for the data you want to validate the alert on.
Running & Interrogating the Training
- Click Run to run the training process and validate the data. This will take approximately 5-10 seconds depending on the size of your data sets.
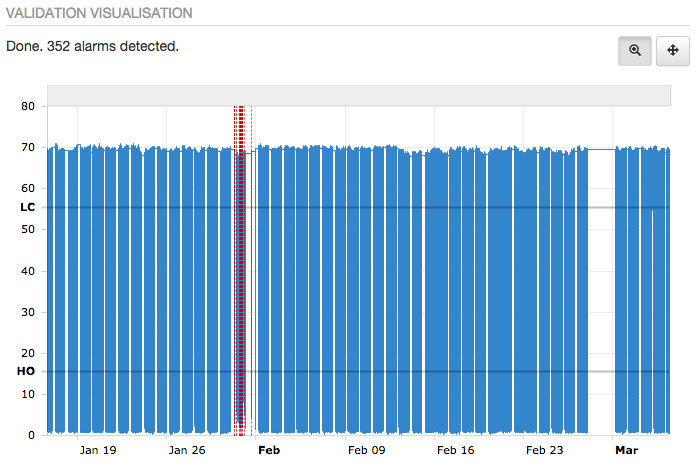
- The validation data set will be presented in a graph under the Validation Visualisation section.
- The alert thresholds will be calculated and displayed under the Calculated Thresholds section.
- The Low Clear and High Occupied thresholds will also be presented on the graph as guides on top of the validation data.
Validation Visualisation
- Once the training is complete a message will be displayed in this section saying Done. N alarms detected.
- If alarms were detected they will be presented as vertical red lines on the graph.
- The graph will automatically zoom to the data range between the first and last alarm that was detected.
- You can click and drag to zoom the graph into a specific range.
- Click Show all on the graph to zoom back out to see the entire range of the validation data set.
- Click the
 button above the graph to switch to panning mode. In this mode you can click and drag on the graph to navigate through time.
 - Click the
 button above the graph to switch to zooming mode. In this mode you can click and drag to zoom in to a time range on the graph.
Creating / Updating an Alert
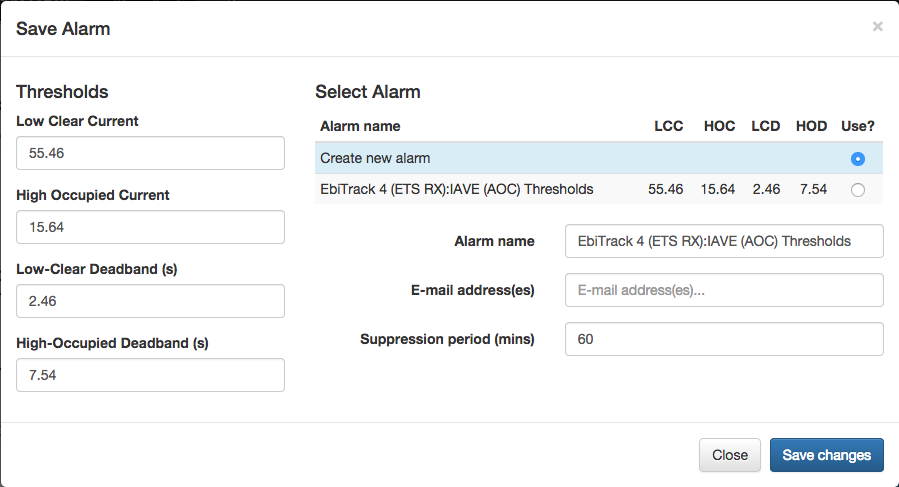
- When you are satisfied with the alert thresholds, click the Create/Update Alarm button under the Calculated Thresholds section.
- You can now tweak the threshold values if you wish by editing them under the Thresholds section.
- You can elect to either create a new alarm or update an existing one using the table under the Select Alarm section. If there are no existing alarms for this track circuit channel you will only be provided with the Create new alarm option.
- To update an existing alarm, click on the radio button under the Use? column next to the alarm you want to update.
- Fill in the remaining fields to configure the alarm, these work in the same way as other alert types in Centrix.
- Click Save changes to update/create the alarm.
Alerts can be further configured from the Alerts tab within Centrix, they will appear in the listing as soon as you save the alert.
Browser compatibility
As part of our long term strategy to provide support for a wider range of devices (including mobile) and to enable rapid UI development, we will not be continuing to support legacy browsers for some newly developed features. The alert training/validation feature falls under this category.
See Browser Compatibility Notice for more details.
Alert Labels
It is now possible to create labels as a way to categorise and subscribe people to alerts.
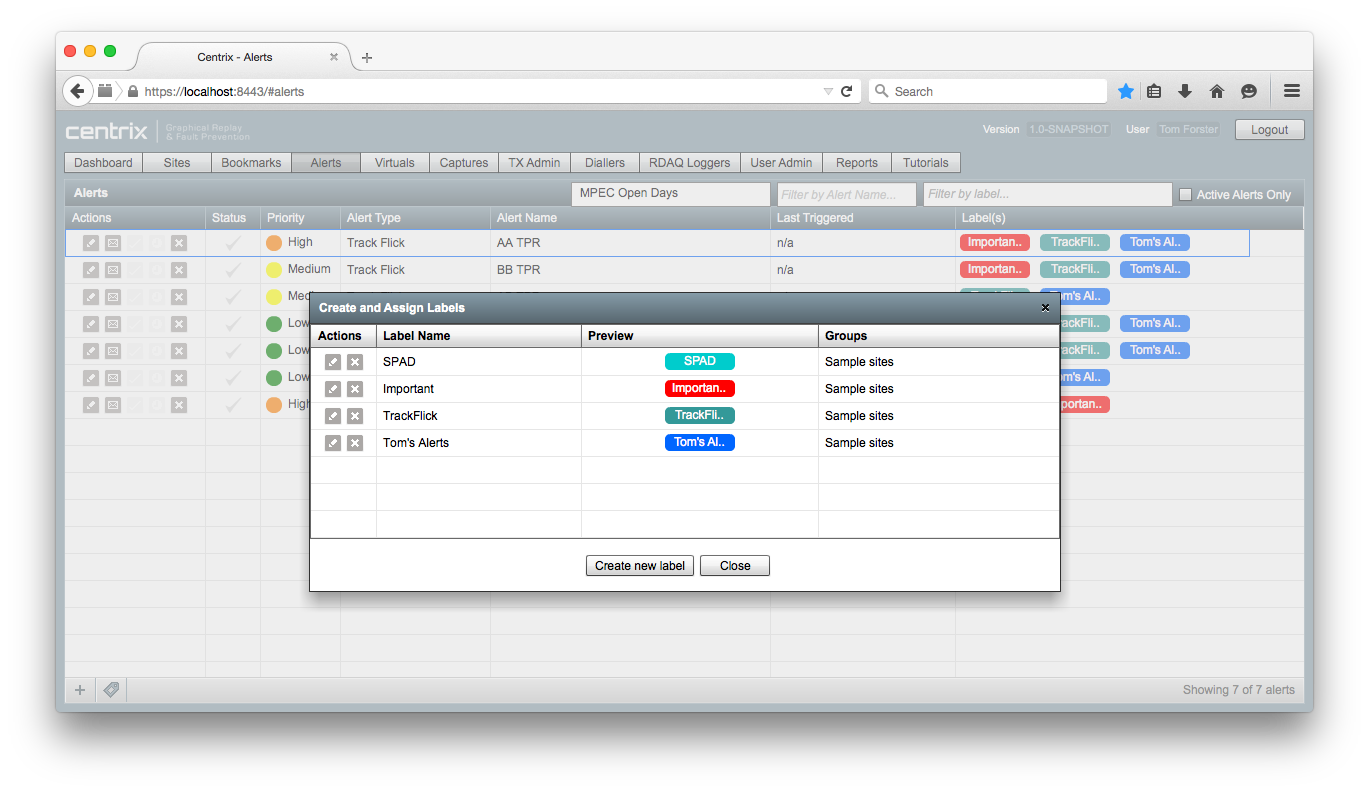
Create a new label
- Open Centrix and open the Alerts tab.
- Click the
 button in the lower left of the page.
 - Click Create new label.
- Complete the fields on the form;
- Label name; the name of the label, try to keep this clear and concise (ideally 8 characters or less)
- Emails; the list of e-mail addresses that should be notified when any associated alert fires (comma separated for multiple addresses)
- Label colour; the colour of the label when it appears on the alert listing
- Group(s); the groups you want to associate this label to (only applicable if you are a member of multiple groups)
- Click OK to create the label.
Associate a label to an alert
- Click the Edit button in the Actions column for the alert to open the edit dialog.
- In the Labels box, begin typing the name of the label you wish to associate. Select the one you want to associate.
- Repeat the above step until you have associated all the labels you want for this alert.
- Click OK to save the alert.
When an alert is raised, it will be e-mailed to all the addresses that are configured on the alert as well as all the e-mail addresses that belong to any associated label. This allows subscriptions to be configured on both individual alert and category level.
Alerts can be filtered by labels using the 'filter by label..' box at the top right of the screen. Multiple labels can be selected at once.
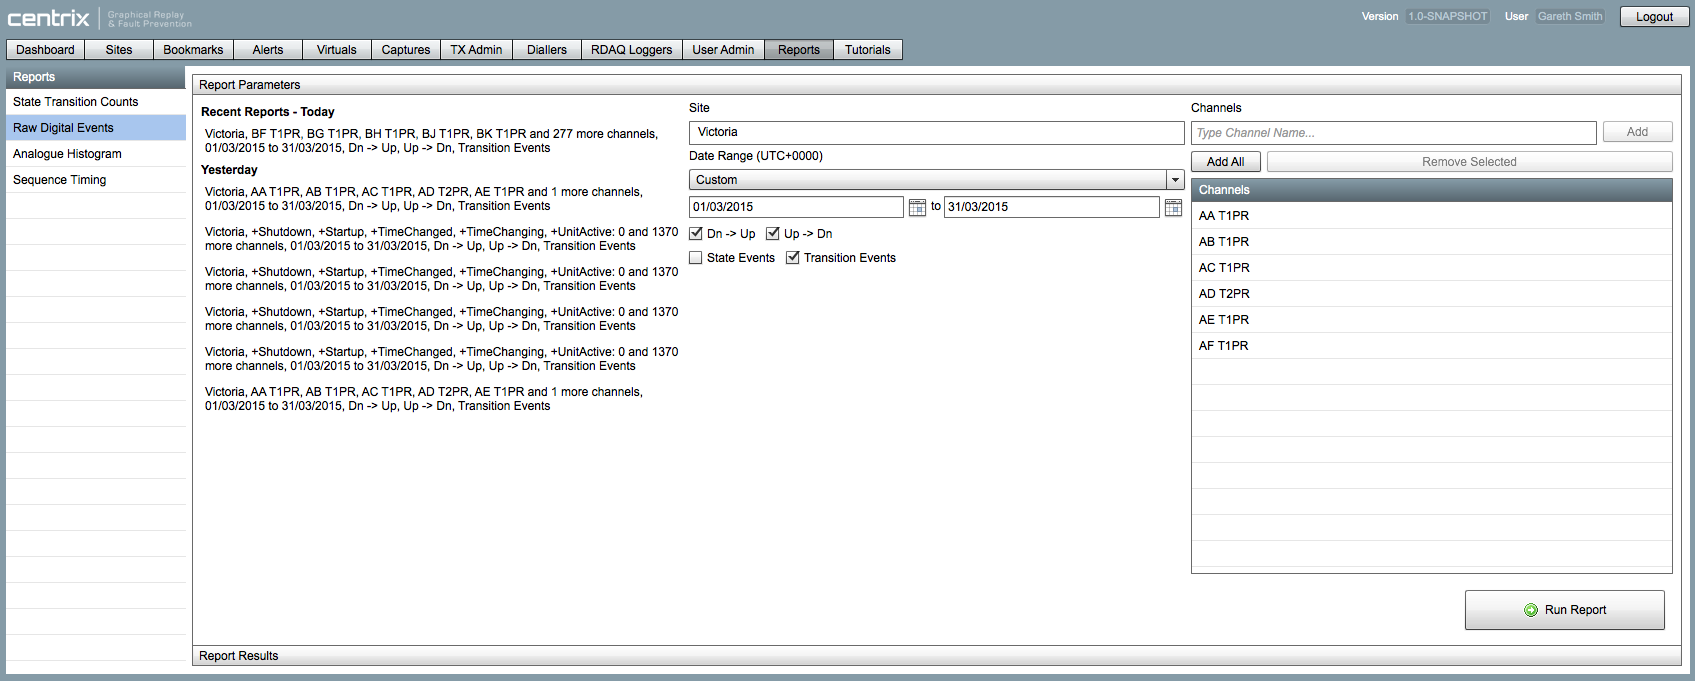
Report Parameter Saving
When you run a report, the parameters that you choose are now saved. You can easily run the same (or similar) report in future by selecting the parameters from the list of recent reports.