Centrix R40 Release Notes
- Jamie (Deactivated)
Trending capture trace features
Prior to this release you could see the features (average current, max current, swing time etc) of triggered captures from the captures view, but there was no way to trend or easily plot these values over time.
Now, when a capture channel is mapped (from a DA_WAVEFORM input) Centrix will automatically create the following 16 feature channels;
| Channel Name | Units | Description |
|---|---|---|
<Capture Channel Name> : AVE | (same as capture channel) | Average value (e.g. Current) from all the data points in the trace |
| <Capture Channel Name> : MAX <Capture Channel Name> : MAX (N-R) <Capture Channel Name> : MAX (R-N) <Capture Channel Name> : MAX (INV) | (same as capture channel) | Maximum value (e.g. Current) from all the data points in the trace |
| <Capture Channel Name> : TOT <Capture Channel Name> : TOT (N-R) <Capture Channel Name> : TOT (R-N) <Capture Channel Name> : TOT (INV) | (same as capture channel) | Total value of all the data points in the trace |
| <Capture Channel Name> : LEN <Capture Channel Name> : LEN (N-R) <Capture Channel Name> : LEN (R-N) <Capture Channel Name> : LEN (INV) | ms | Length of the trace in milliseconds |
Every time a capture trace is created, analogue events will be created on the above channels. This data can then be used in reports (e.g. Analogue Histogram) and also plotted on a graph in the playback screen to trend/inspect the data over time.
All existing captures will have the new feature channels mapped automatically, so there is no need to perform a re-mapping. Note that data on these feature channels will only be available from the date of this release forwards, historic values will not be calculated retrospectively.
We have created a process that will create the values for historical capture traces retrospectively. This process will be invoked after the release is live, so historical data should be available within 24-hours of the release.
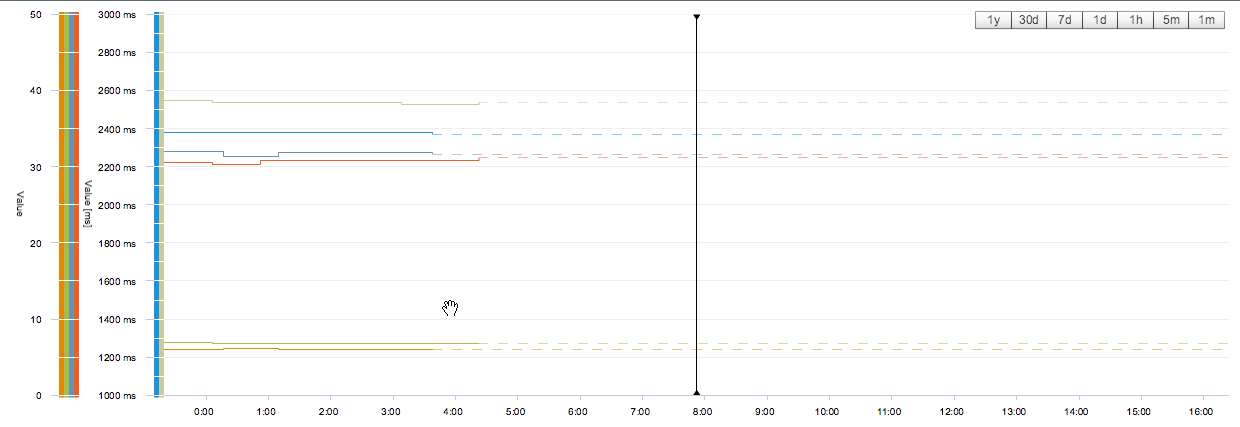
Line projection on analogue graphs
When viewing analogue data on the Playback screen lines will now continue at the value of the last point to infinity. This is particularly useful when you have a channel that doesn't change value for a long period of time but want to be able to reference it against another channel.
The line continuation is drawn as a dashed line in the same colour as the main line so you can clearly see where the value is a projection rather than an actual data point from a field logger.
TX admin logger filtering
You can now filter (by site / location name) the logger listings on the TX admin page.