Graph
- Jamie (Deactivated)
| How to access | Main Menu > Inspect > Graph |
|---|---|
| Documentation updated |
|
Experimental
This is the 1st iteration of development for this feature, and has consequently been marked as experimental. We know there is some missing functionality and improvements to be made, but we'd be happy to hear any specific feedback you may have.
Contents
Overview
The Graph feature provides a way to visualise one or more channels on a time-series graph.
This replicates much of the functionality available using the Graphs widget in the Playback panel. However, this feature has been implemented in HTML5, offering support on a wider range of devices and performance benefits.
Creating a graph
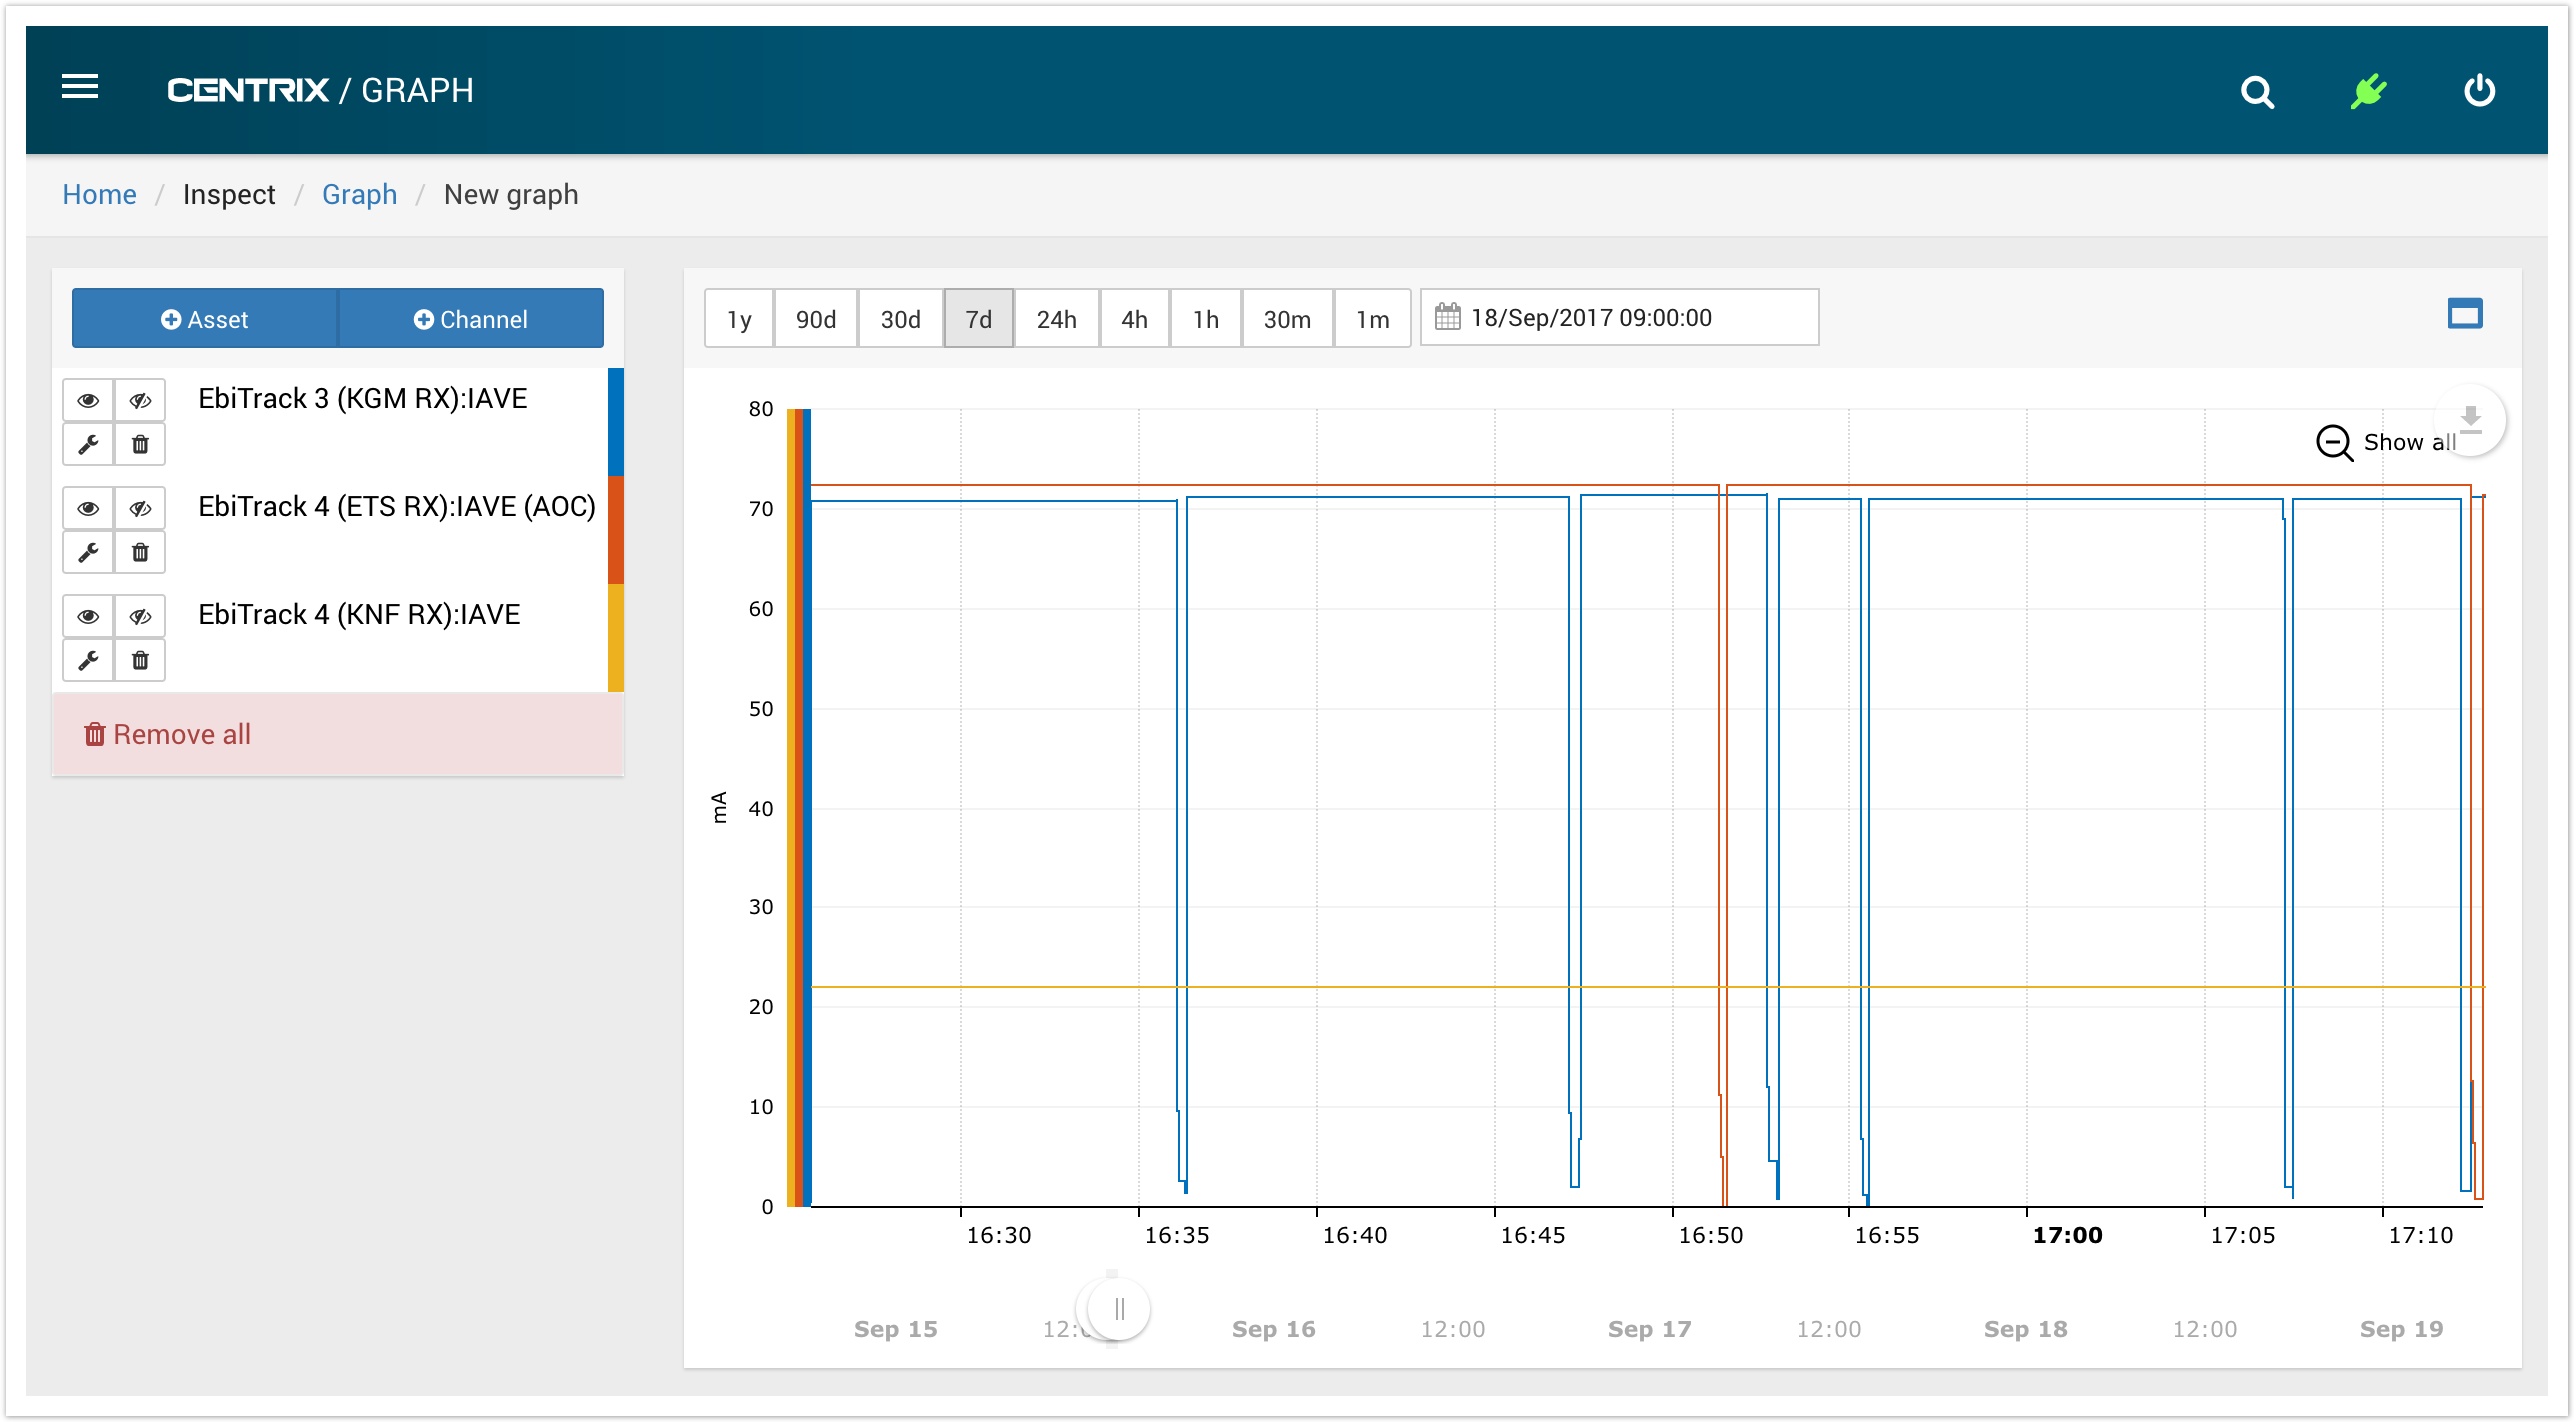
Upon accessing the Graph feature, you will be presented with the graph builder view.
Add a channel
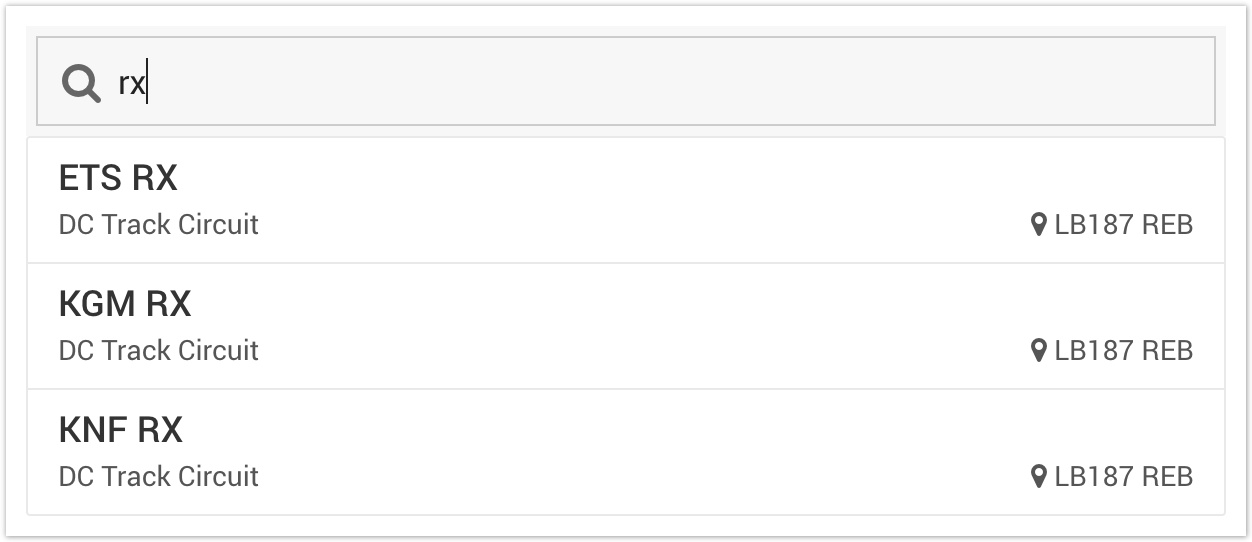
If you have Assets configured in your system, you can use the (+) Asset button to channels associated with an asset to the graph. This will allow you to find an asset by name, rather than searching for individual channels.
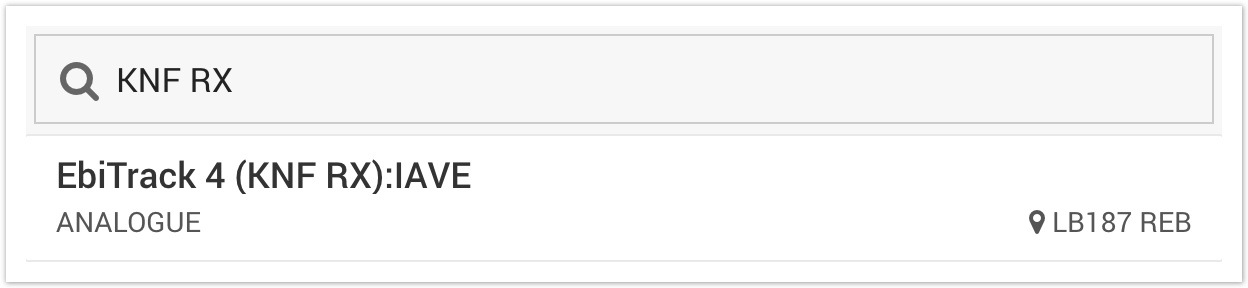
Alternatively, click (+) Channel and select an individual channel to add to the graph.
Selecting a date/time and range
Above the graph there are options available to select the time range for the data to show on the graph. You can also select the base date/time.
The date/time selected will act as the central inspection point for loading data. Centrix will load data either side of that point to create a window of data the size of the selected time period.
The graph will only show data within the selected window and will zoom to the range of available data.
Toggle the visibility of channel(s) on the graph
There are two methods to toggle visibility of channels on the graph. You can either;
 Solo (hide others)
The "solo" action will hide all other channels on the graph, showing only the selected channel. Click the button again to de-solo the channel.
 Hide
Hide
The "hide" action will hide only the selected channels, leaving other channels as they are. Click the button again to unhide the channel.
 Remove
The "remove" action will completely remove the channel from the graph.
Configure the axis scaling for a channel
By default, Centrix will group all channels sharing the same Display Units onto the same axes. The scaling of the axis will be automatic based on the extremes of all channels placed on the axis.
The axis will be coloured to match the channel(s) that are attached to that particular axis. This can be 1 or more channels.
To configure the axis for a channel, click the ![]() button on the channel you want to configure.
button on the channel you want to configure.
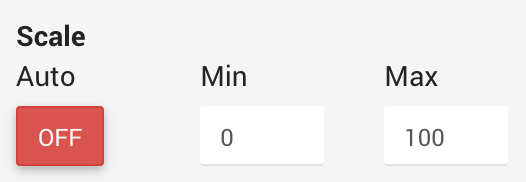
The default scaling will be shown as Auto.
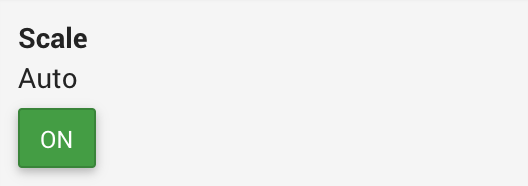
Click ON to toggle the auto mode off. You can now enter the minimum and maximum values to scale the axis.
Click the ![]() button again to apply the changes.
button again to apply the changes.
Click OFF if you want to toggle the auto mode back on.
Save a graph
Once you have created or amended your graph, you can save it for future use, or to share with colleagues.
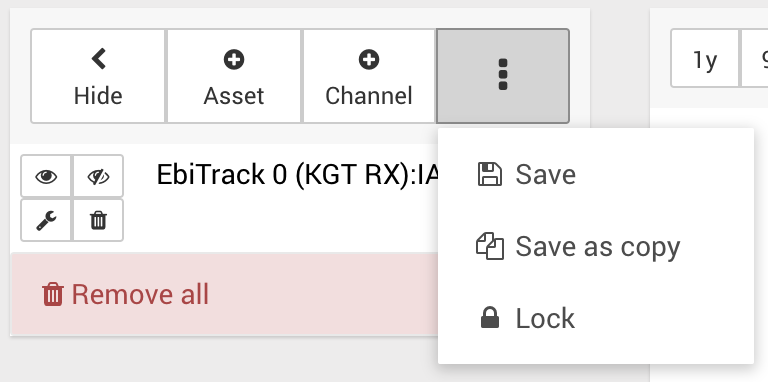
Click Save to save the currently open graph.
Click Save as copy to save the changes to a new graph, keeping the existing graph as it was before you made changes.
If a graph is locked, and you are not the owner, you will not be able to save the current graph. However, you can use Save as copy to make a copy of the graph with your changes, and you will be the owner of the new graph.
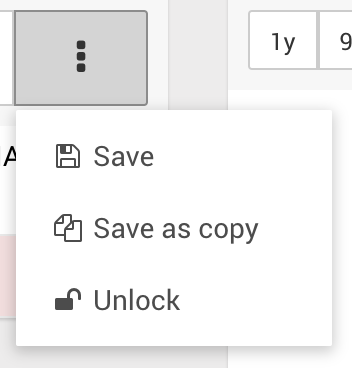
Lock/unlock a graph
Once you have created a graph and configured it as desired, you can lock the graph to avoid unwanted changes. Once a graph is locked, only the owner can save or unlock it, so no other users can save their changes.
Other users will be able to change the configuration after opening the graph, but will need to use the Save as copy function to save their changes.
|
|
Load a previously saved graph
Graphs that have been saved either through this Graph view or on a site's Playback panel can be opened in the new Graph view.
Click the Open Existing button in the top right of the graph page to be taken to the graph listing.
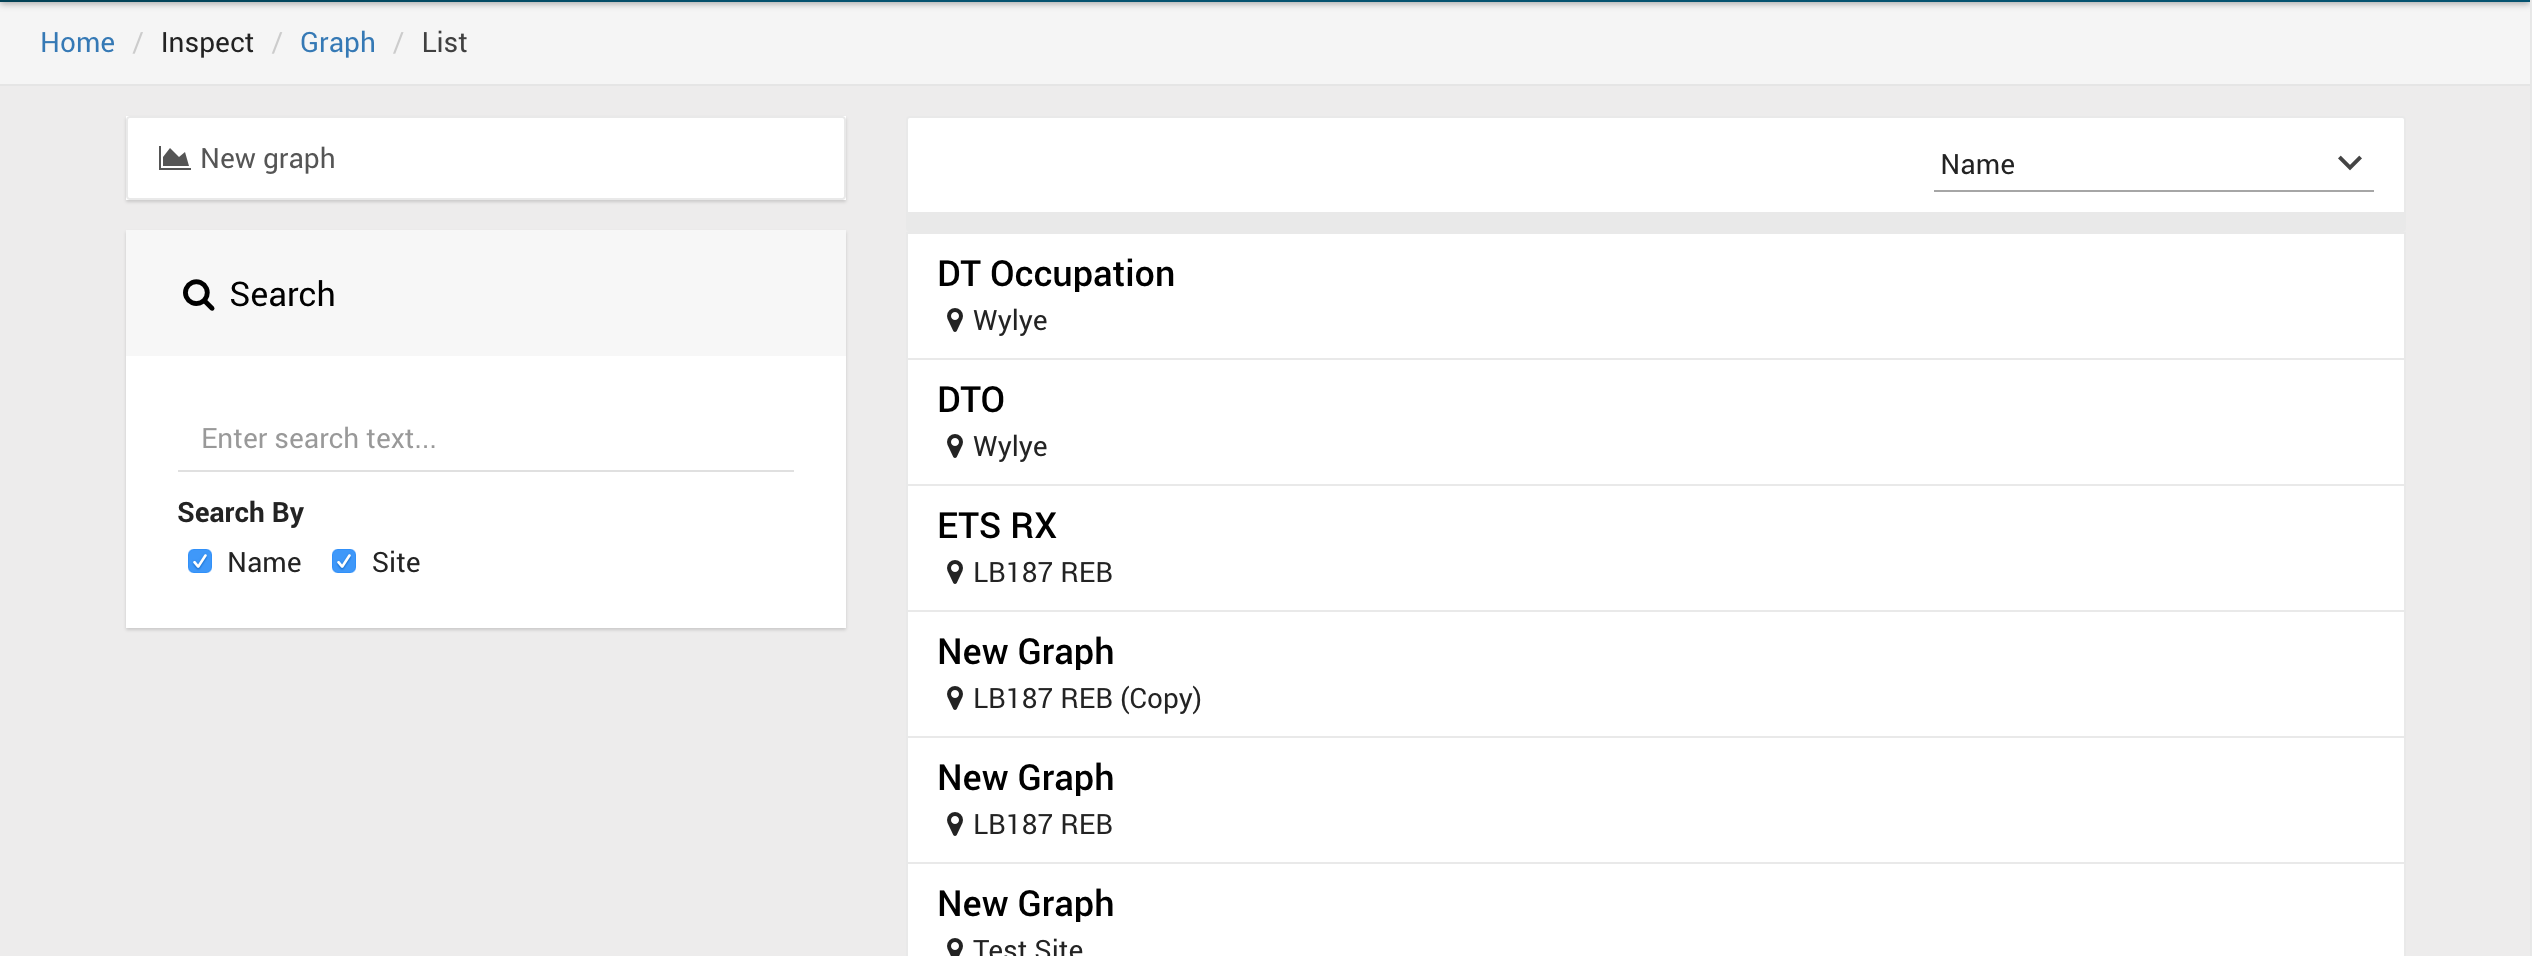
You can find a graph by name, or by site name.
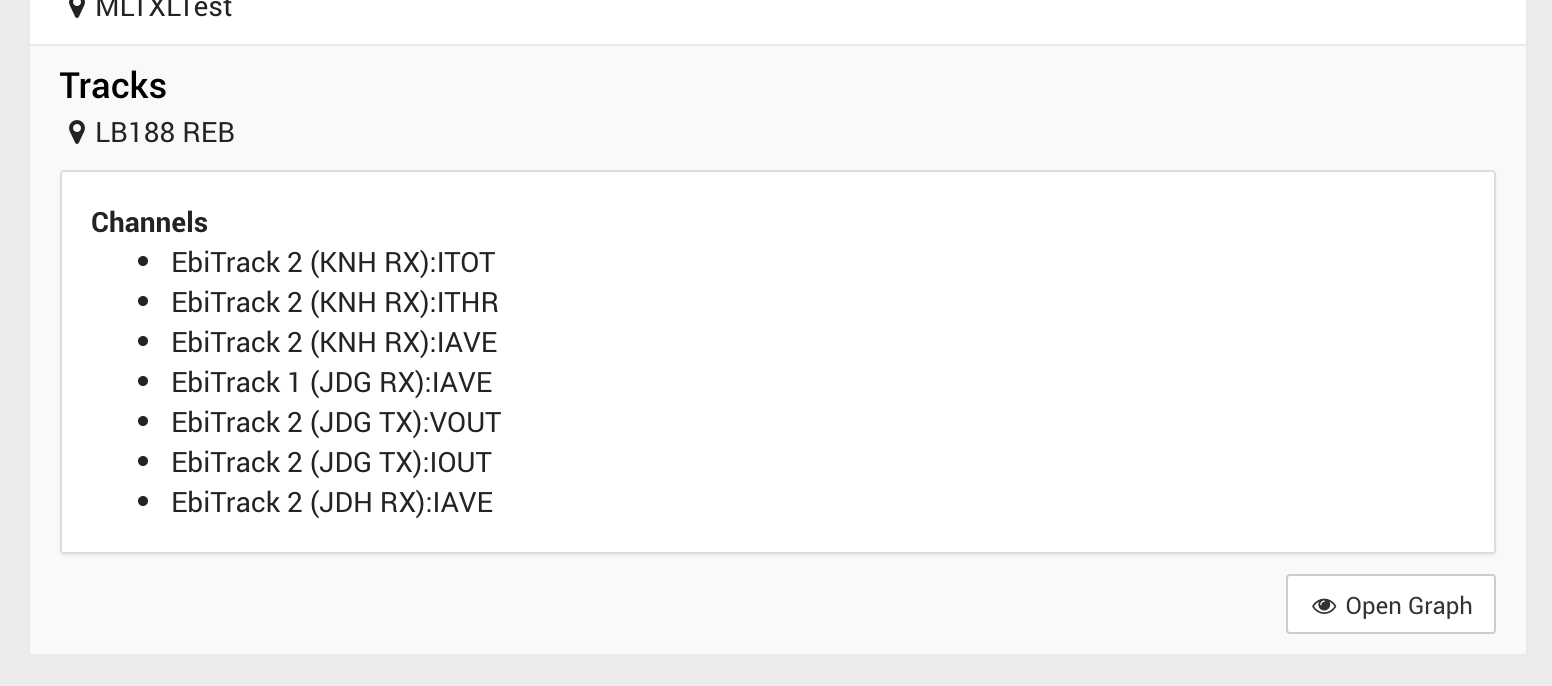
To open the graph, select the graph and press Open Graph.
Known limitations
This feature is currently marked as experimental. We are already aware of the following limitations, which we hope to resolve in a forthcoming release;
- The colour of channels on the graph are not configurable.
- The position of the axis (left/right) for a channel is not configurable.
- Zooming in/out on the graph does not perform any data reloading, so the scaling is fixed to the selected time period.
- Dates/times are currently displayed in your local time zone, not the time zone local to the respective site.
- When adding an 'Asset' to the graph, all associated channels are automatically added to the graph, offering no option for pre-selection.