Centrix R85 Release Notes
- Former user (Deleted)
- Robert Hunt (Unlicensed)
Improved Health Dashboard
Overview
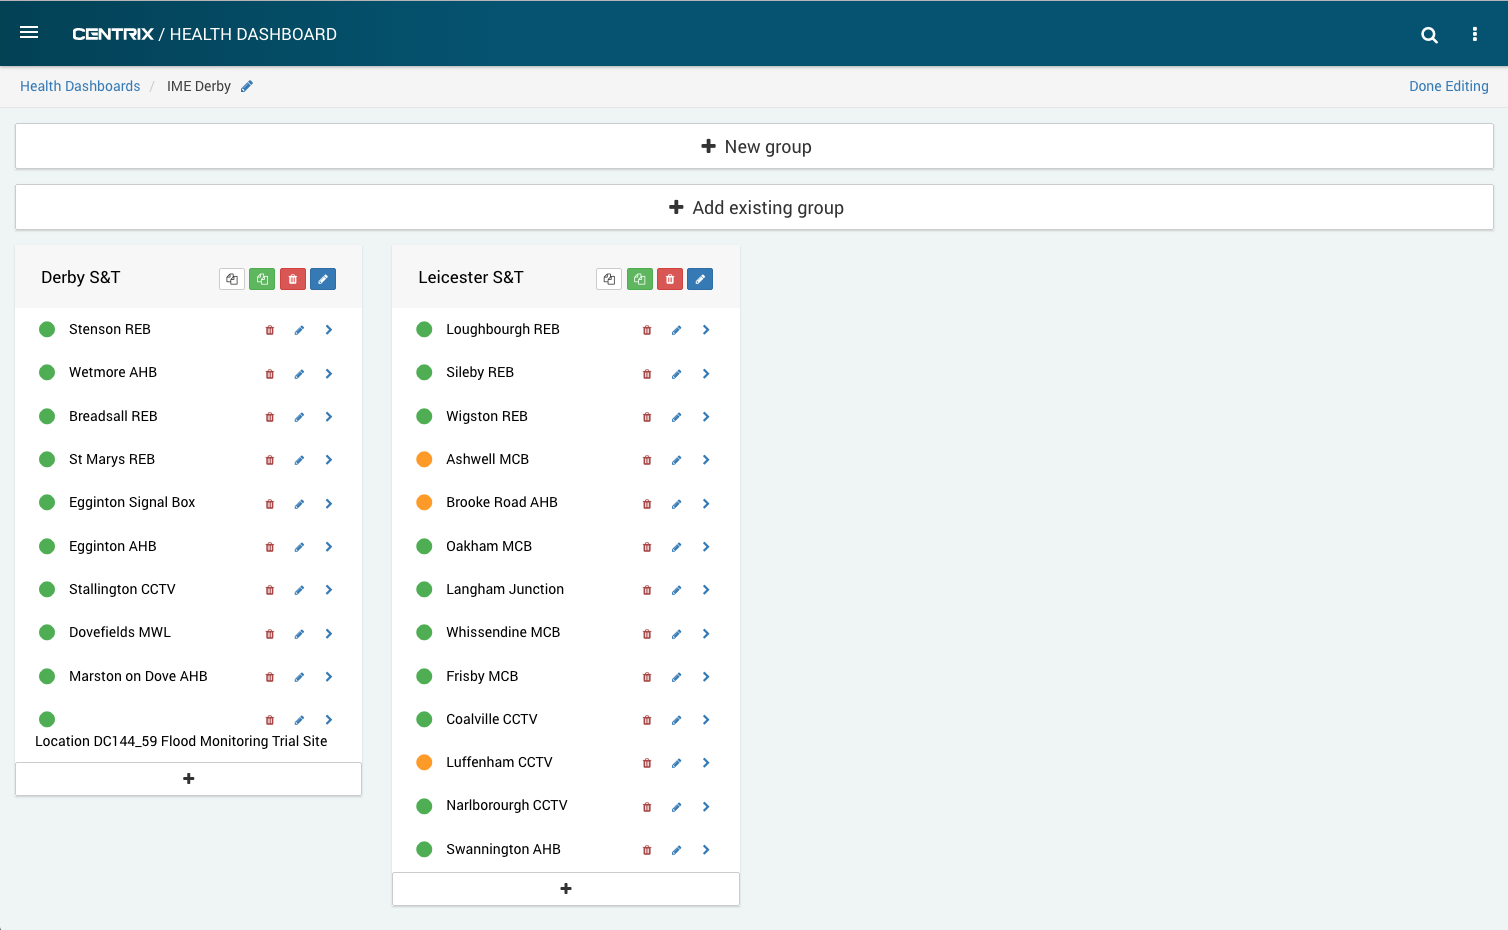
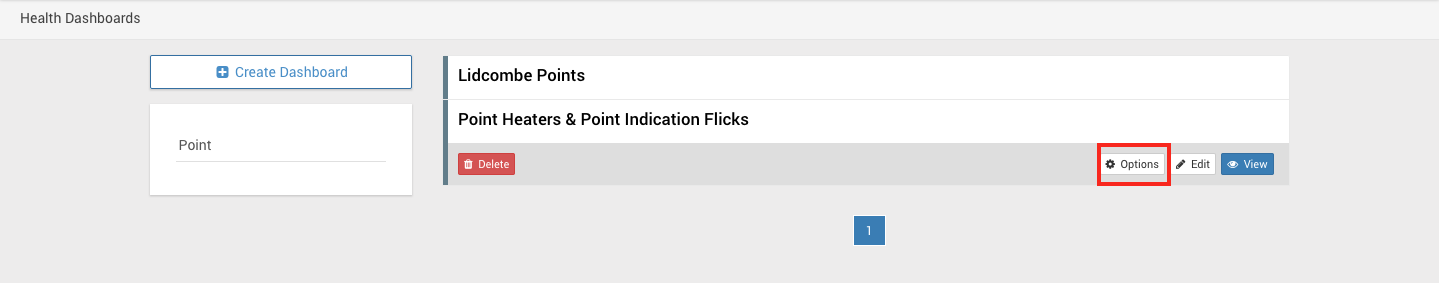
The old version of the dashboard edit page looked like this:
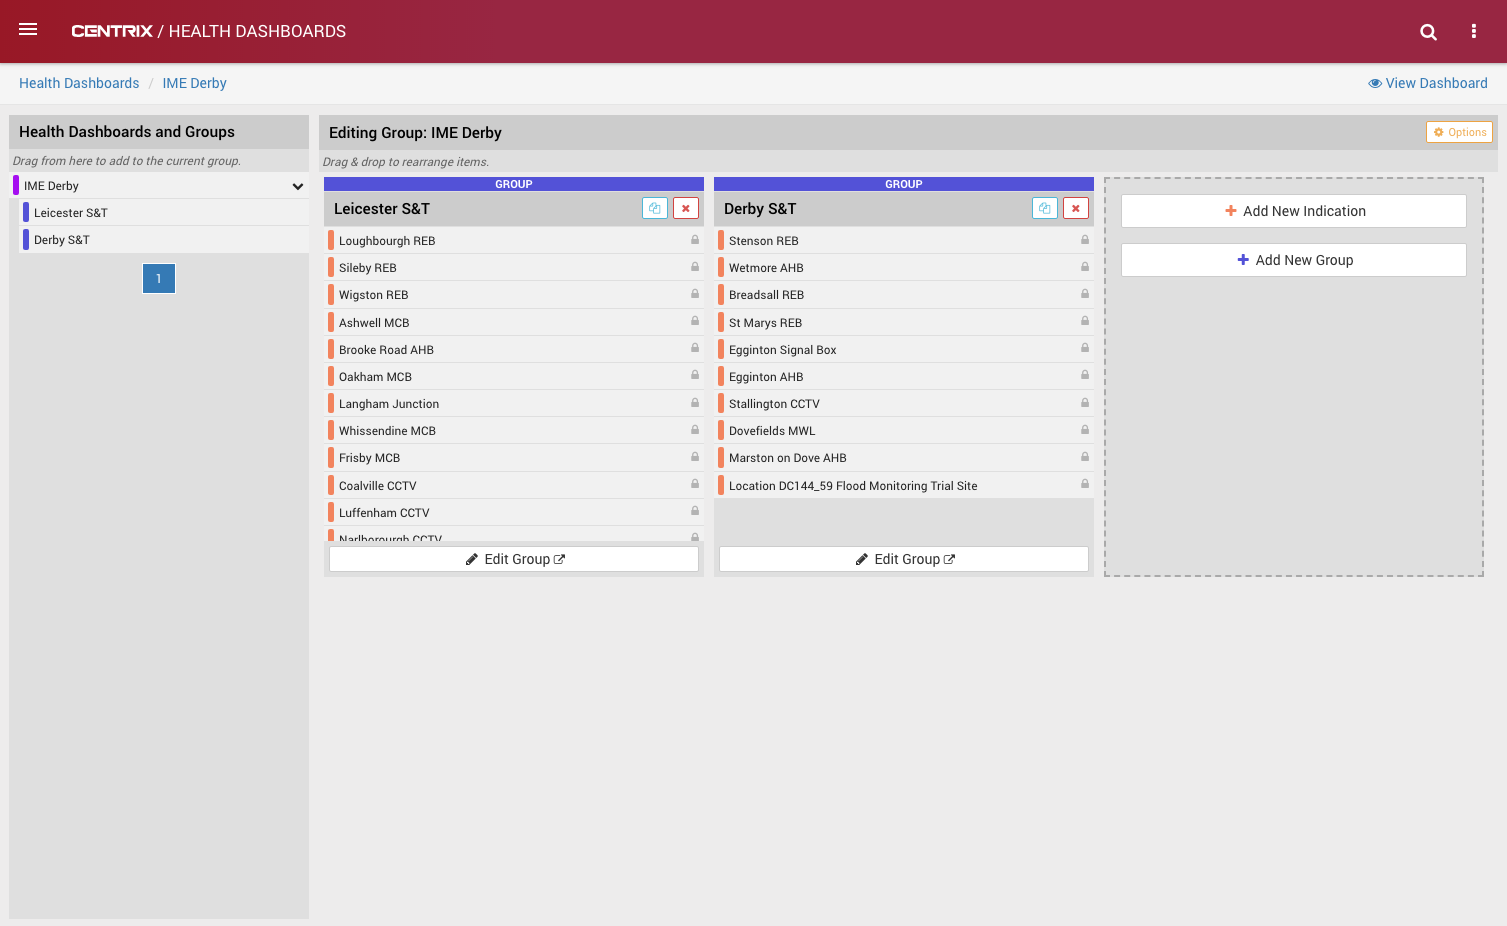
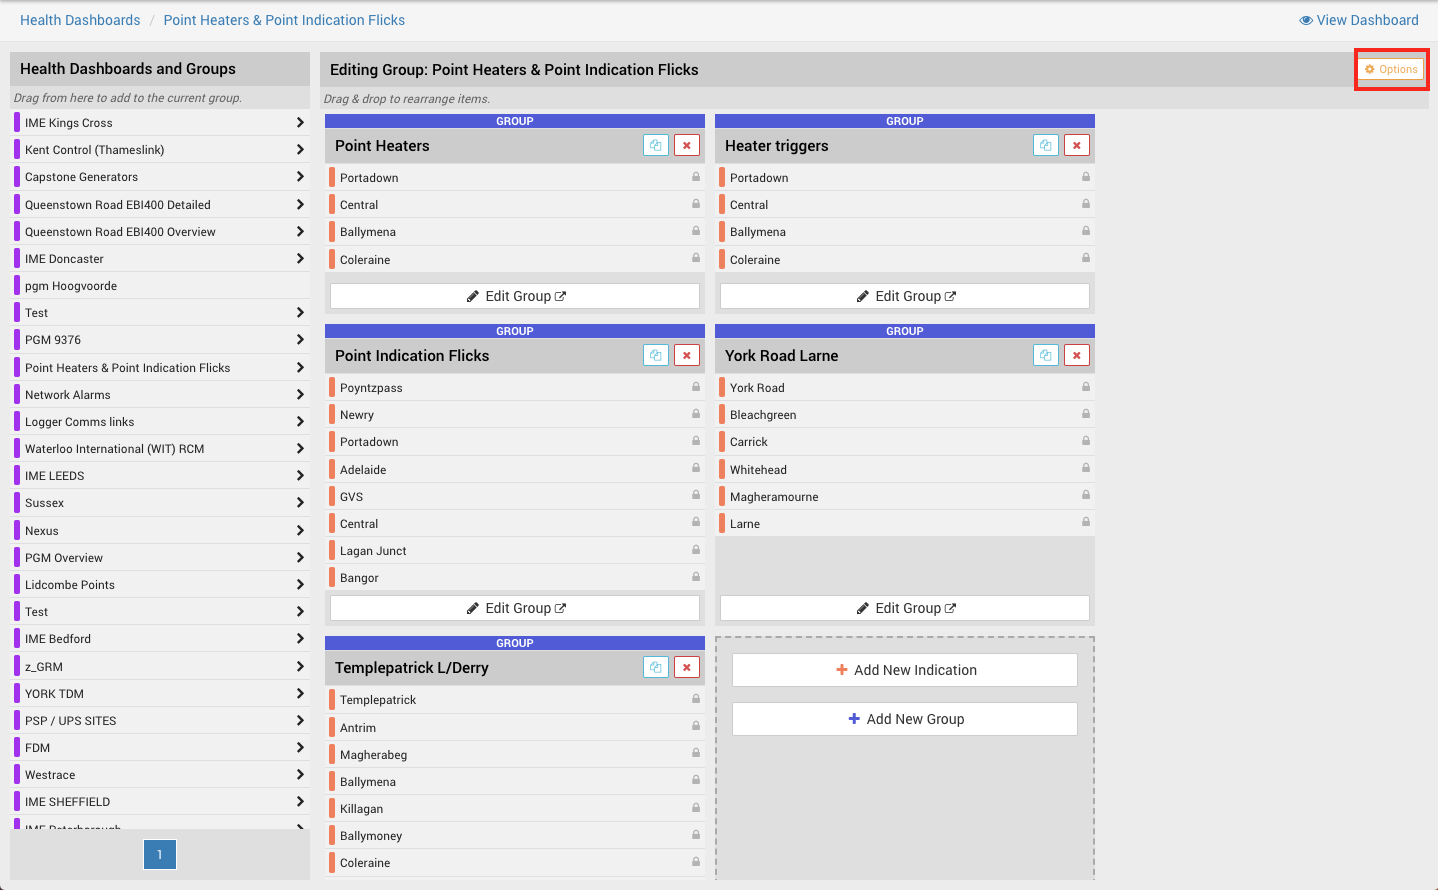
The new version of the dashboard edit page looks like this:
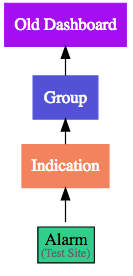
In the old version of the dashboard there was a rigid structure of groups, indications and alarms. A dashboard could contain multiple groups, each group could contain multiple indications and each indication could contain multiple alarms.
At any level in the dashboard you could see whether any alarms from the lower levels were active.
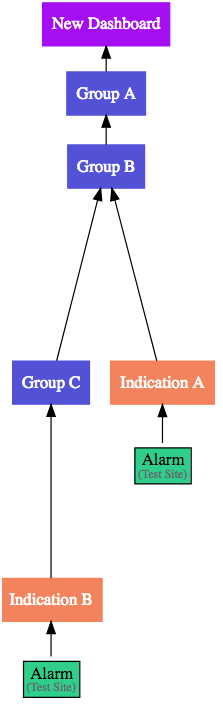
In the new version, the dashboard has been made more flexible so that you can now have any number of groups composed into any number of levels.
This means that rather than always having 3 levels of groupings, you can group alarms into as many subgroups as you want.
Editing the layout of a dashboard also has a new look and feel.
You can also have a look in the user guide and see Health Dashboards
New Edit Page
As illustrated in the overview, the main changes to the health dashboards revolve around the editing process.
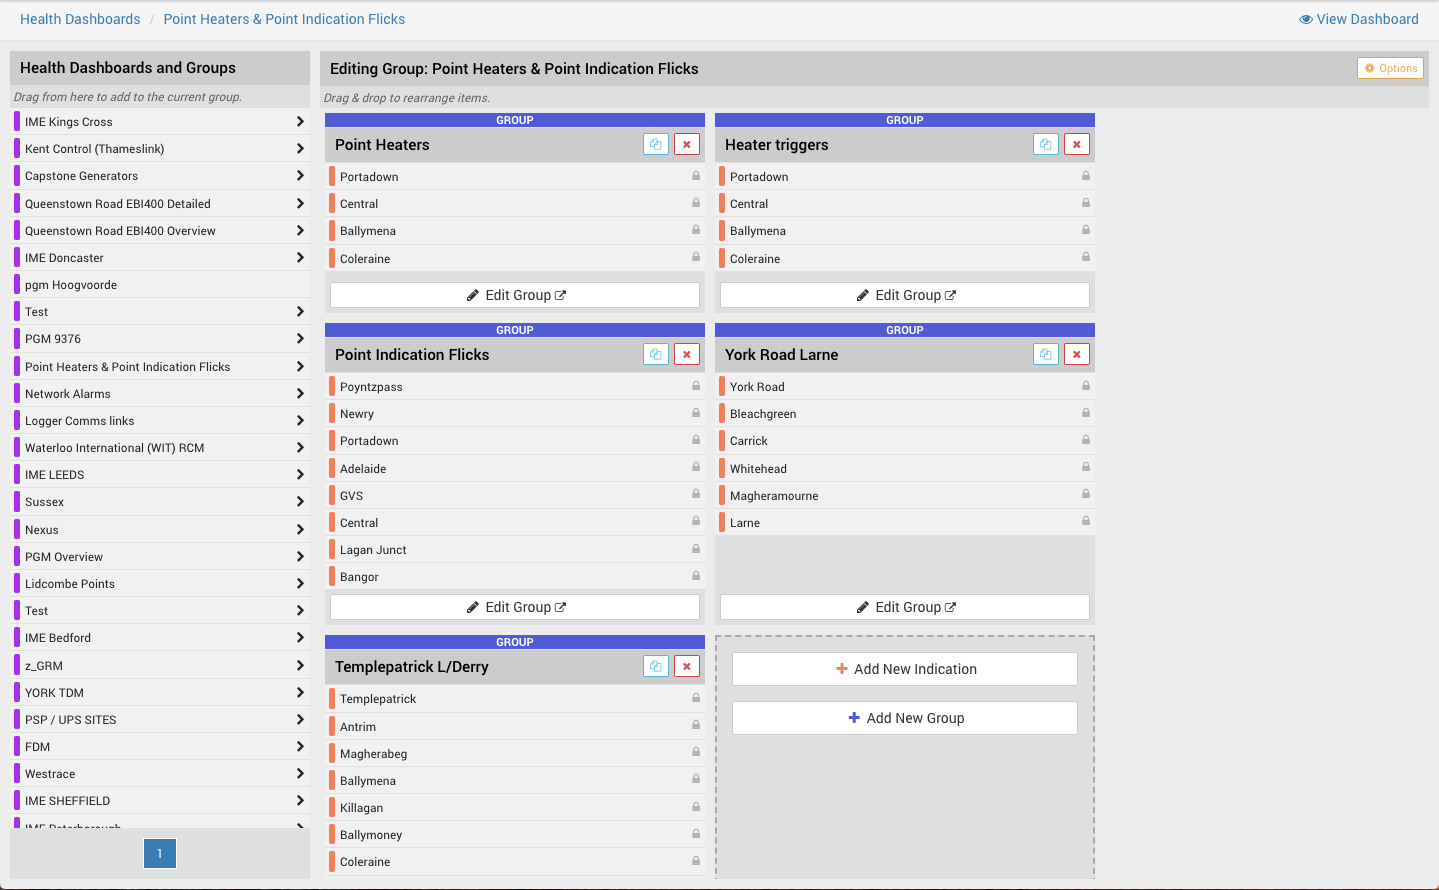
From the edit page, the following actions can be performed:
- Rearranging the current layout. See here.
- Adding a new Indication. See here.
- Adding a new Group. See here.
- Moving an alarm from one indication to another. See here.
- Removing an Indication. See here.
- Removing a Group. See here.
- Editing a Group. See here.
- Editing an Indication. See here.
- Adding an existing group to the dashboard. See here.
- Duplicating a Group. See here.
- Edit the dashboard options (title, groups etc.). See here.
Rearranging the Layout
Simply drag and drop a group or indication to rearrange the order of the elements.

Adding a new Indication
At the bottom of the screen, below all the existing groups and indications in the current group, there are options to add a new indication or a new group.
Click on the "Add New Indication" button to add a new indication, give it a name, and press the enter key or save button.
To add alarms to an Indication. See here.
Adding a new Group
At the bottom of the screen, below all the existing groups and indications in the current group, there are options to add a new indication or a new group.
Click on the "Add new Group" button to add a new group, give it a name, and press the enter key or save button.
Moving an Alarm
Edit a group to view all the indications it contains.
Simply drag and drop alarms to move them from one indication to another.
Removing an Indication
Click the bin icon in the top right corner of the indication you want to delete.
This will fully remove the indication. This action cannot be reversed.
Removing a Group
Click the bin icon in the top right corner of the group you want to delete.
Groups can be shared by multiple groups and/or dashboards. If this group exists elsewhere, it will still exist there afterwards and can easily be re-added to the group it was removed from if needed.
If this is the only location that the group exists and the group is deleted, it will fully remove the group. This action cannot be reversed.
Editing a Group
Click the 'Edit Group' button at the bottom of the group you want to edit.
Groups are simply collections of indications and other groups. Add some new indications, new groups or existing groups to the group. Existing groups can be selected from the tree on the left sidebar by expanding existing dashboards, including the one you're currently editing.
Use the breadcrumbs in the navigation bar to go back to the page you started on.
Editing an Indication
Click the 'Edit Alarms'' button on the bottom of the indication you want to edit.
Use the next page to add multiple alarms to the indication. The box at the top can be used to filter the list of alarms being selected from.The Self Clear and Critical buttons will be applied to all alarms selected.
Click the Add button when you are done. This will take you back to the page you started on.
You can toggle the self clear and critical flags for each alarm individually from this view.
Copying a group to another Dashboard
The sidebar on the left shows all other dashboards that you have access to, based on your user groups.
You can drill down into the groups contained in any of those dashboards and then drag and drop any group into the current group.
Groups can exist in multiple other groups or dashboards. However, a parent-child loop is not allowed. For example, Group A cannot contain Group B which contains Group A.
When a group is edited, this update will be seen everywhere it exists.
Duplicate a Group
Often, groups may want to follow a certain pattern or template. For example, you may have a group for a geographic region which has child groups for different asset types such as tracks, points and signals that you want to use a "template" for other geographic regions but not have to create the structure multiple times. In this case, a group can be duplicated. This is done by pressing the blue duplicate button in the top right corner of the group.
This copies the names of everything within it - like a template. It does not copy the content.
If you want another group to reference an existing group, see here.
Editing Dashboard Options
The dashboard title, colours and users who can view the dashboard can be edited by clicking the 'options' button.
This can be found on the main dashboard list view or within the individual dashboard edit view.
Clicking either of these buttons will take you to this page:
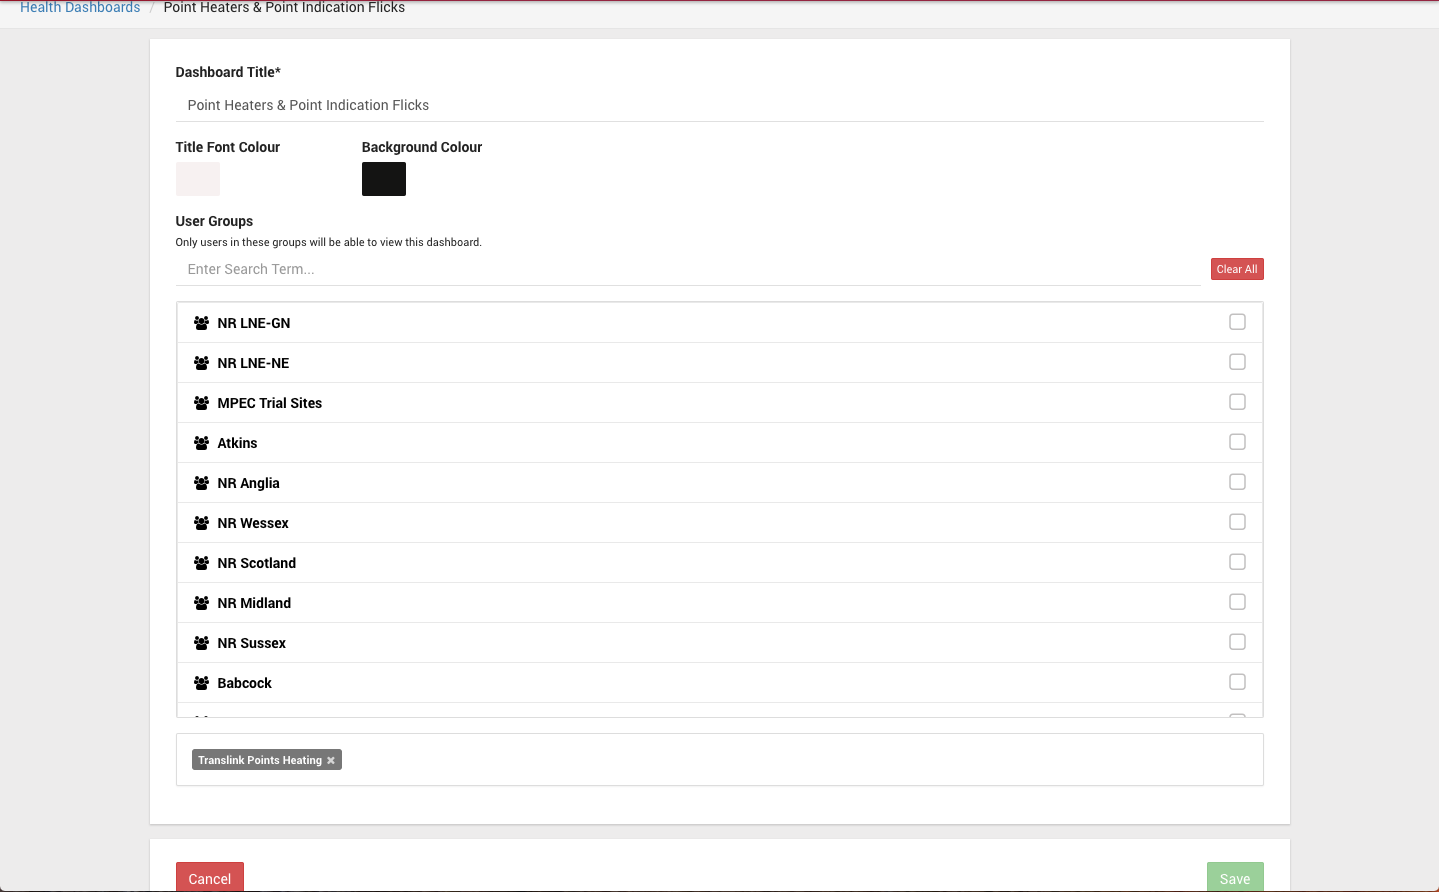
Edit the Dashboard title.
Edit the Title and Background colour to be used when using the full screen functionality.
Select User Groups who will be allowed to view this dashboard.
Remove User Groups by clicking the cross button by their name.
Save the dashboard.
Minor amendments and fixed issues
- Channel list on MIMOSA loggers page would sometimes disappear when changing between tabs
- Channel list on RDAQ loggers now refreshes when a new configuration is received.
- Capture traces are now added to the URL when added to the capture graph to allow the link to be shared easier.
- Trigger lines were still shown when the associated capture was hidden on capture graph.
- Capture traces without triggers were being offset incorrectly when mixed on a graph with capture traces with triggers.
- Loggers with 100% uptime were been shows in scientific notation as 1.0e+2%
- Reduce volume of data loaded during application startup for analogue channels (performance improvement).
- Additional logging to help detect common client side errors encountered by users.
- The "peak value" for capture traces were being rounded to whole numbers when displayed on certain graphs.
- Slight performance increase when loading the "alarm status" page.
- Password reset functionality was broken during account setup / recovery.
- Logger contact alarm for TDM type loggers was not correctly tracking last contact time.