Centrix R71 Release Notes
- Jamie (Deactivated)
- Robert Hunt (Unlicensed)
- Tom Forster
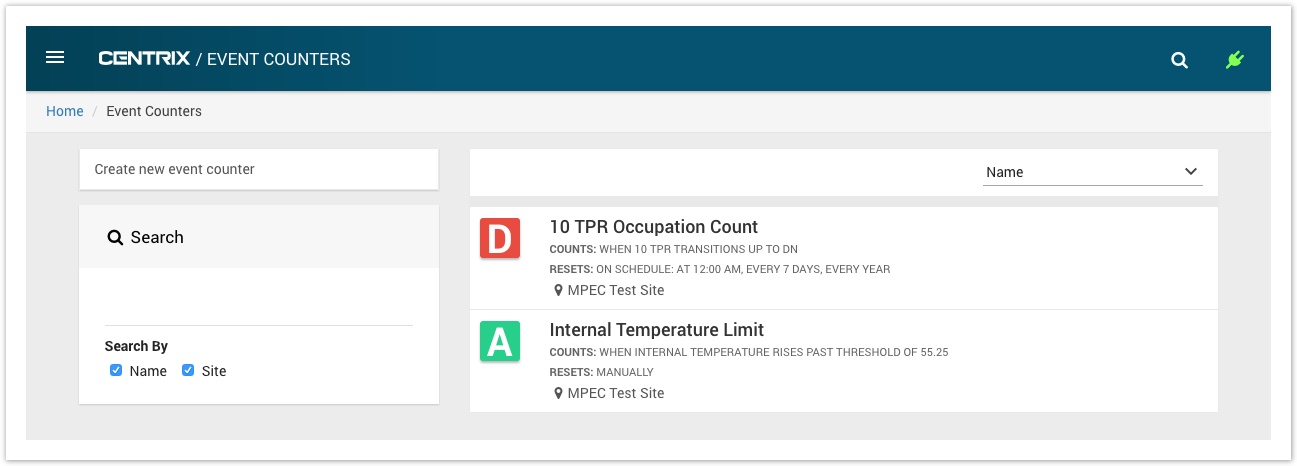
Event counters
Event counters are a new feature that allow events on analogue and digital channels to be counted based on configured conditions. These can be used for a wide range of use cases such as counting track occupations, barrier raises, points operations etc.
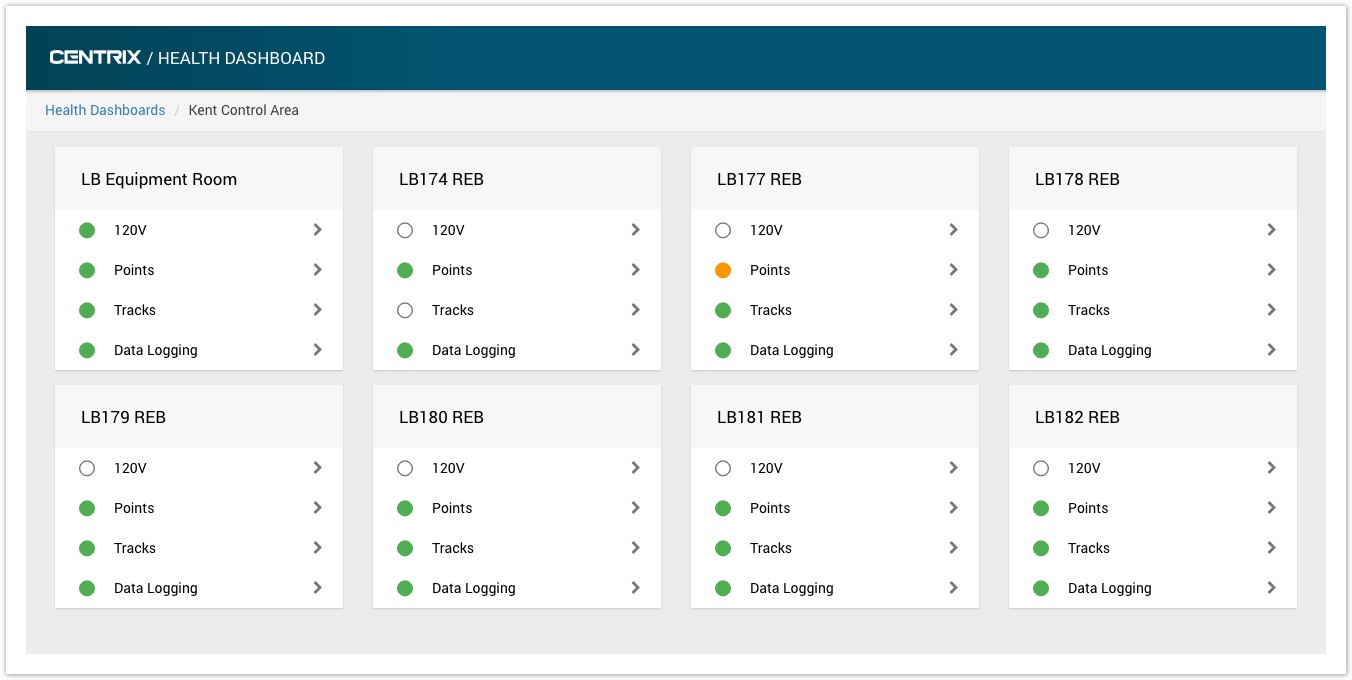
Health dashboards
This Centrix release introduces the Health Dashboards feature. This is currently undergoing BETA testing with select customers, however we are introducing the concept in this release to gather feedback.
Health Dashboards provides an aggregated view across as many sites/assets as desired, grouped into collections of red-amber-green ("RAG") indicators. The dashboards are flexible as to how you group the indications, and the number of conditions that are attached to a single RAG indication.
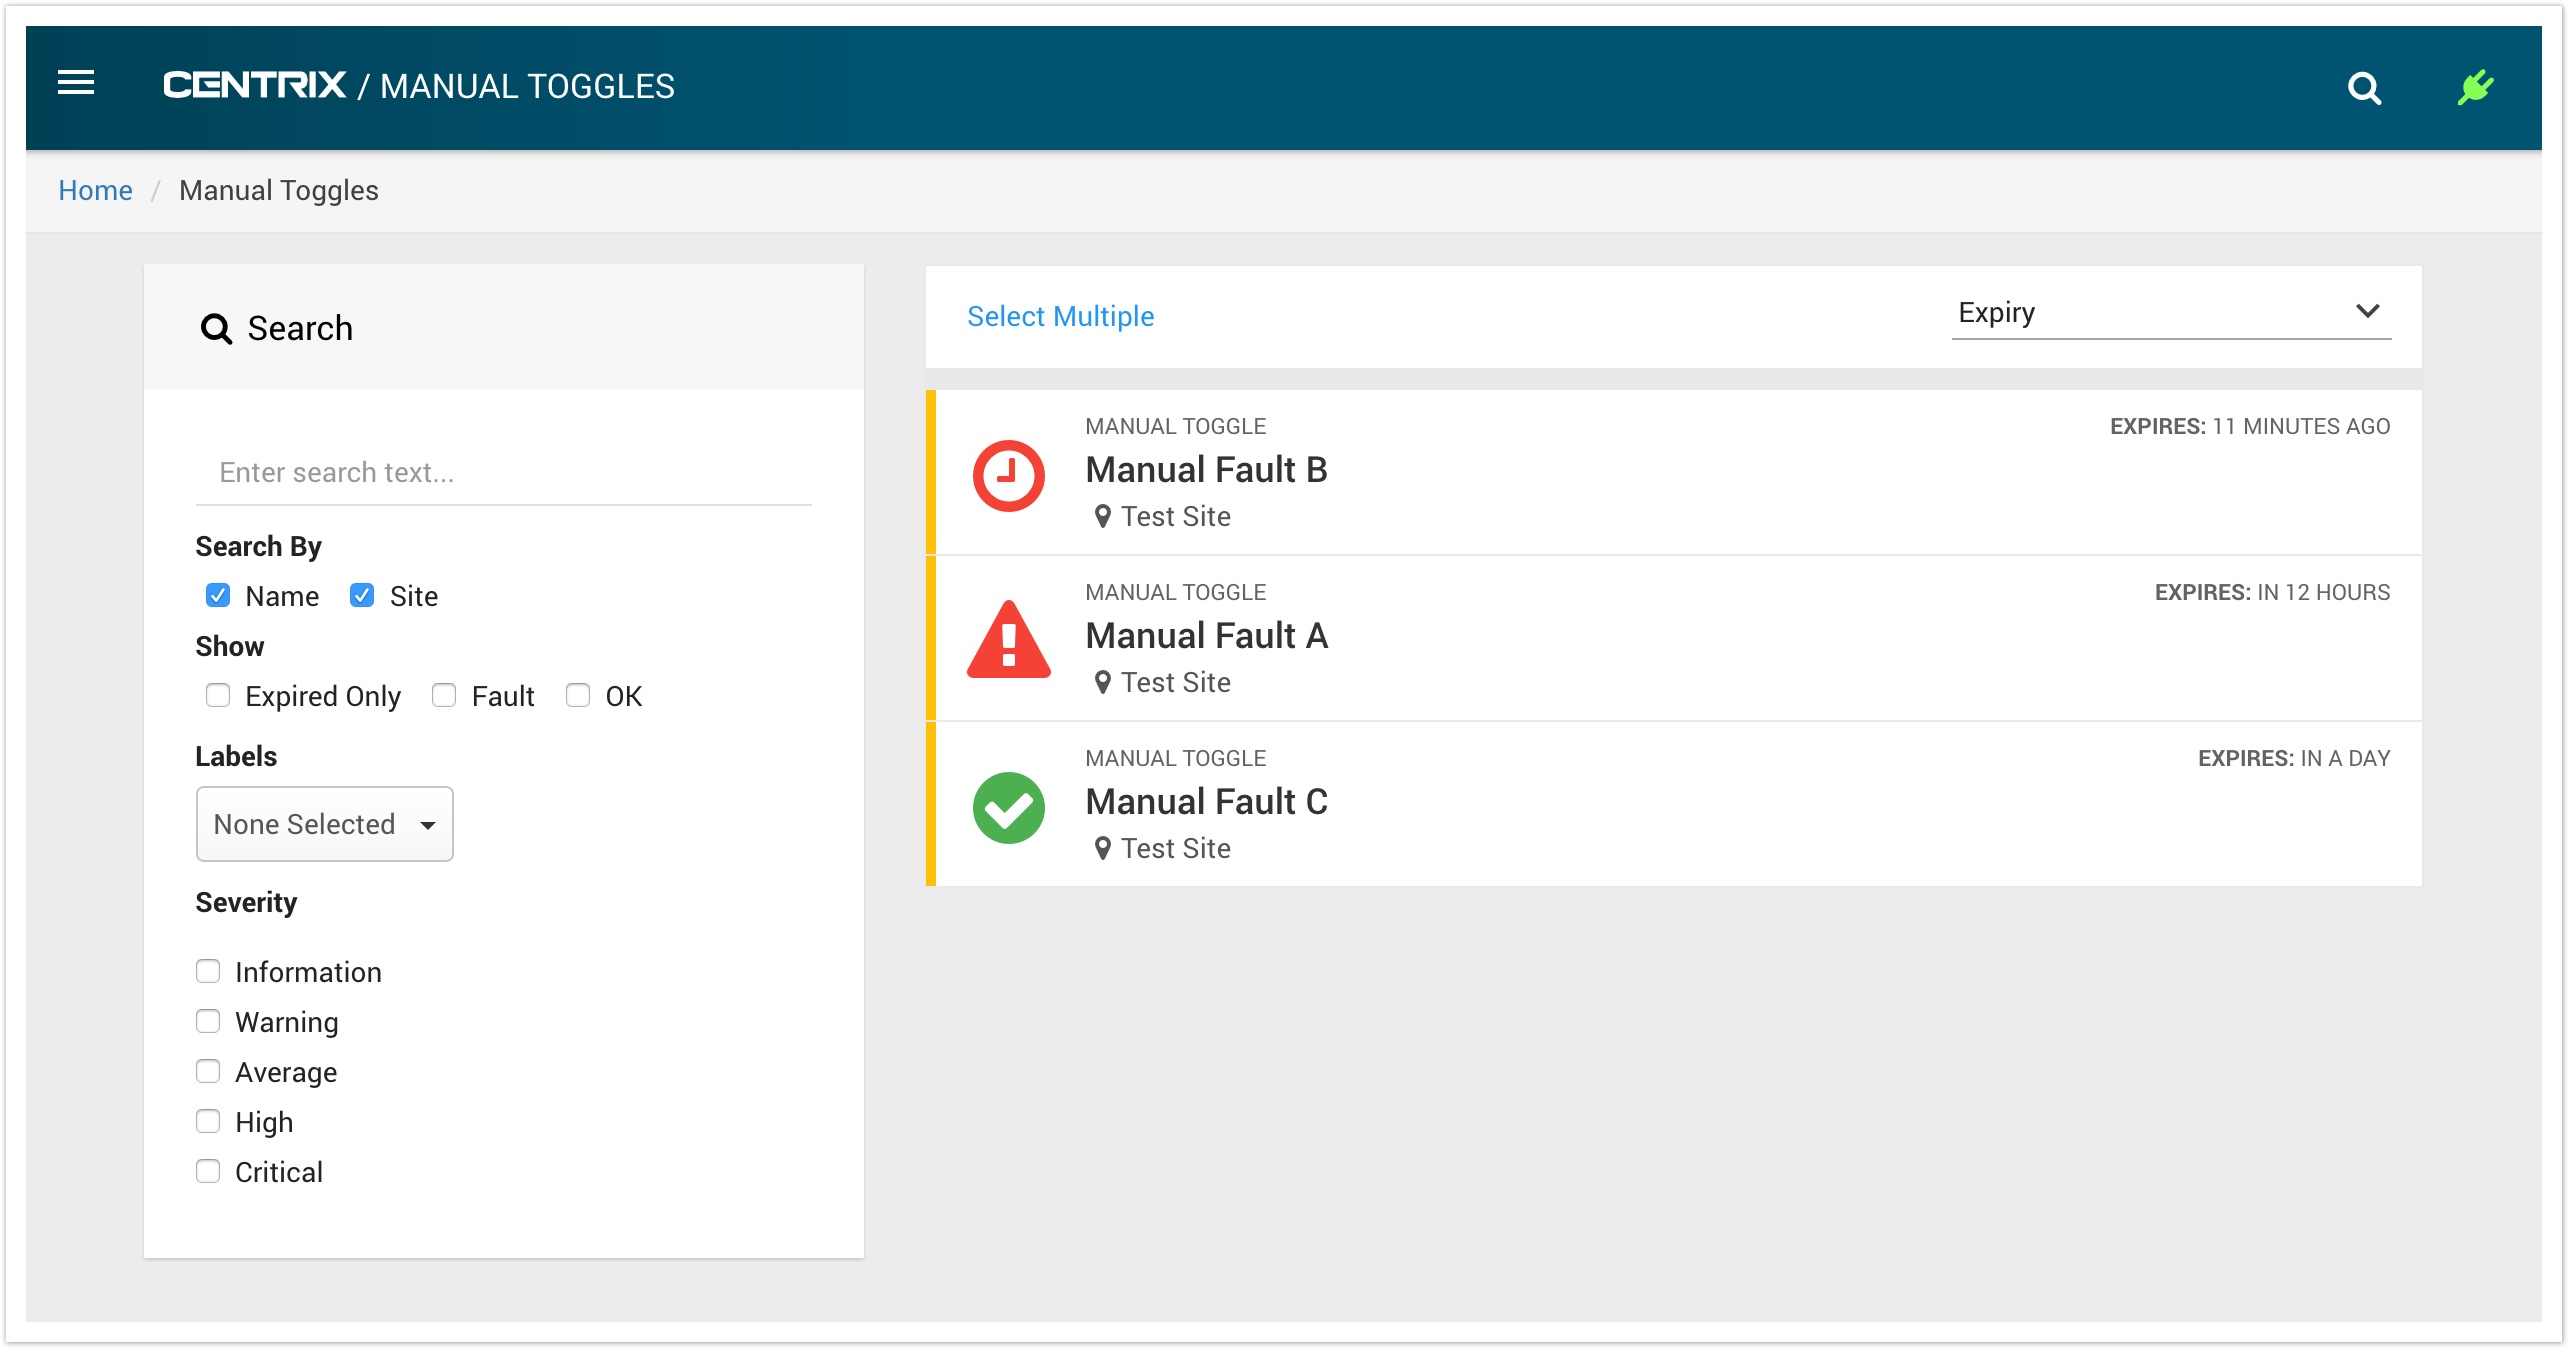
Manual toggle alarms
This release of Centrix introduces the Manual Toggle feature.
Manual Toggle is a type of Centrix alarm used to report status of assets that are not monitored by RCM. They are not attached to any logic within Centrix, but can have their state changed manually between FAULT and OK according to external checks.
Reporting enhancements
- Report results pages now use a persistent link, which can be used to to provide easy report bookmarking and sharing.
- Improved the user interface to more closely match the HTML5 pages.
- Sequence Timing Report now matches styling of the rest of Centrix.
|
|
%20(17).png?version=1&modificationDate=1501061567000&cacheVersion=1&api=v2&effects=border-simple%2Cblur-border&width=370&height=341)
%20(21).png?version=1&modificationDate=1501061947000&cacheVersion=1&api=v2&effects=border-simple%2Cblur-border&width=340&height=371)
See the Reporting section of the Centrix User guide for details on how to use Centrix reporting.
Other minor changes
Alarm status
Alarms can now be filtered by Alarm Type.
Logger management
Columns sorting and filters are now remembered when navigating back to the list after viewing a site or logger.
Bug fixes
- Raw digital events report shows Up/Dn state as True/False when exported to CSV.
- Adding dialled loggers doesn't set the "next poll" time correctly.
- Timezone issue on state transition counts report.
- Browse map button didn't work on MIMOSA logger or RDAQ logger views after assigning the logger to site.
- Loggers grid and other grids scrolls erratically.
- Message times are truncated in logger messages grid.
- Sorting loggers by software version doesn't work.
- Filtering loggers by device id doesn't show partial matches.
- Ascending sort on channel number doesn't work when viewing channels for an RDAQ logger.
- MIMOSA message type not shown in logger comms messages.
- Channel inputs used on the graphs, virtual channels and map designer require two clicks to focus input.