Centrix R54 Release Notes
- Jamie (Deactivated)
- Former user (Deleted)
Graph axis improvements in playback
Following on from recent amendments made to axis grouping, further improvements have been made to the presentation of the graph axes in the Graphs playback widget.
These improvements are designed to maximise the viewing area of the graph data by reducing wasted space in the axes;
- Units are now vertically aligned as axes titles rather than being appended to the values
- Major tick lines are now shorter, but darker in colour
- Padding between the axes has been reduced
- Padding between the tick lines and their corresponding values have been reduced
- The coloured axis bar widths have been reduced by 1 pixel
- The internal minor and major tick gaps have been removed from the coloured axis bar to improve visibility of the axis colour
| Before | After |
|---|---|
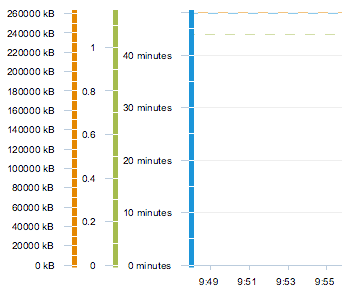 | 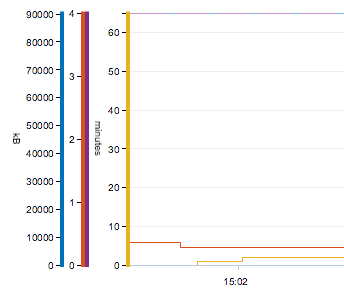 |
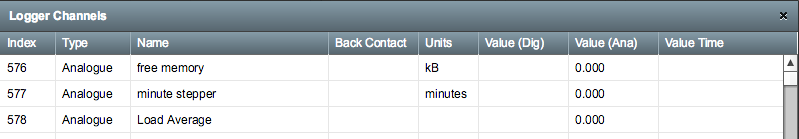
Automatic configuration of units on RDAQ loggers
Loggers using the RDAQ communication protocol will now send the units that have been configured within the logger for analogue channels. Previously this had to be done manually using the Channels screen in Centrix.
You can inspect the units on the channels through the View Channels action on an RDAQ logger.
Loggers using the MIMOSA communication protocol won't have units configured automatically as it does not form part of the Network Rail II (MIMOSA) specification.
Points swing count report improvements
User documentation has now been created for this report. Click here to view.
- Assets are now sorted alphabetically so the report is more consistent for a site and A/B ends are placed together.
- Assets with zero counts are now included in the report.
- Valid swing counts are now shown as a regular stacked bar chart.
- Added a legend to each chart which also provides the ability to toggle each direction count (N-R, R-N etc) on/off for each chart.
- Changed colours of invalid swing counts to differentiate them from the valid counts.
- Invalid swing counts now only include swings where the corresponding track circuit is occupied (this mode can be toggled on/off via checkbox).
- Fixed issue with category labels disappearing when there are too many categories on the chart.
- Scrolling and zooming is now synchronised between the valid and invalid charts.
- Added data drill down to show events used to make calculations in the report.
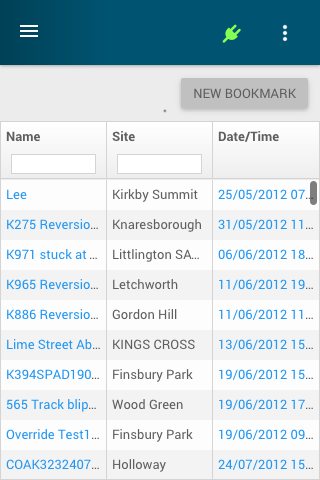
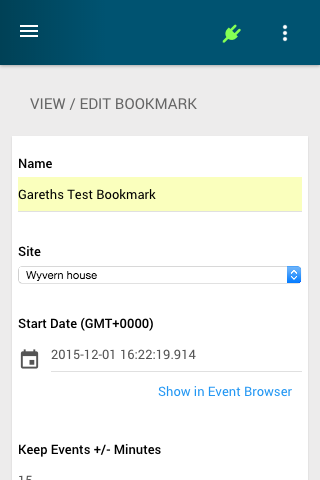
Bookmarks on Mobile Browsers
Bookmarks can now be viewed and created using the mobile-friendly HTML5 side of Centrix.