Centrix R77 Release Notes
- Former user (Deleted)
- Jamie (Deactivated)
- Robert Hunt (Unlicensed)
- Tom Forster
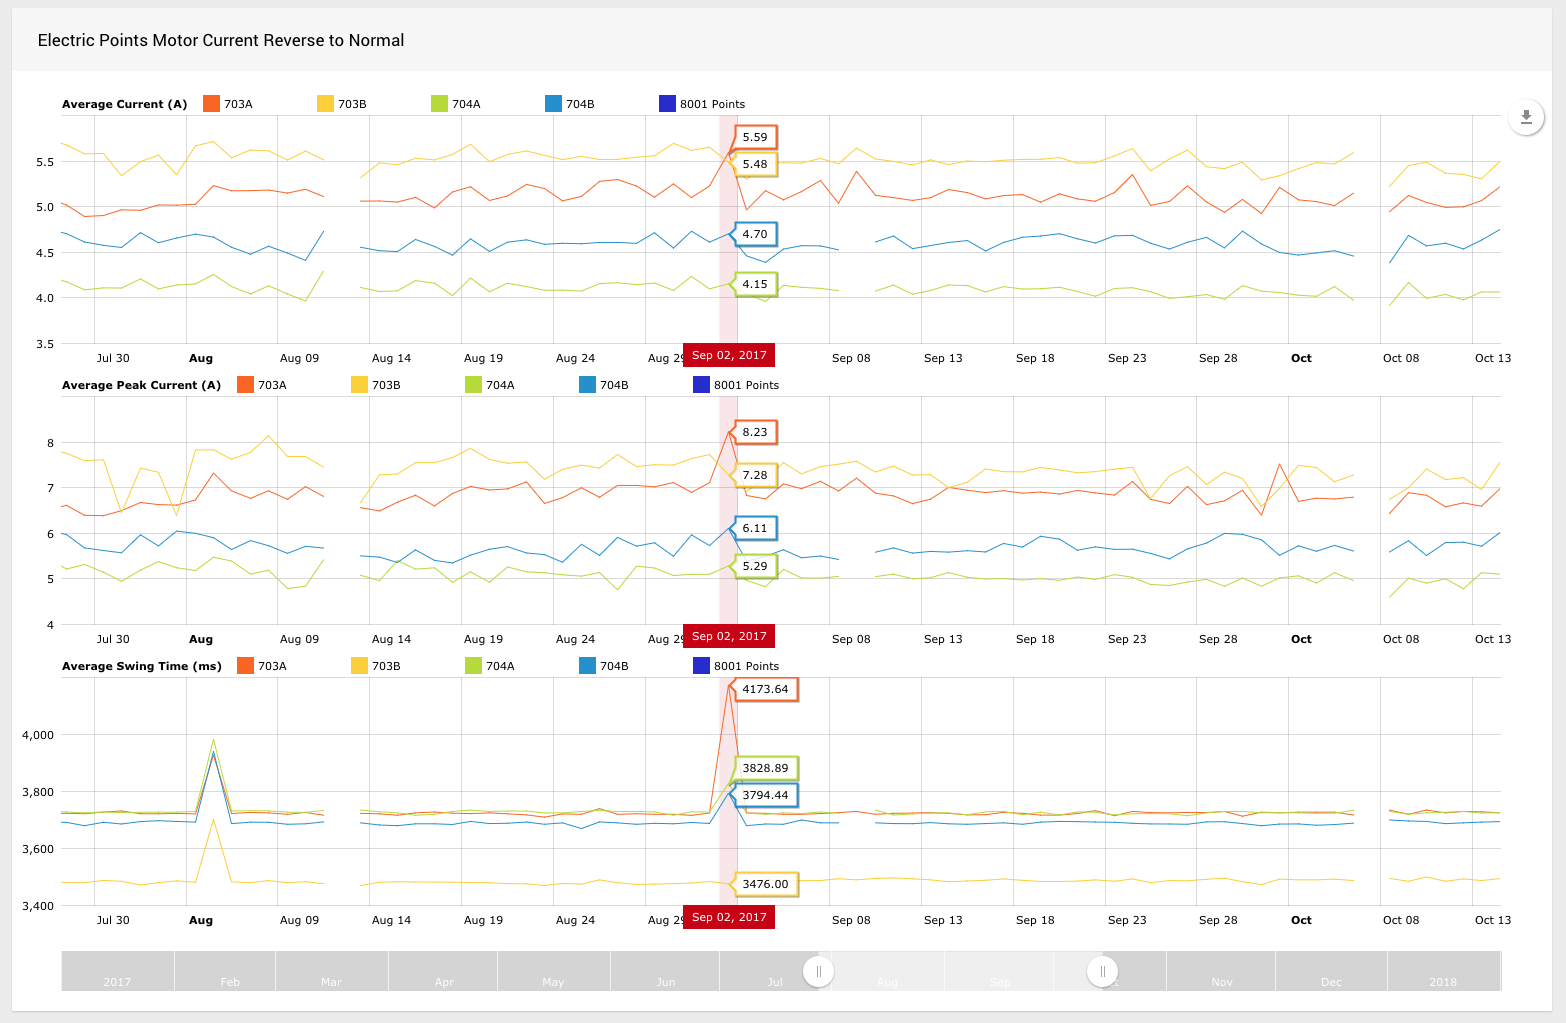
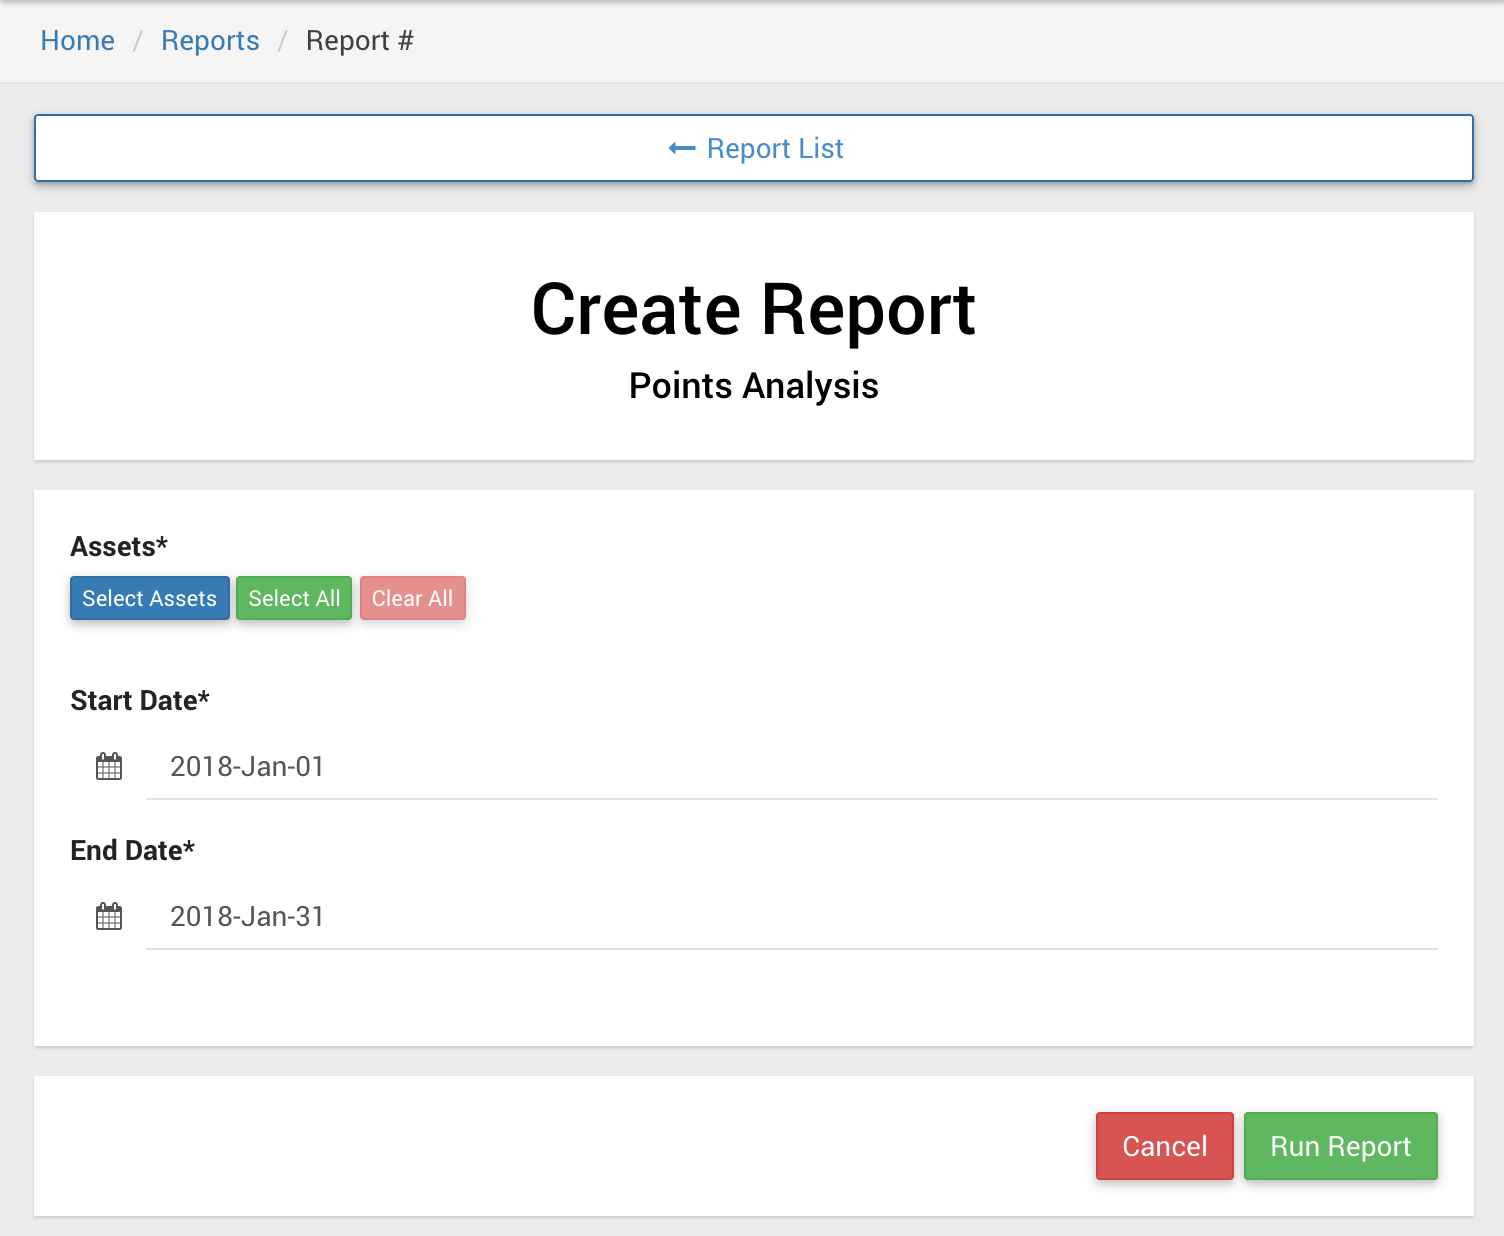
Points analysis report
The points analysis report can be used to compare how trace values on different points change over time. By selecting similar points for comparison, any points behaving erroneously should stand out.
Hydraulic points display graphs for hydraulic pressure and electric motor current, while electric points only display graphs for electric motor current.
For hydraulic pressure, data on swing time, average pressure (excluding clamp lock movement) and peak pressure (excluding clamp lock movement) is shown.
For electric current, data on swing time, average current (excluding the inrush current) and peak current (excluding the inrush current) is shown.
Every point on a graph is a daily averaged value.
Further reading
For more detailed information see the user guide.
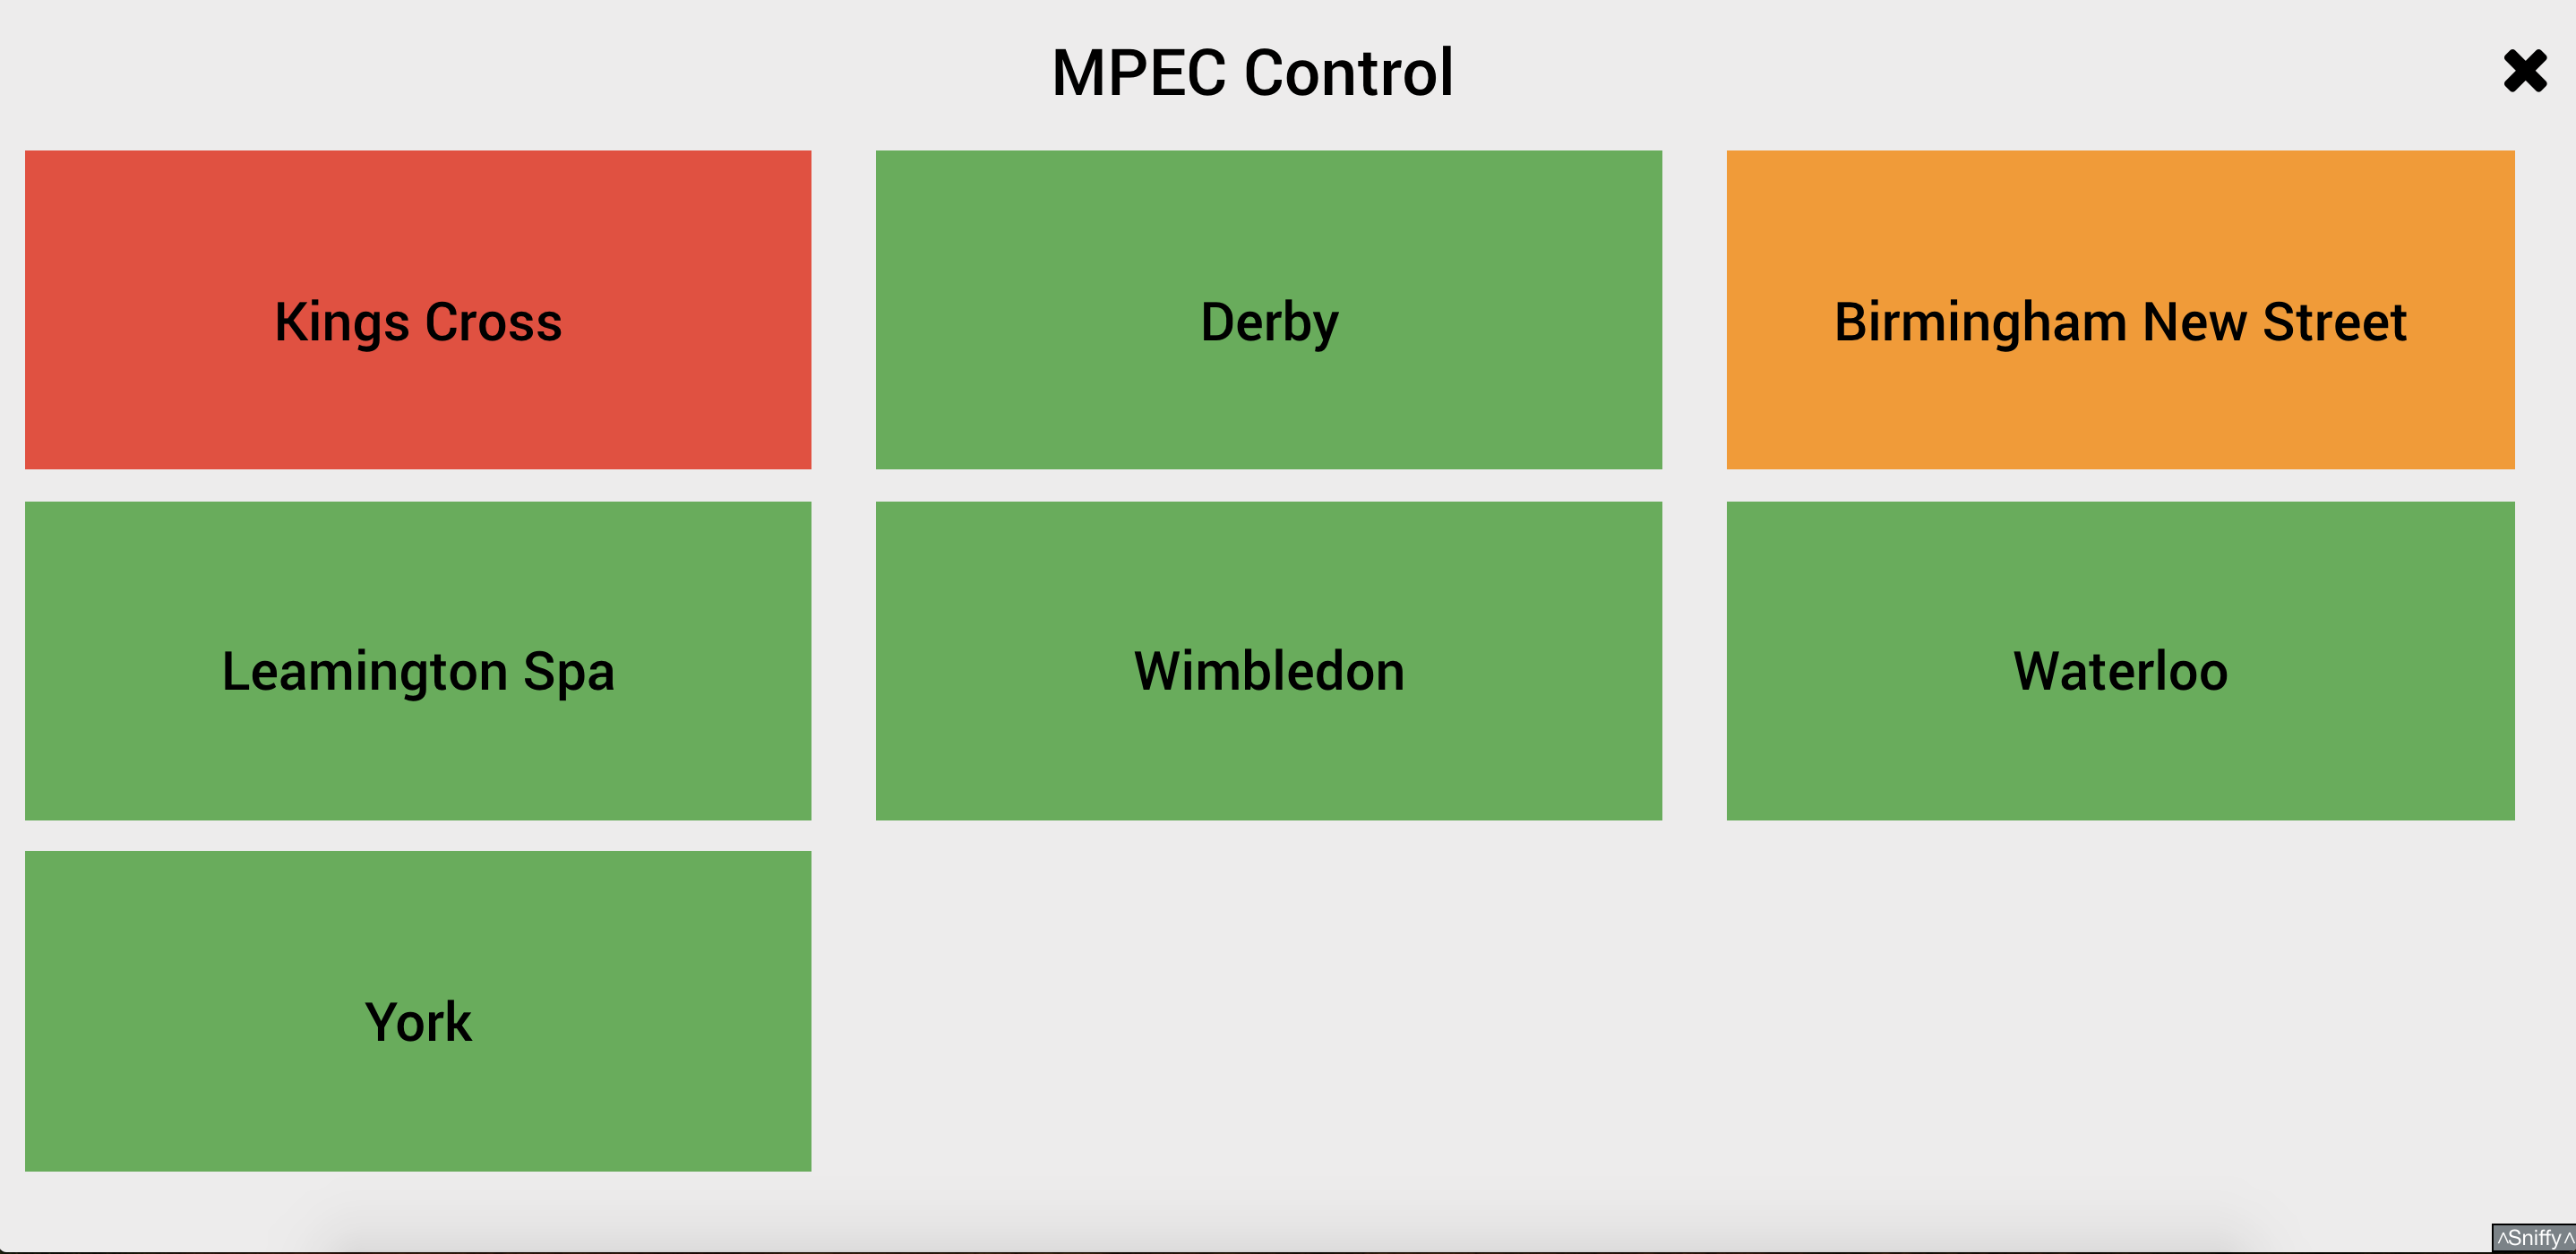
Health dashboard enhancements
New look
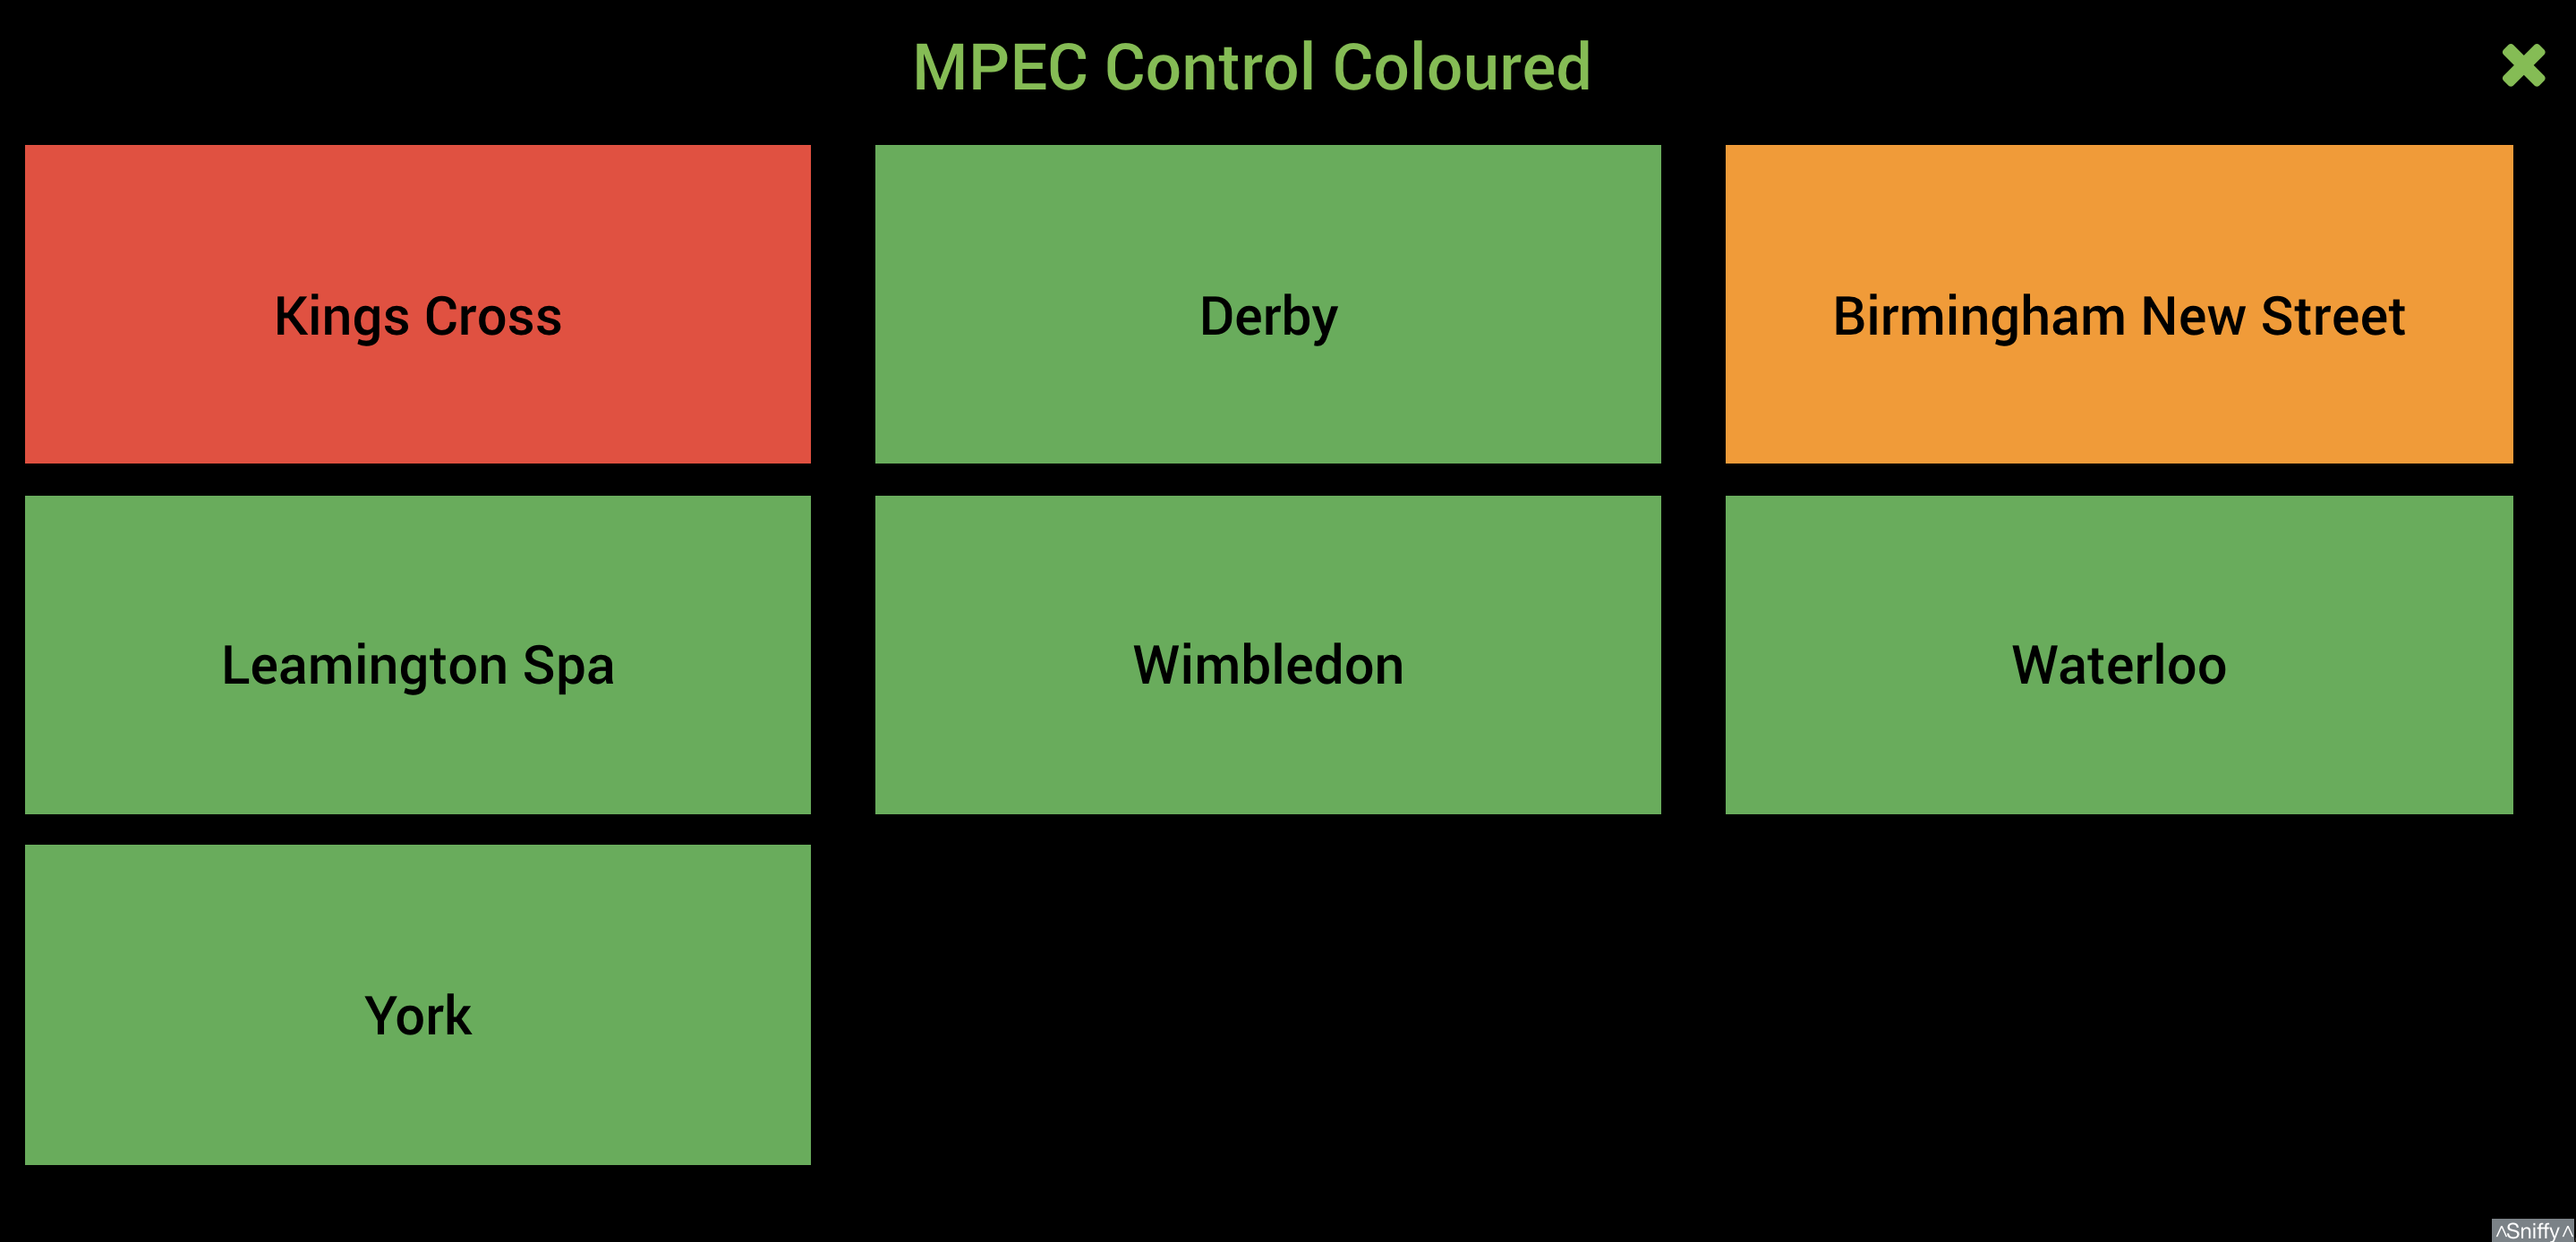
Alarm health dashboards have a new look, which has been designed to use as much screen space as possible while fitting all of the health groups, indications or alarms on a single screen.
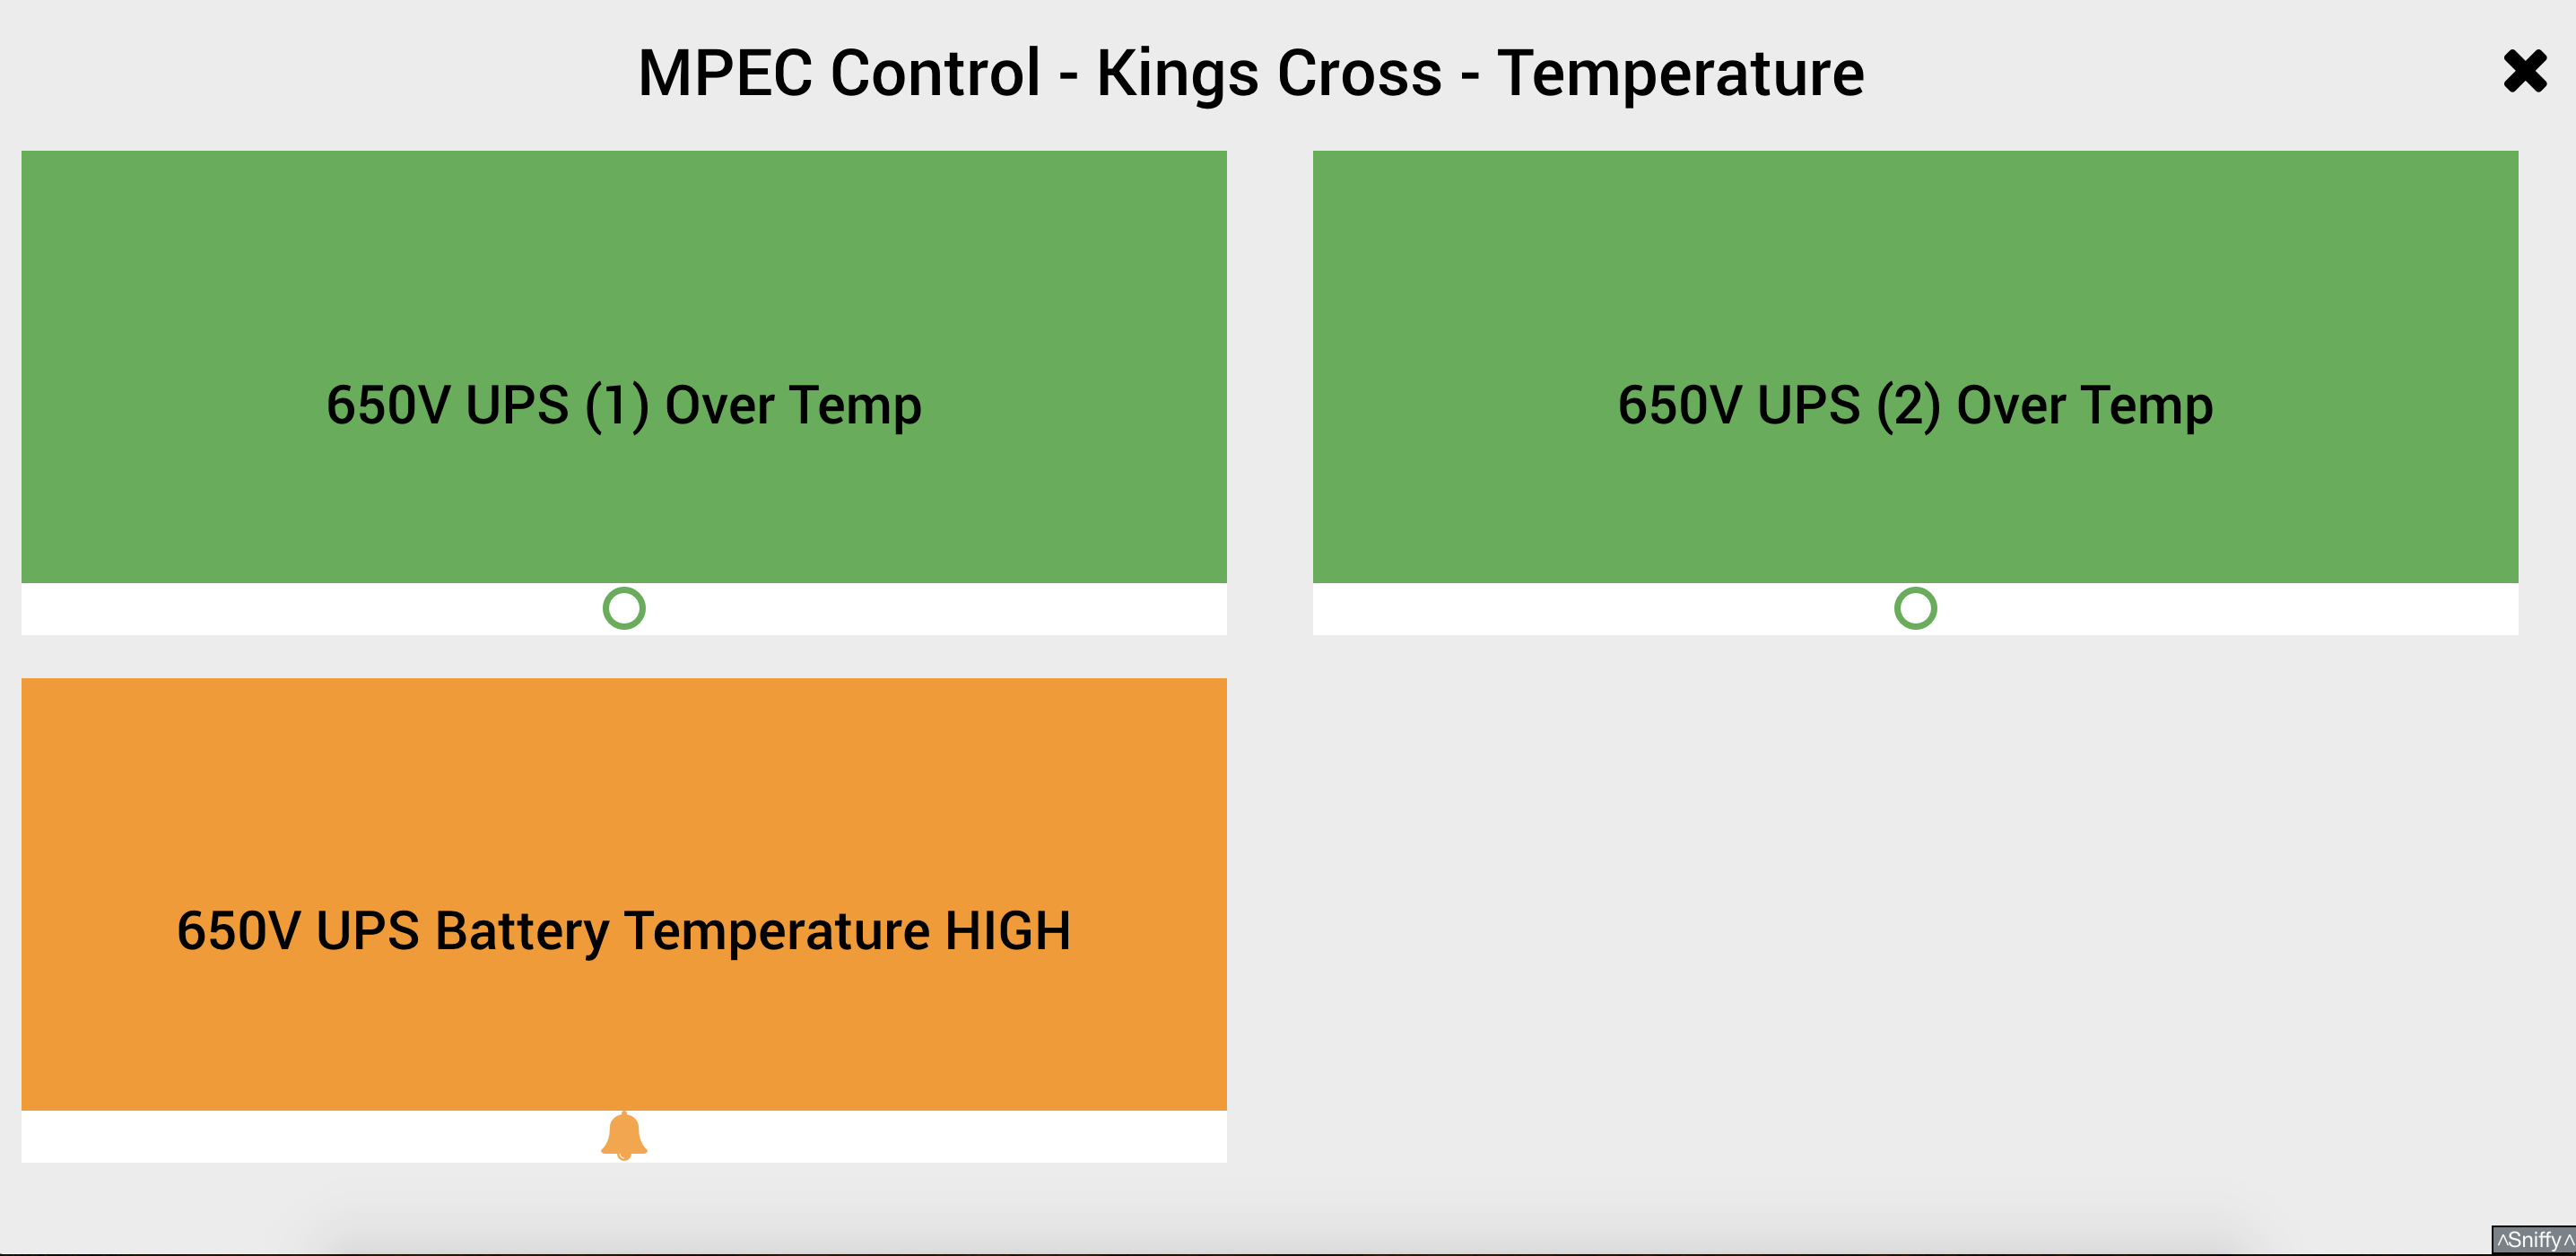
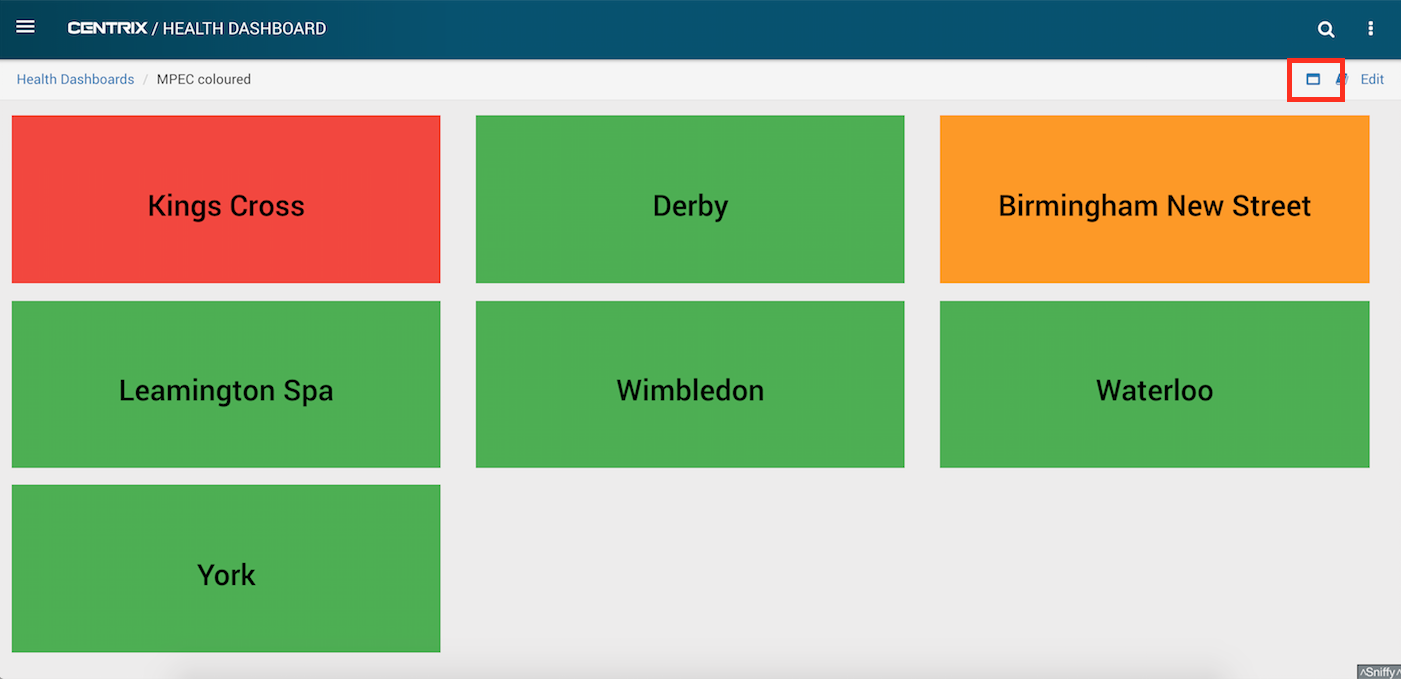
The dashboard is made up of coloured buttons, where the background colour indicates the health state of the health group, indication or alarm.
Clicking on a particular health group takes you to its indications. Clicking on a particular indication takes you to its alarms. Clicking on an alarm takes you to the alarm's page.
MPEC Control
MPEC Control > Kings Cross
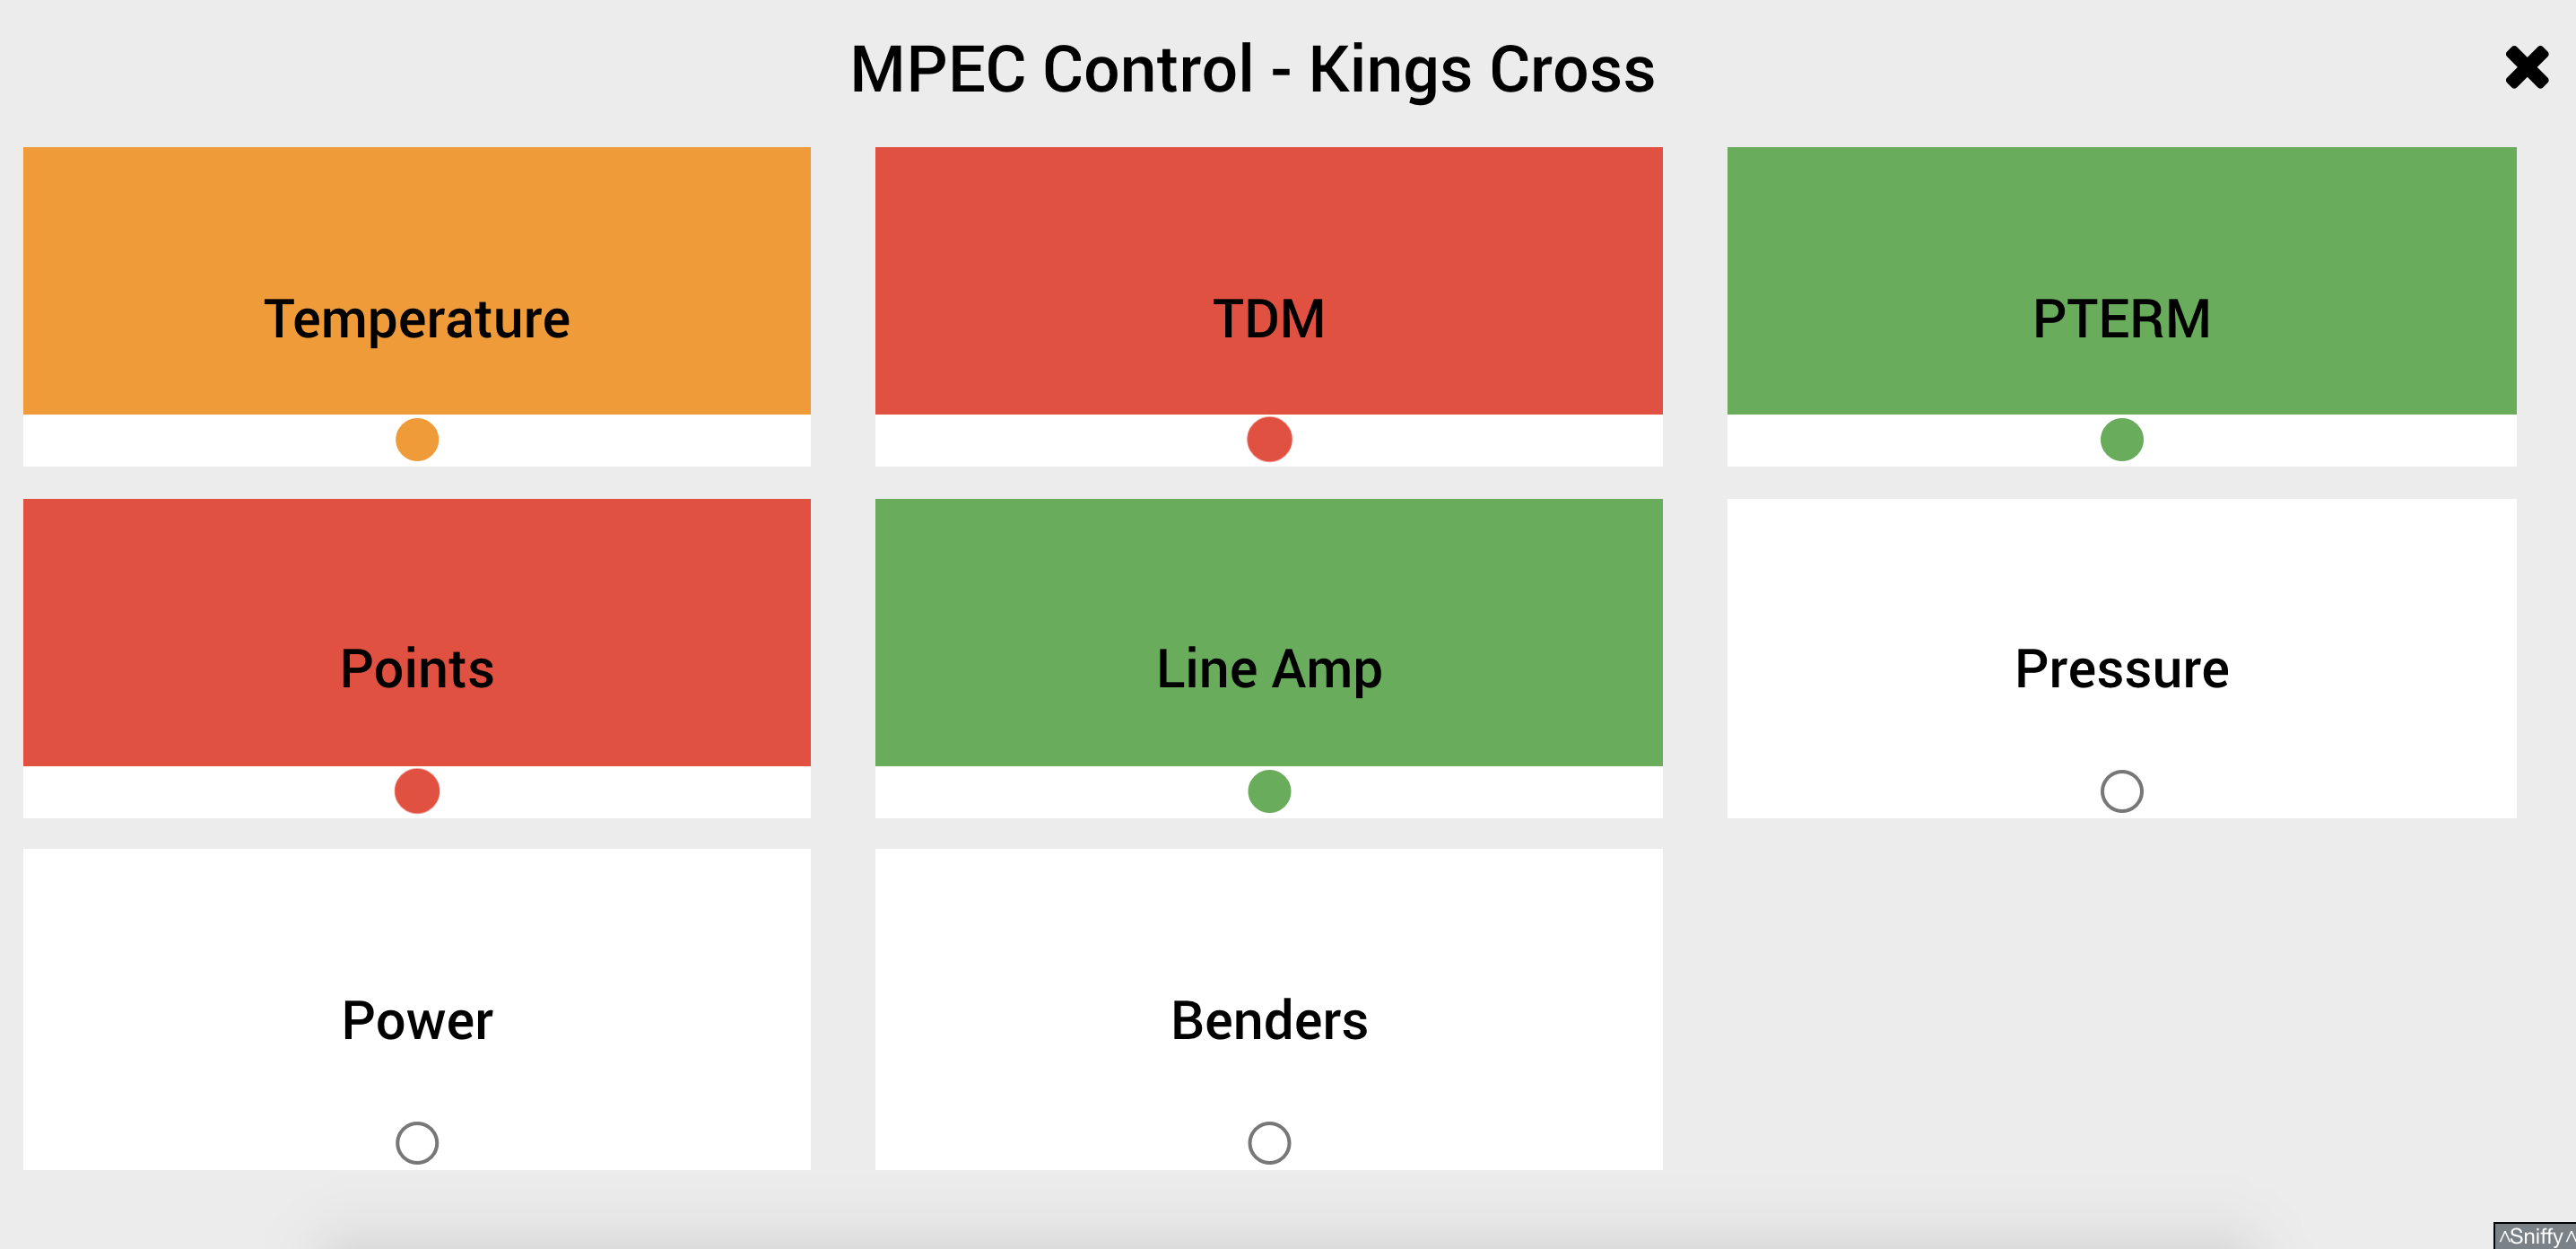
MPEC Control > Kings Cross > Temperature
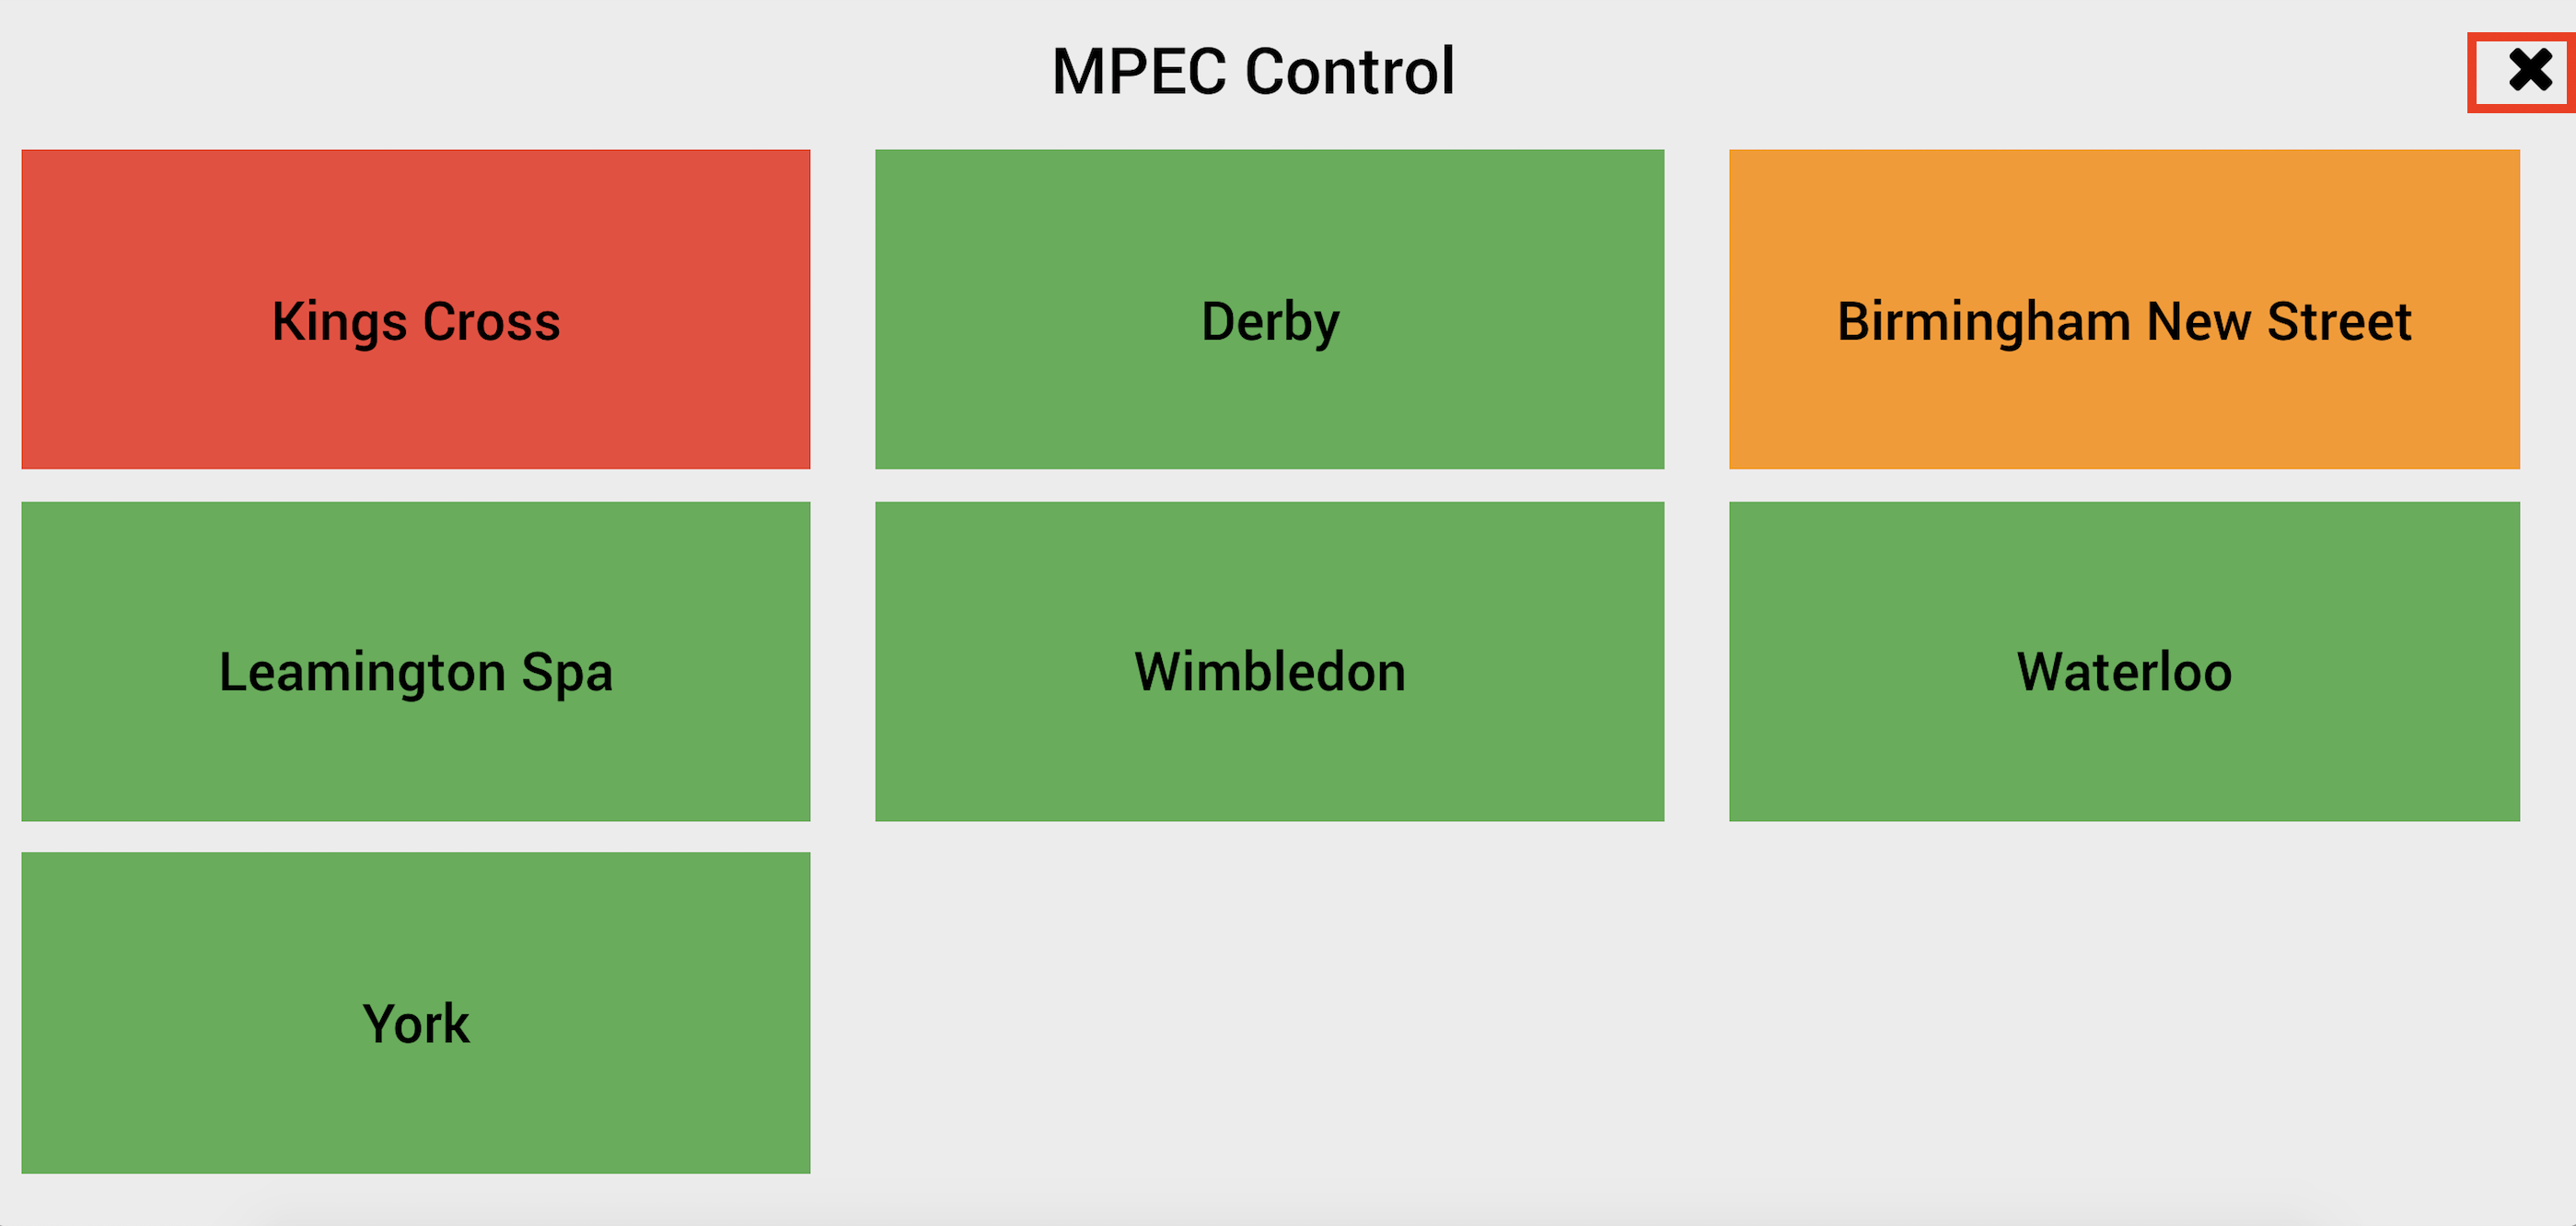
Full screen option
Dashboards can be displayed in full screen with a large title describing the current dashboard.
Full screen can be exited by pressing the cross in the top right corner.
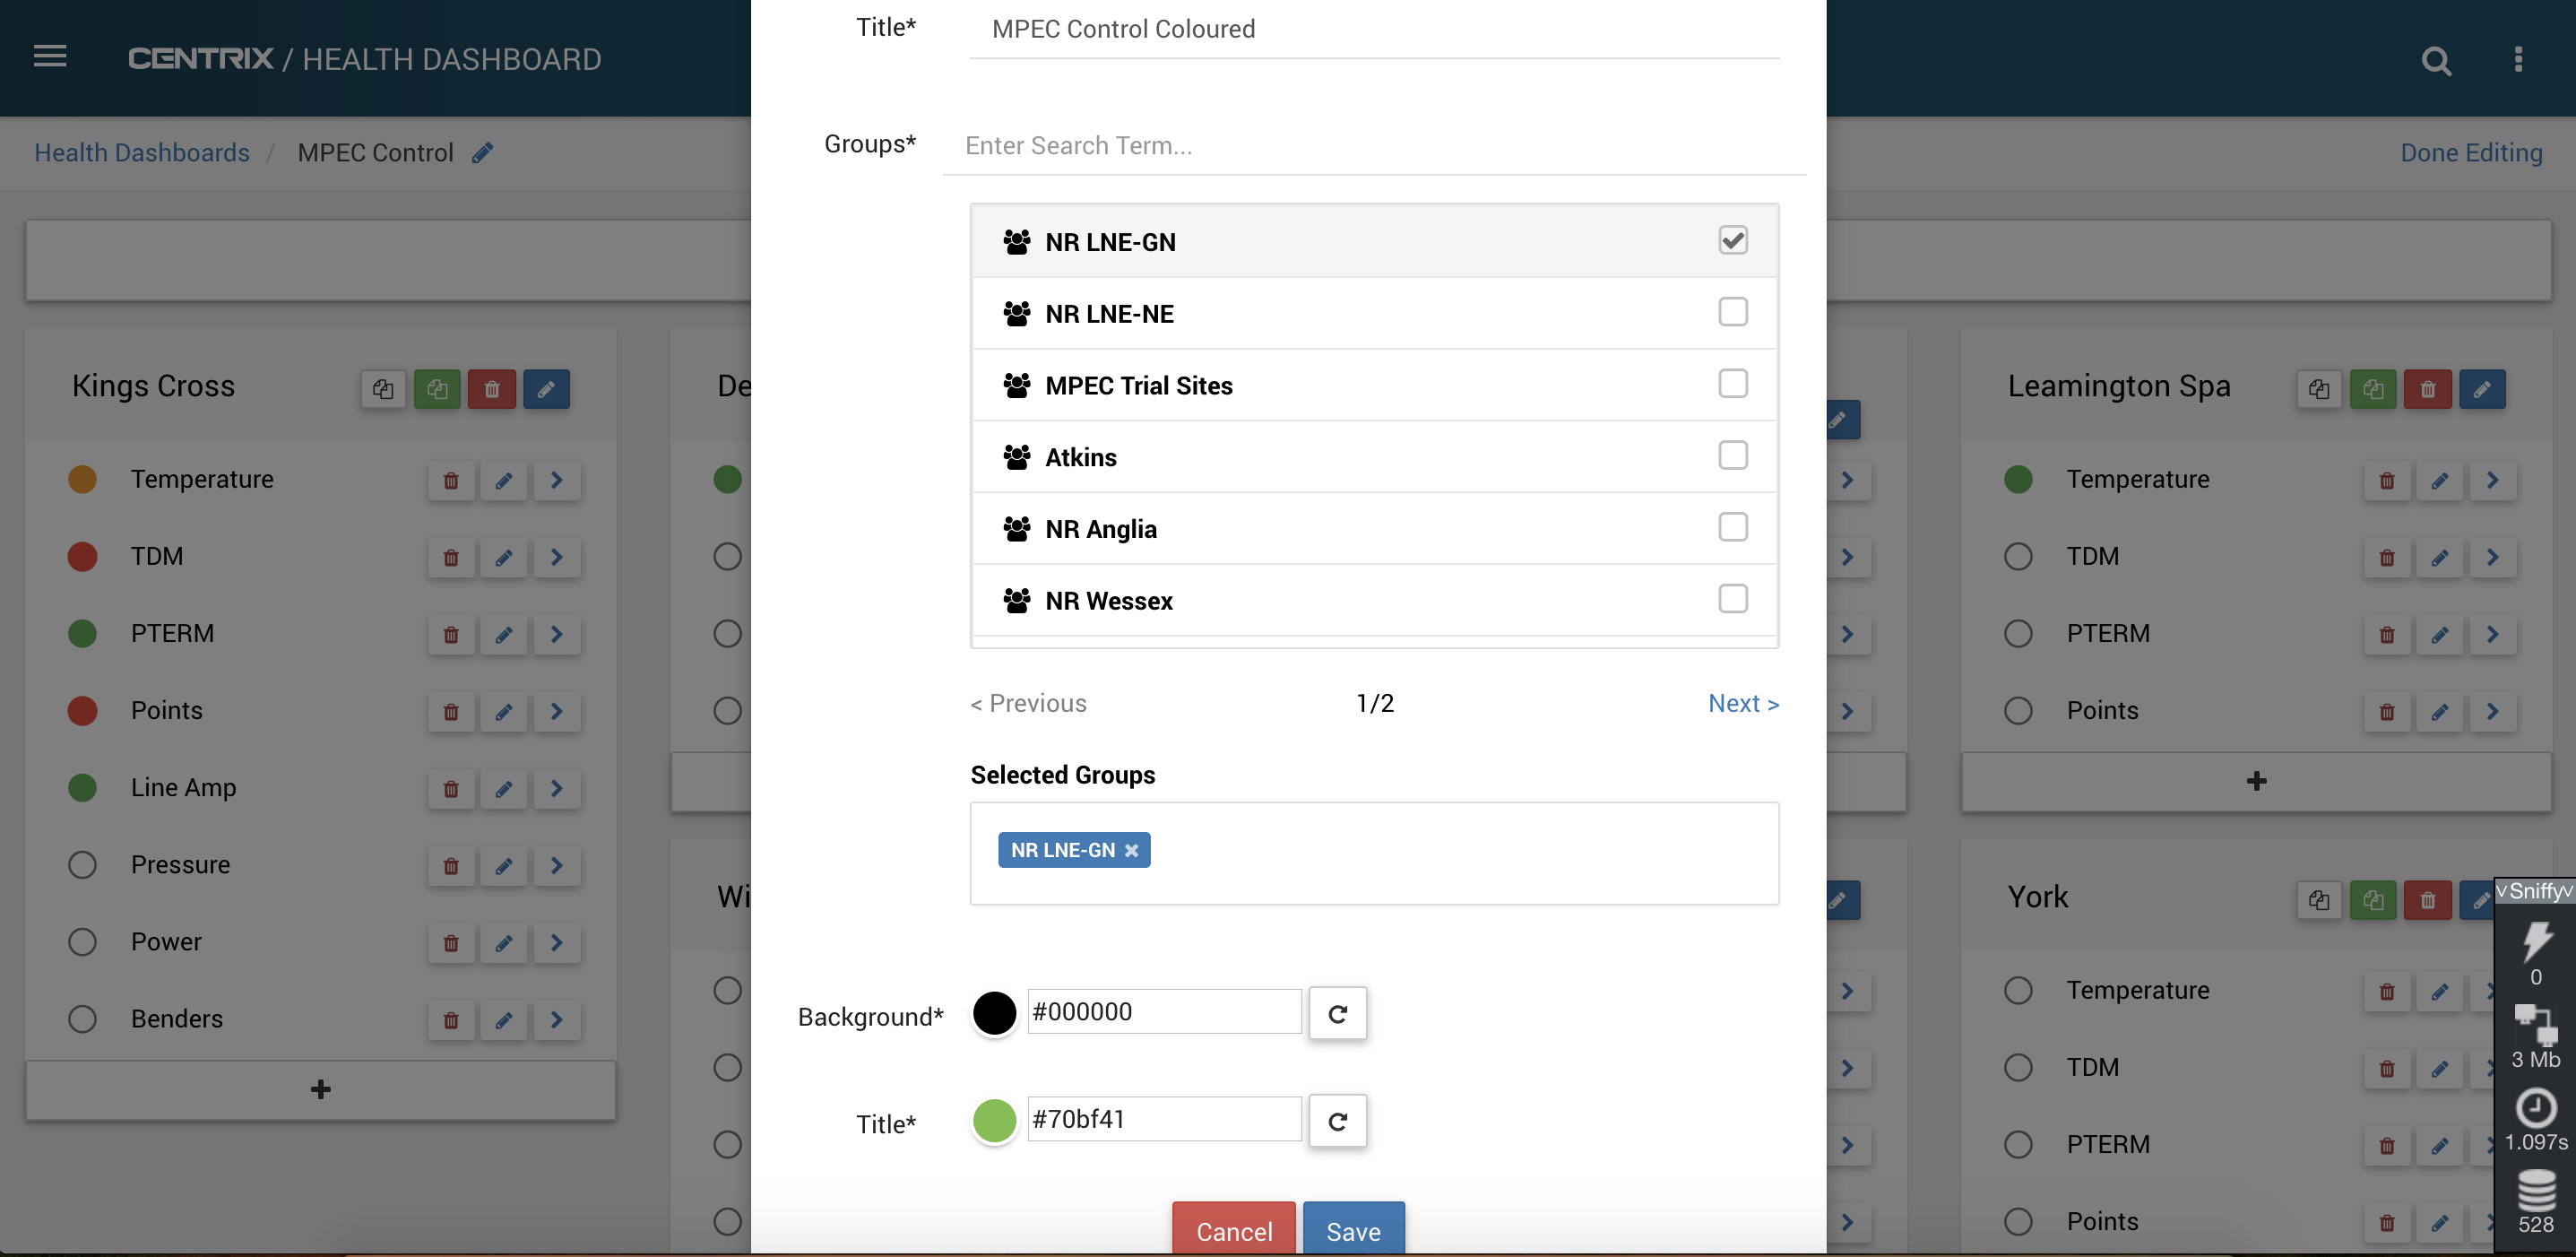
Customise colours
When editing or creating a health dashboard you can now customise it by changing the default background colour and the default title colour.
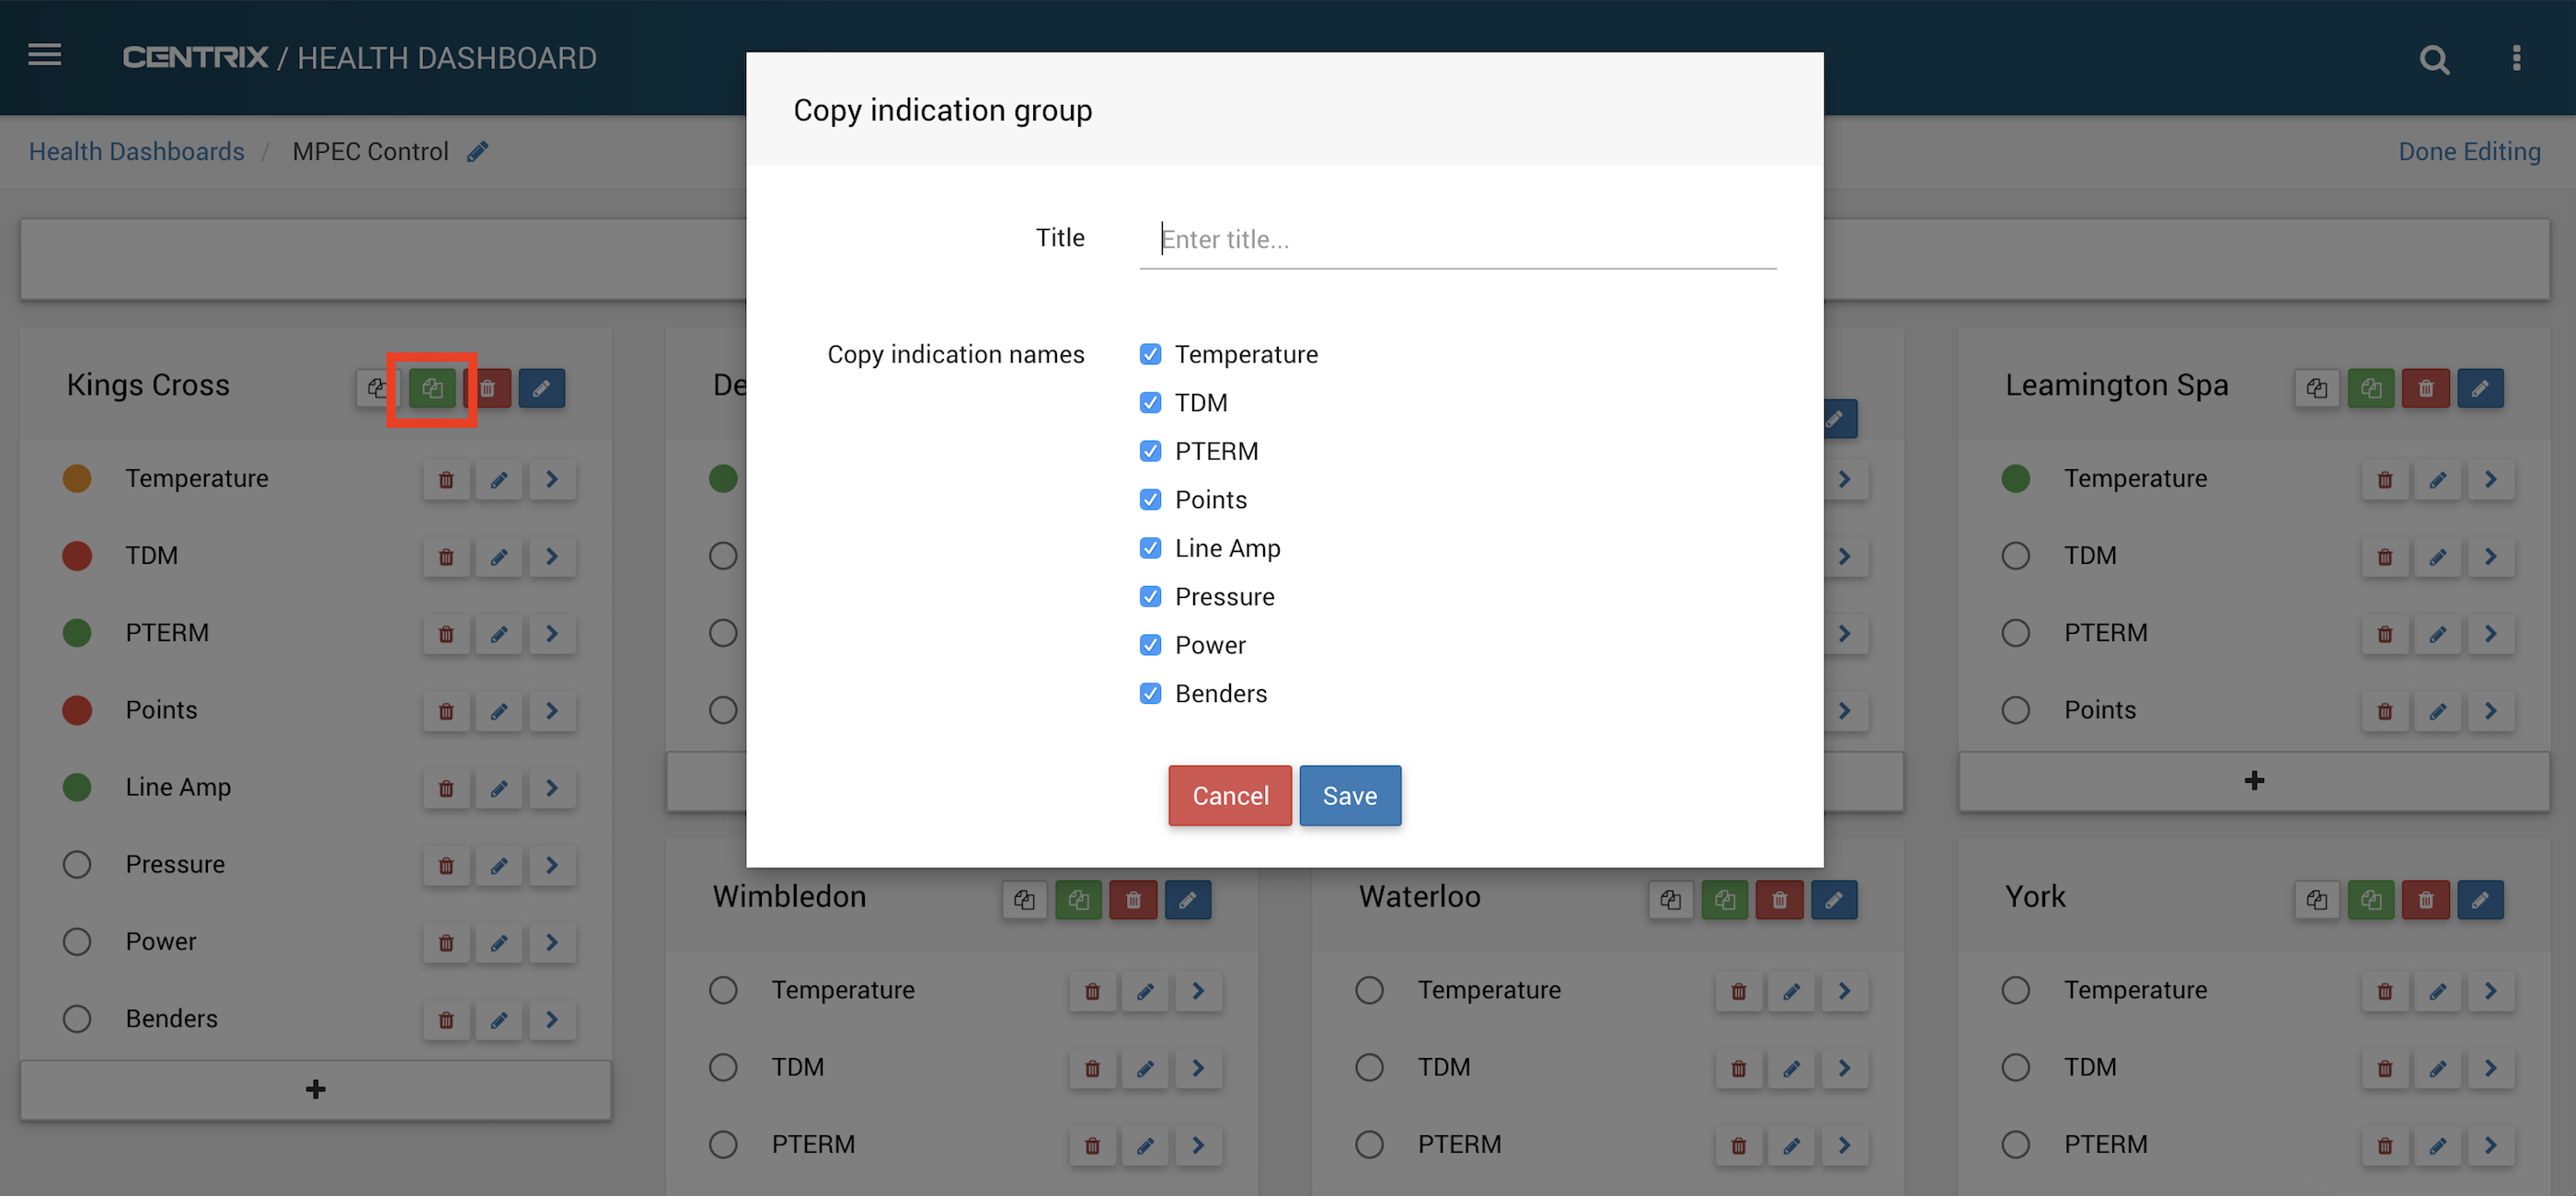
Copy an Indication Health Group
To quickly create a new health group based on an existing health group, press the duplicate button.
This brings up a dialog that allows you to set the title for the new health group, and select which indication names to copy across to the new health group.
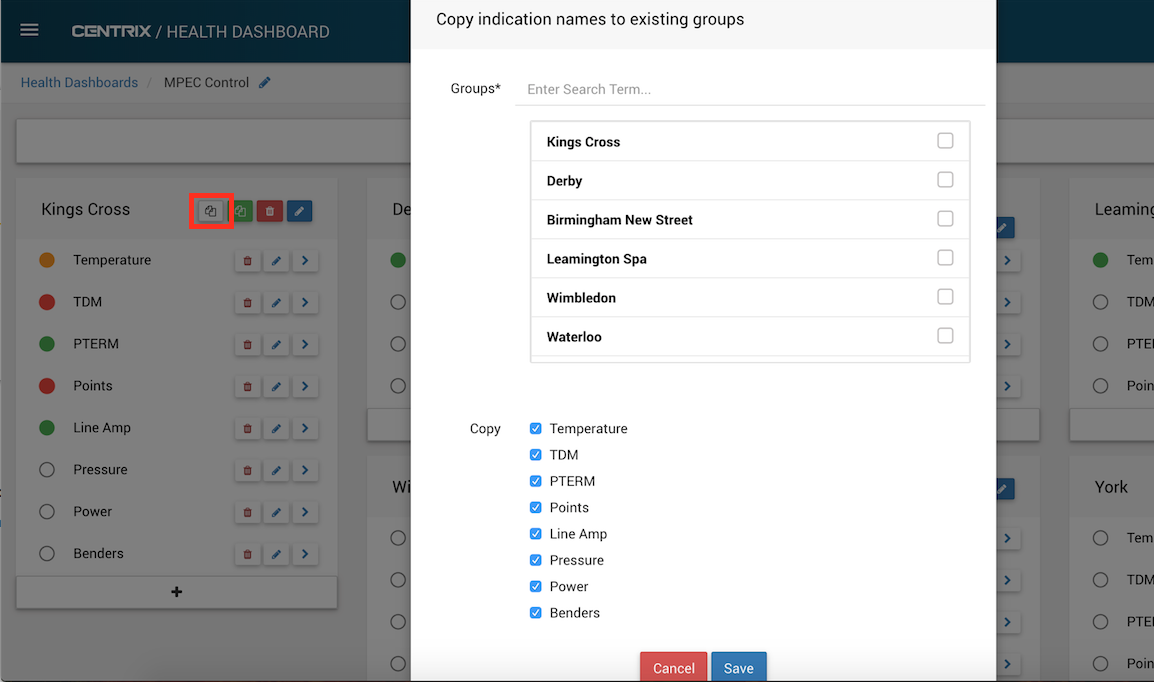
Copy indication names to existing groups
To quickly copy existing indication names to one or many existing groups, press the copy button.
This brings up a dialog that allows to copy multiple existing indication names across to multiple existing health groups.
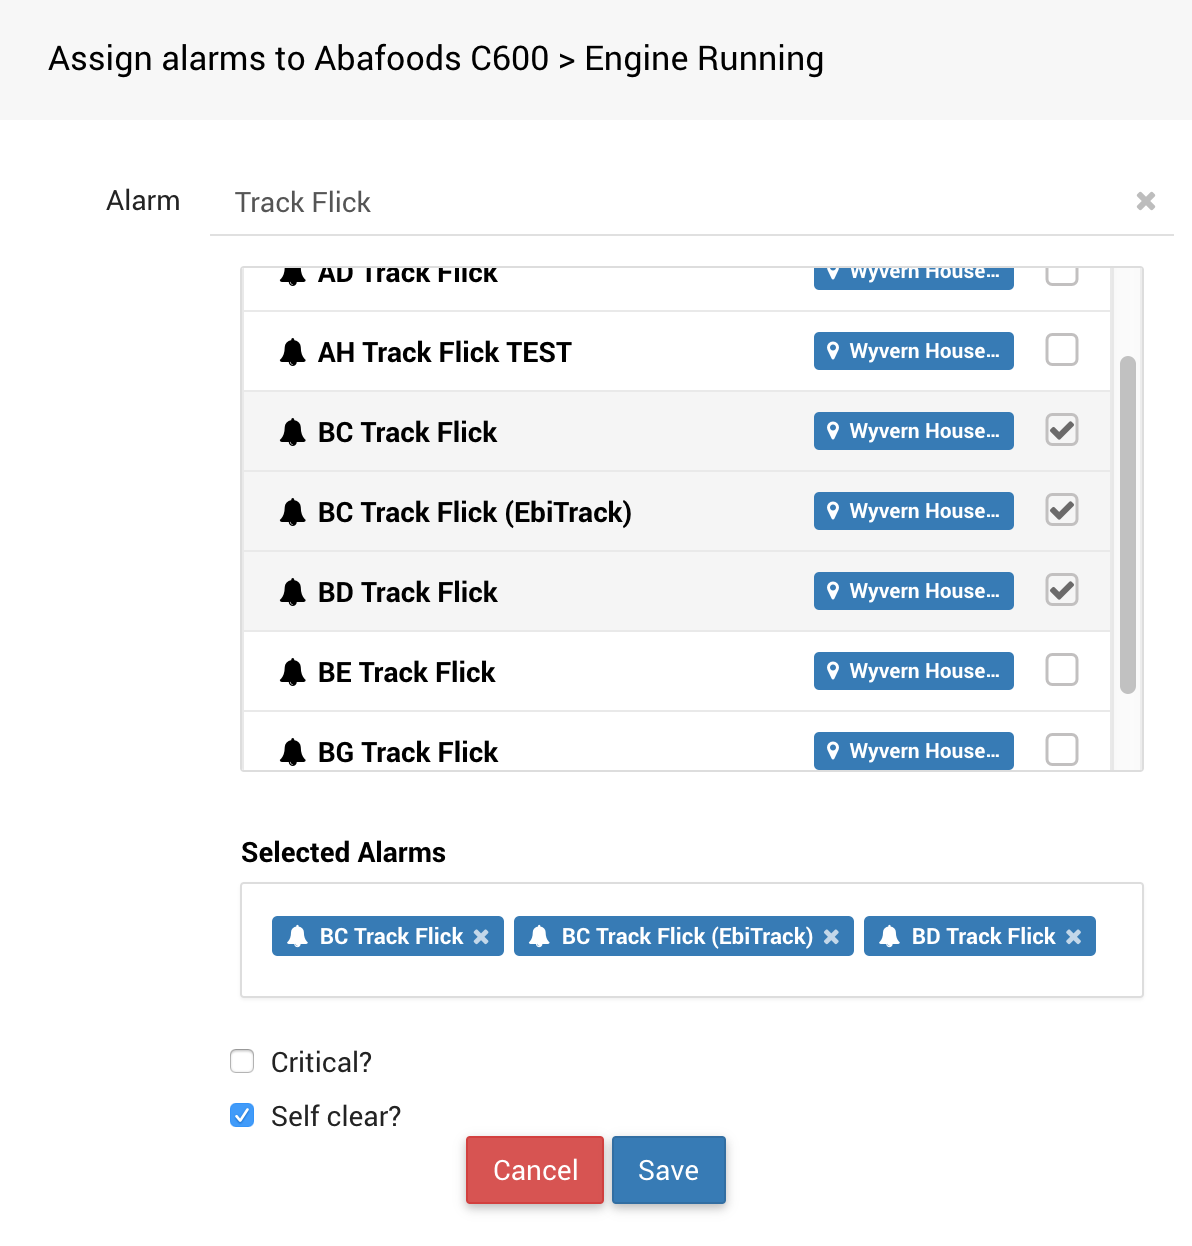
Multiple alarm assignment
When adding alarms to an indication, you can now select multiple alarms and add them, rather than adding one by one.
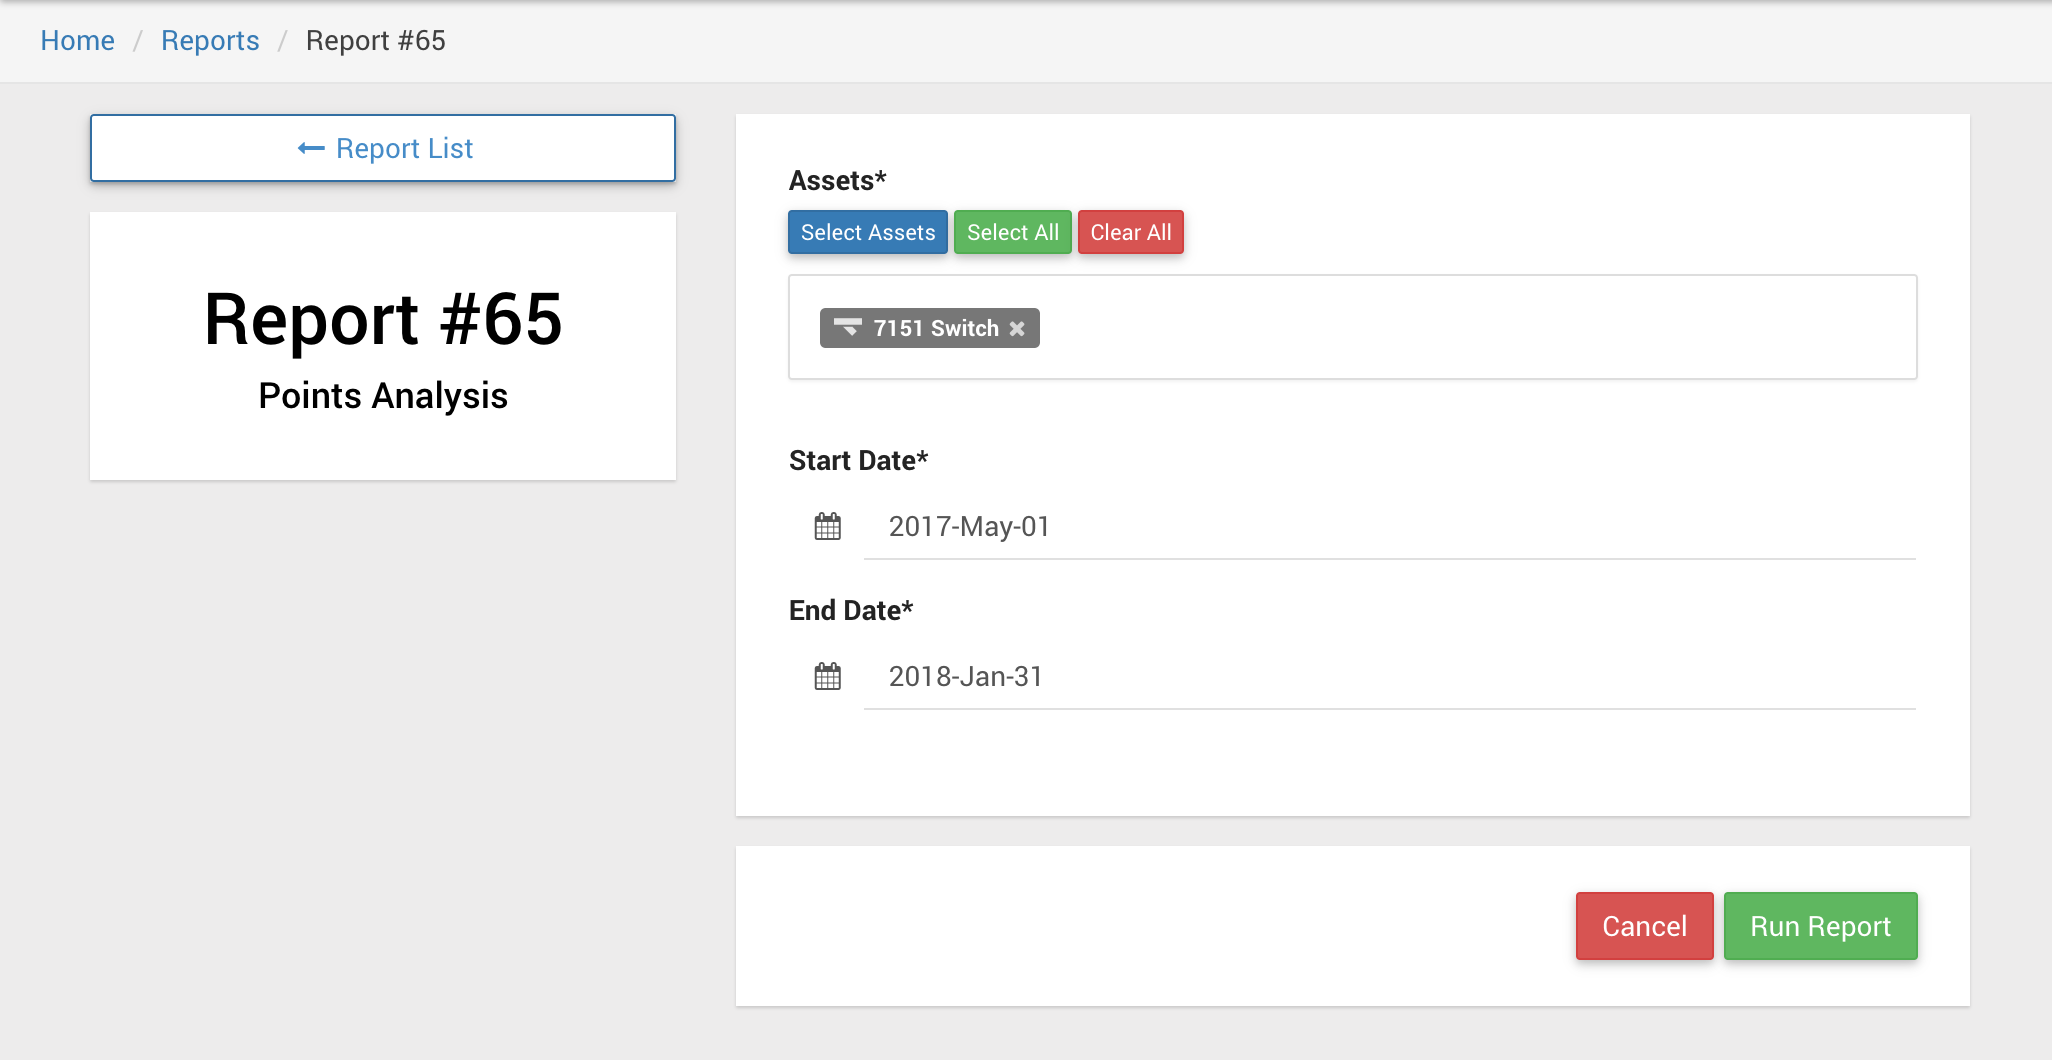
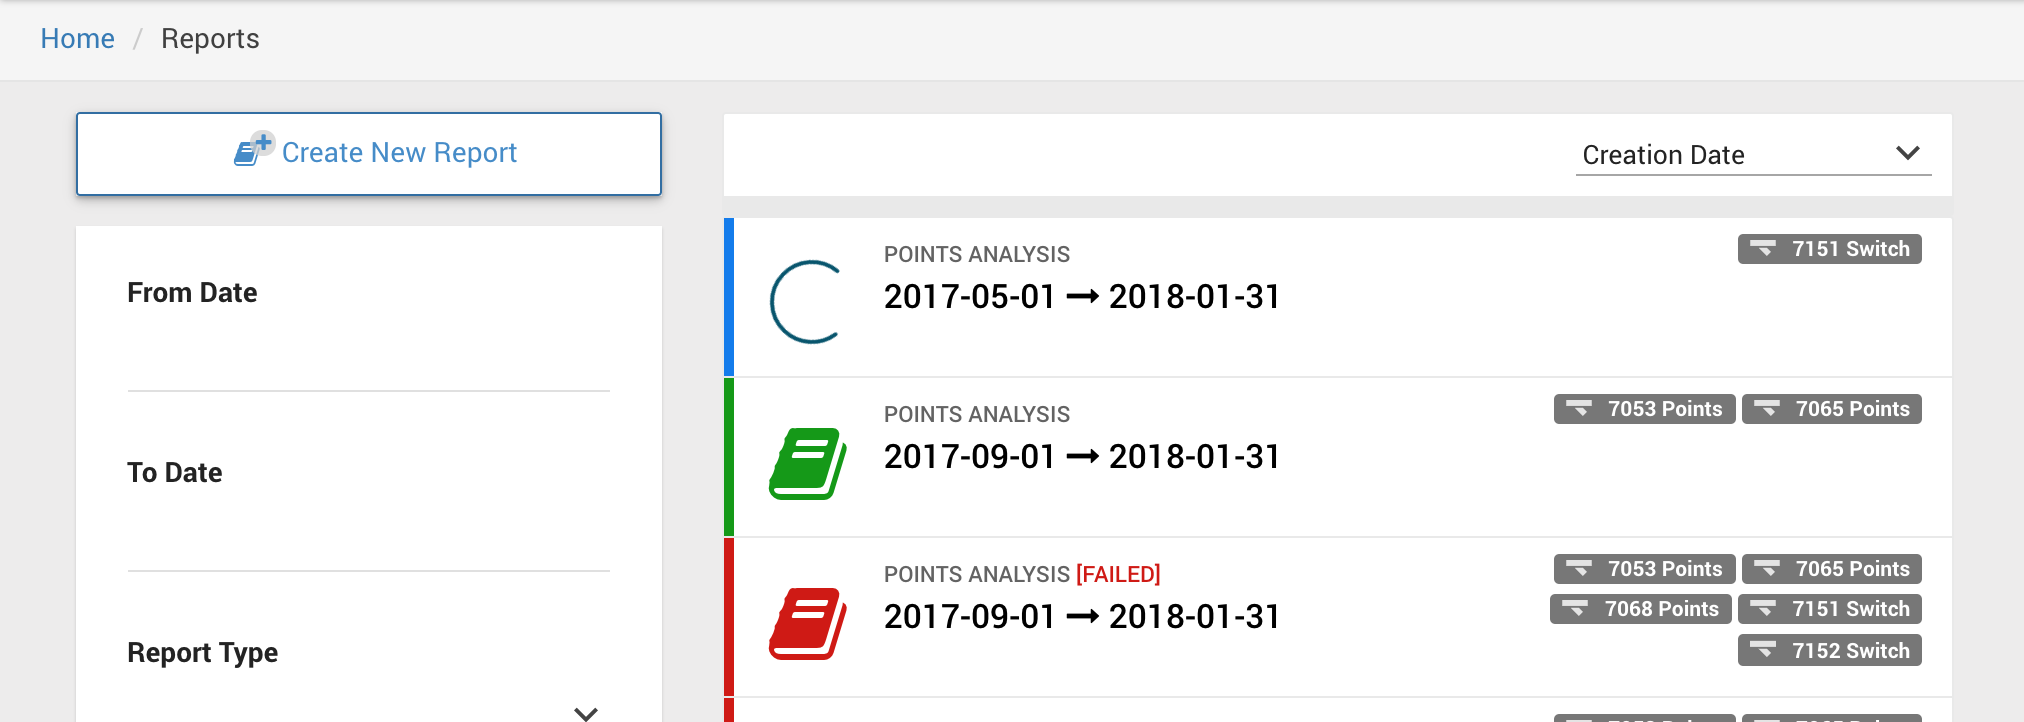
Report management
This release introduces a new combined report management and creation workflow. Previously, each report type had its own listing, and presented their status and results inconsistently.
All report types are now created through a single link; Menu > Reports > Create New Report...
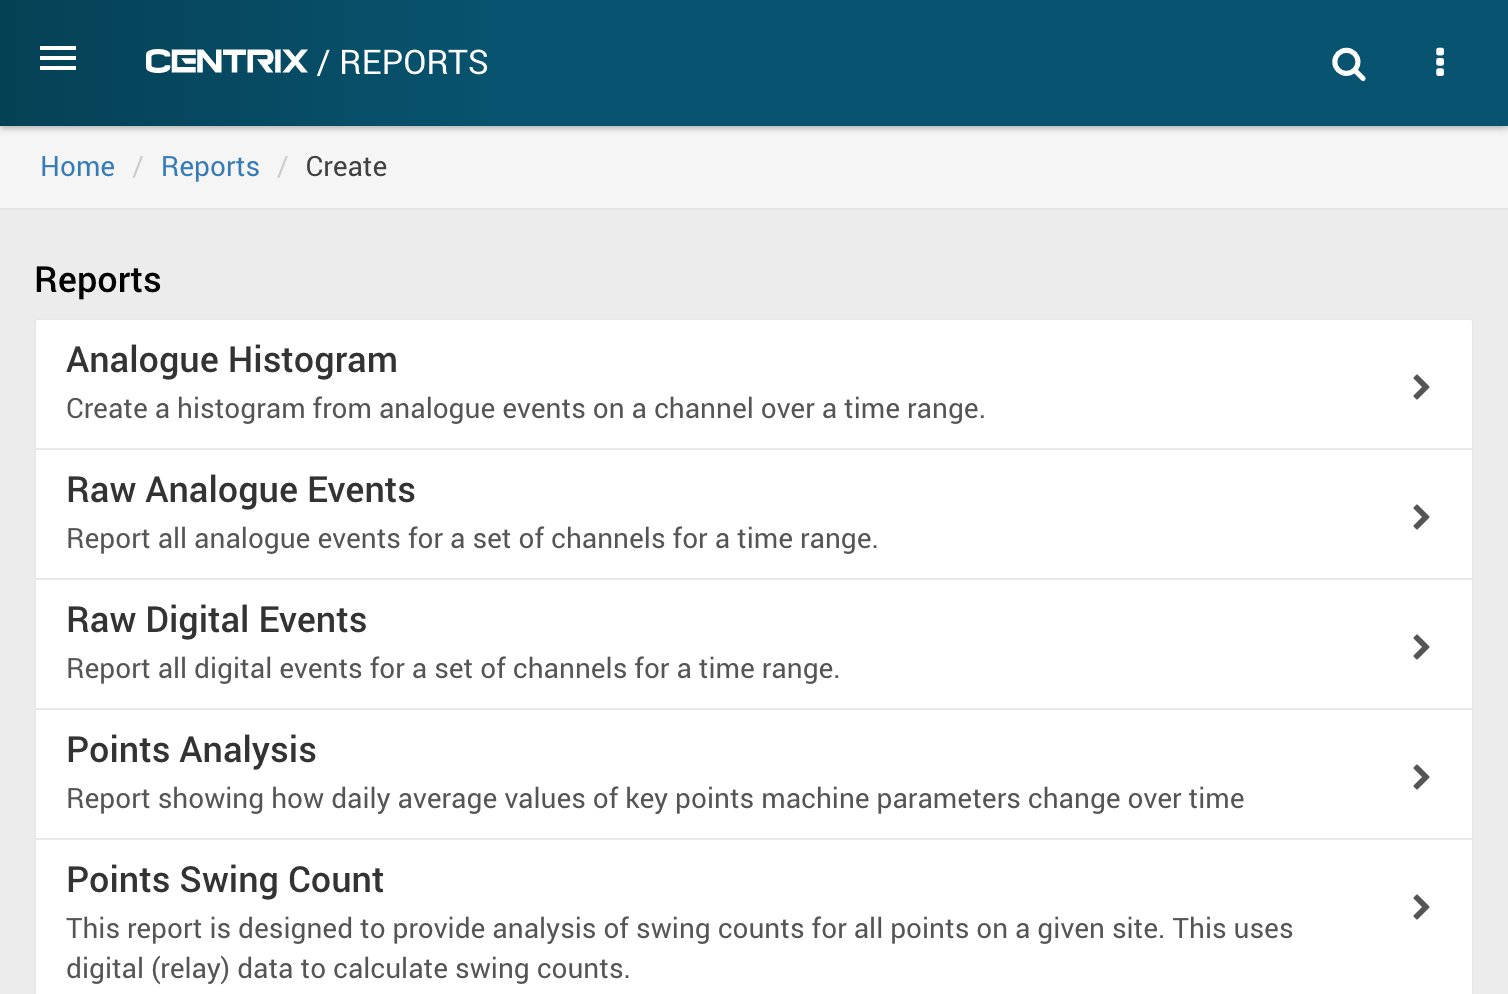
Each report type will have unique parameters, but the setup page looks consistent for each report type;
Reports are now run as background tasks and the results are saved. This means you can carry on working on other areas of Centrix and return when your report has completed. You can also view the report again in the future without having to re-run it.
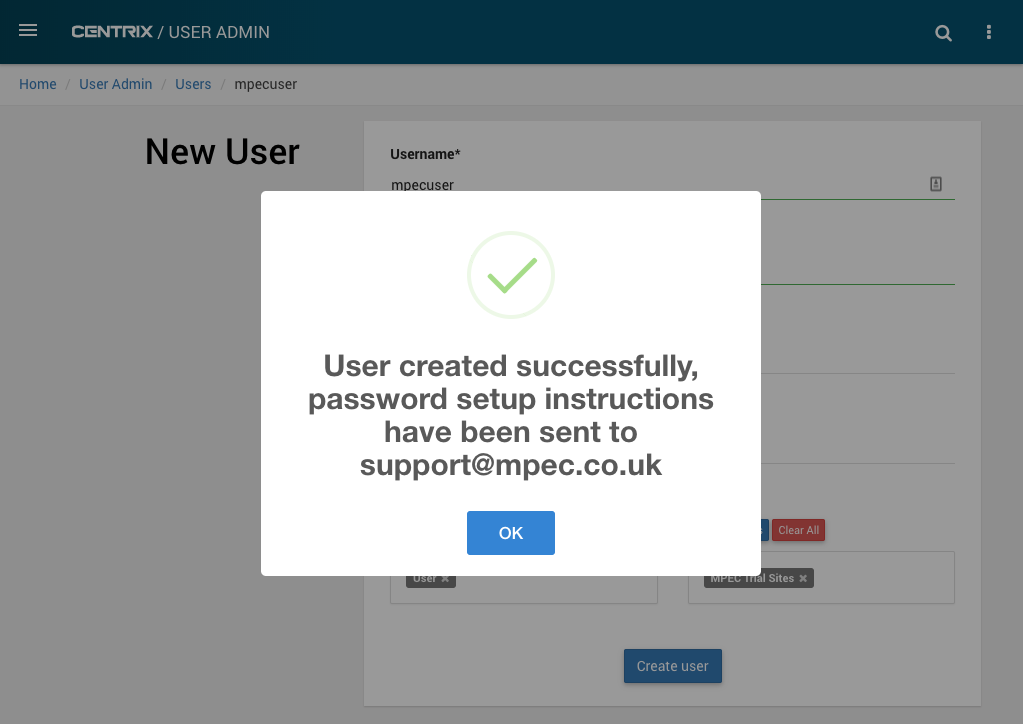
Account setup email when creating users
The password fields have been removed from the "create user" form in the User Admin area of Centrix.
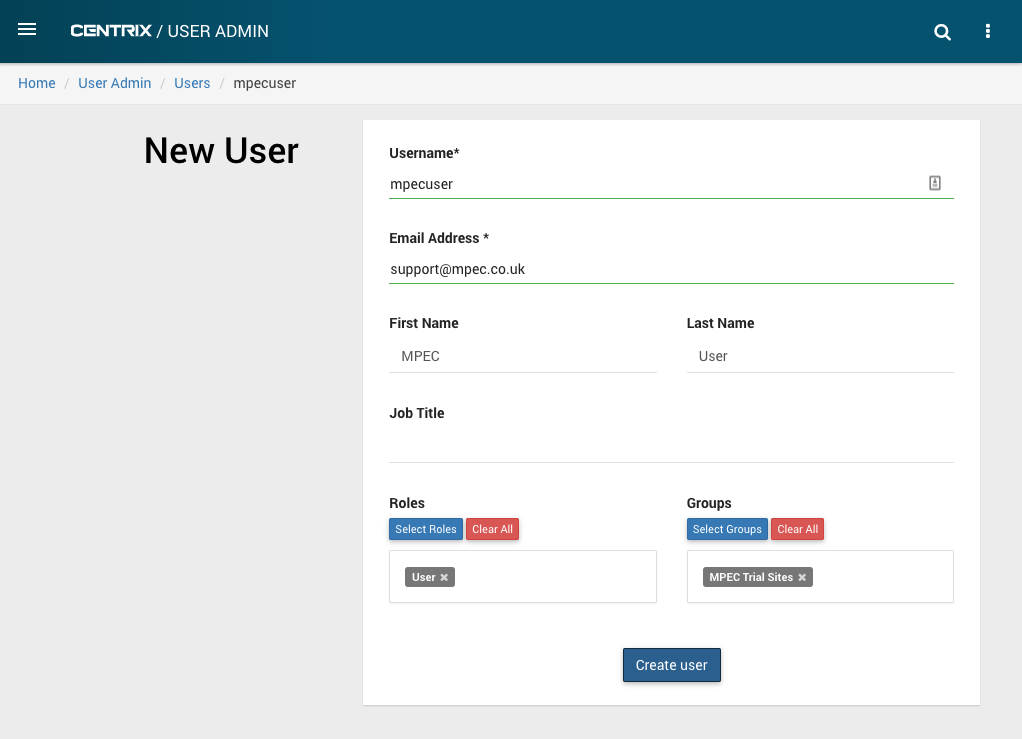
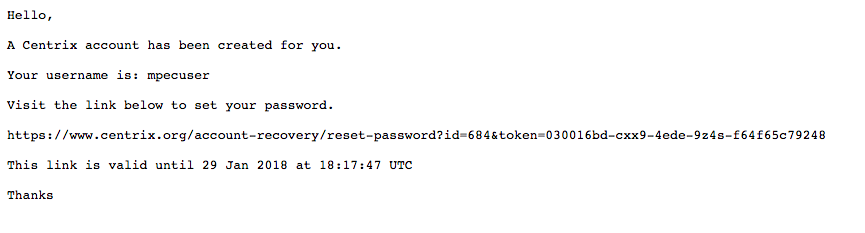
When creating a new user, the account details will automatically be emailed to the user.
Sample email:
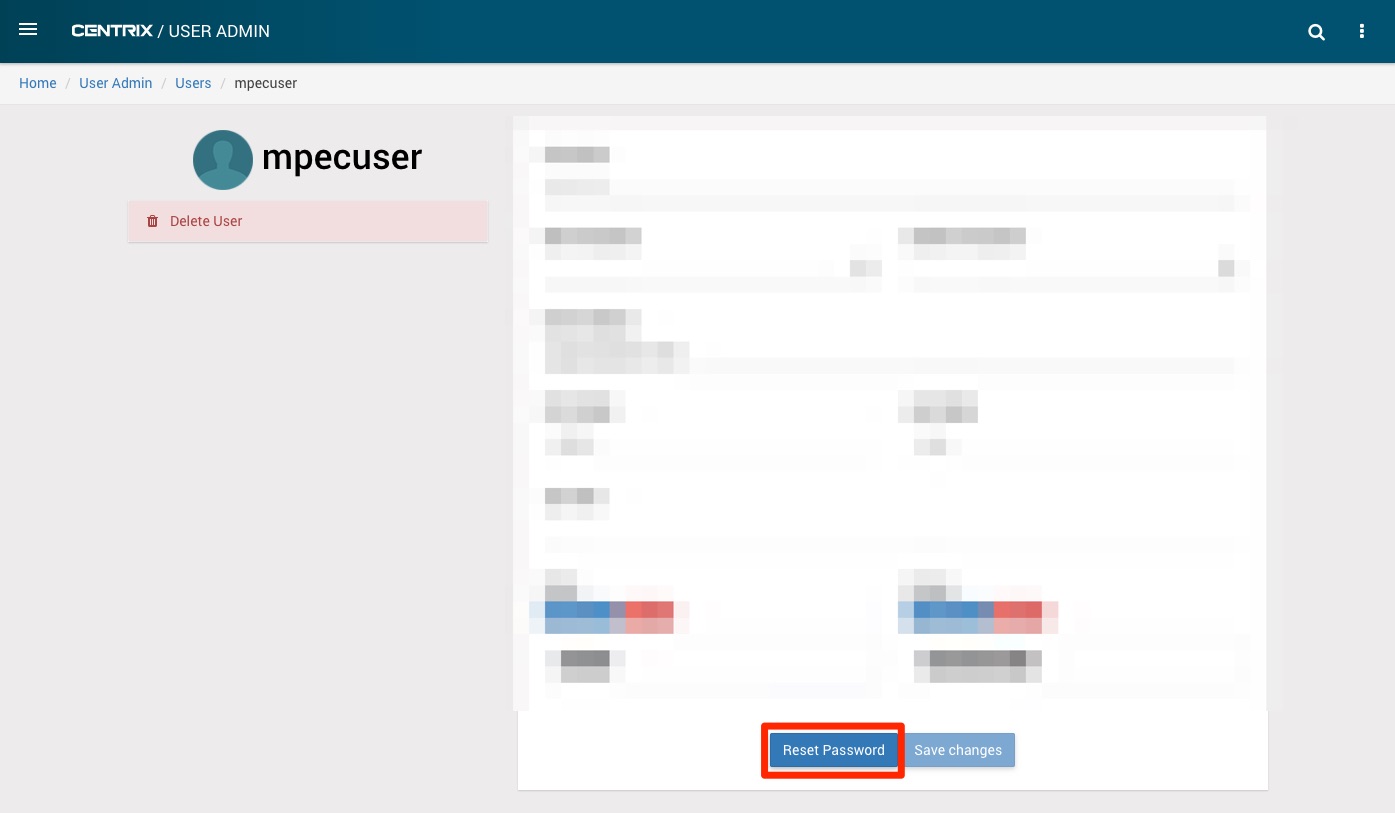
Password reset
A "Reset Password" button has been added to the user page in Centrix. This will cause a password reset email to be sent to the user.
Performance improvements
Read from database replicas
The Centrix database connection pool now connects to all nodes in the cluster for data reads. This allows the load to be distributed across the cluster, whilst writes are all performed on the master node.
Minor amendments and fixed issues
- Deleting a user and then re-creating a new user with the same username prevented login and password recovery