Centrix R81 Release Notes
- James Spencer
- Former user (Deleted)
- Jamie (Deactivated)
- Robert Hunt (Unlicensed)
Outdated Release
This page contains release notes for a previous release, see Centrix R82 Release Notes for the current release.
Sequence timing report
The sequence timing report create page has been updated to make it more user friendly and allow for more advanced sequences.
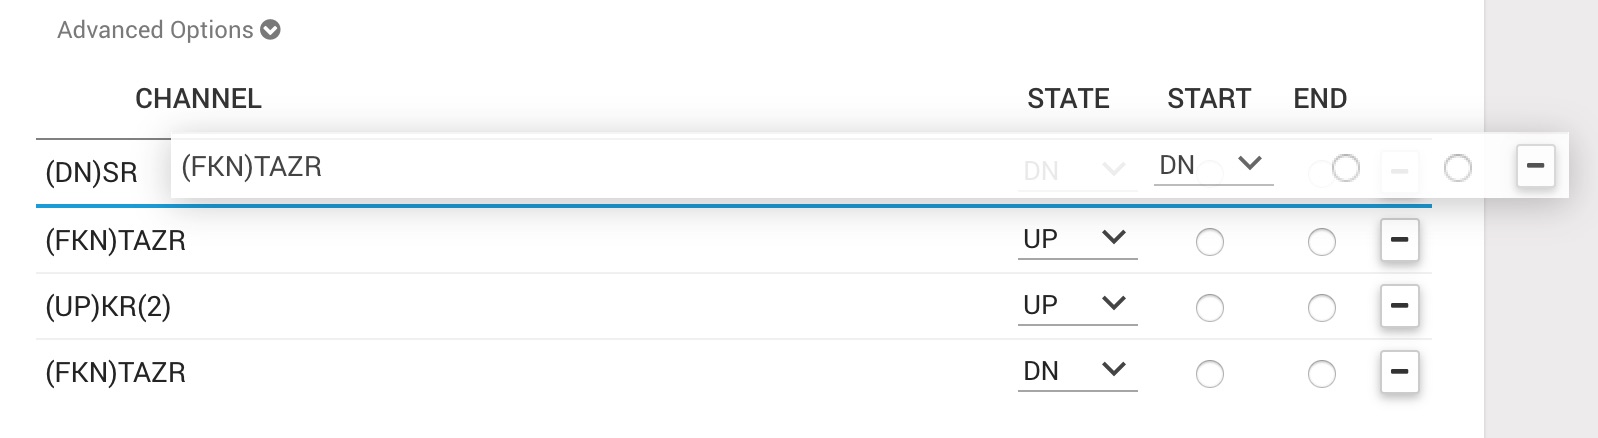
The sequence list now has drag and drop functionality. The screenshot below demonstrates how this looks, the floating image shows which channel you are dragging and the blue line represents where the dropped channel will be placed in the sequence.
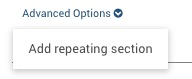
A dropdown list of advanced options has been added, just above the sequence list. There is currently one advanced option in the list, add/remove a repeating section.
A repeating section of the sequence is a part of the sequence which may happen one or more times. This behaviour is useful if, for example, you are using this report to monitor a channel which is picking and dropping sporadically due to a potential fault.
Selecting the add repeat section option will add an empty repeating section container to the top of the sequence list. From here the empty container can be dragged and dropped wherever required and channels can be dragged into and out of the container.
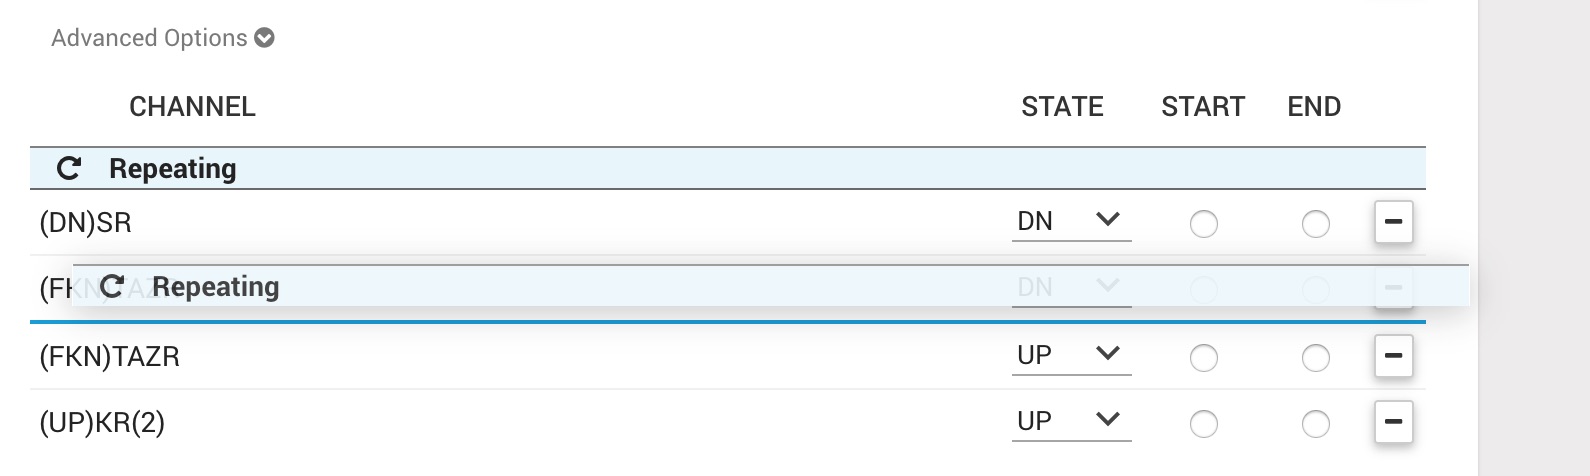
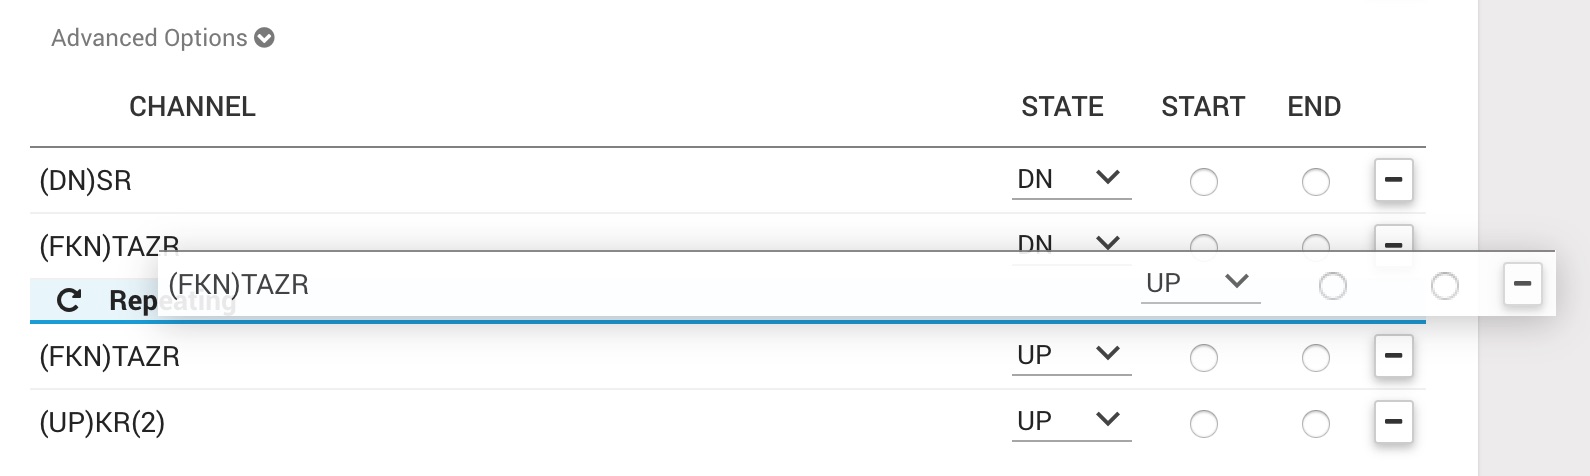
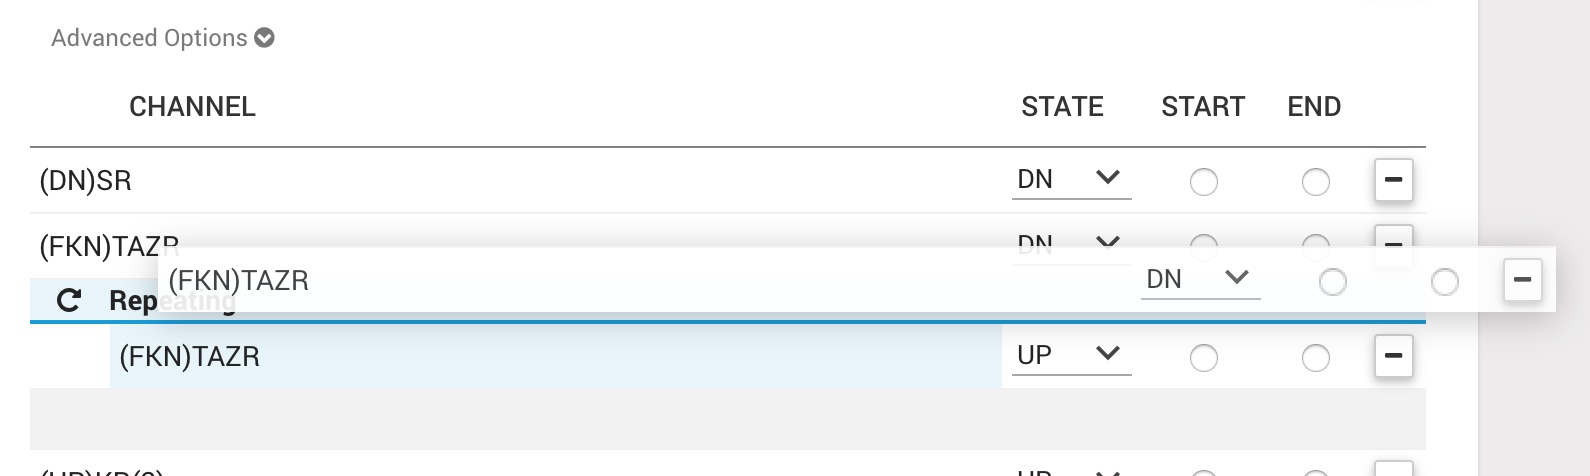
The grey box which appears underneath the repeating section container allows channels to be dropped directly underneath the container.
The view page has been updated to allow custom configuration of bin size, in seconds.
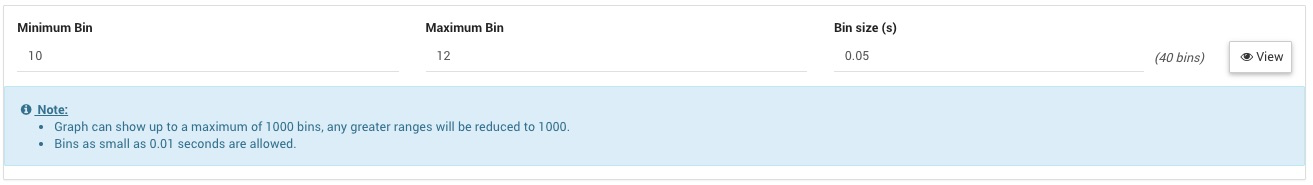
The bin size can be as small as 0.01 seconds and can have up to 2 decimal places. In brackets to the right of the bin size input is the calculated number of bins that will be produced by the input parameters.
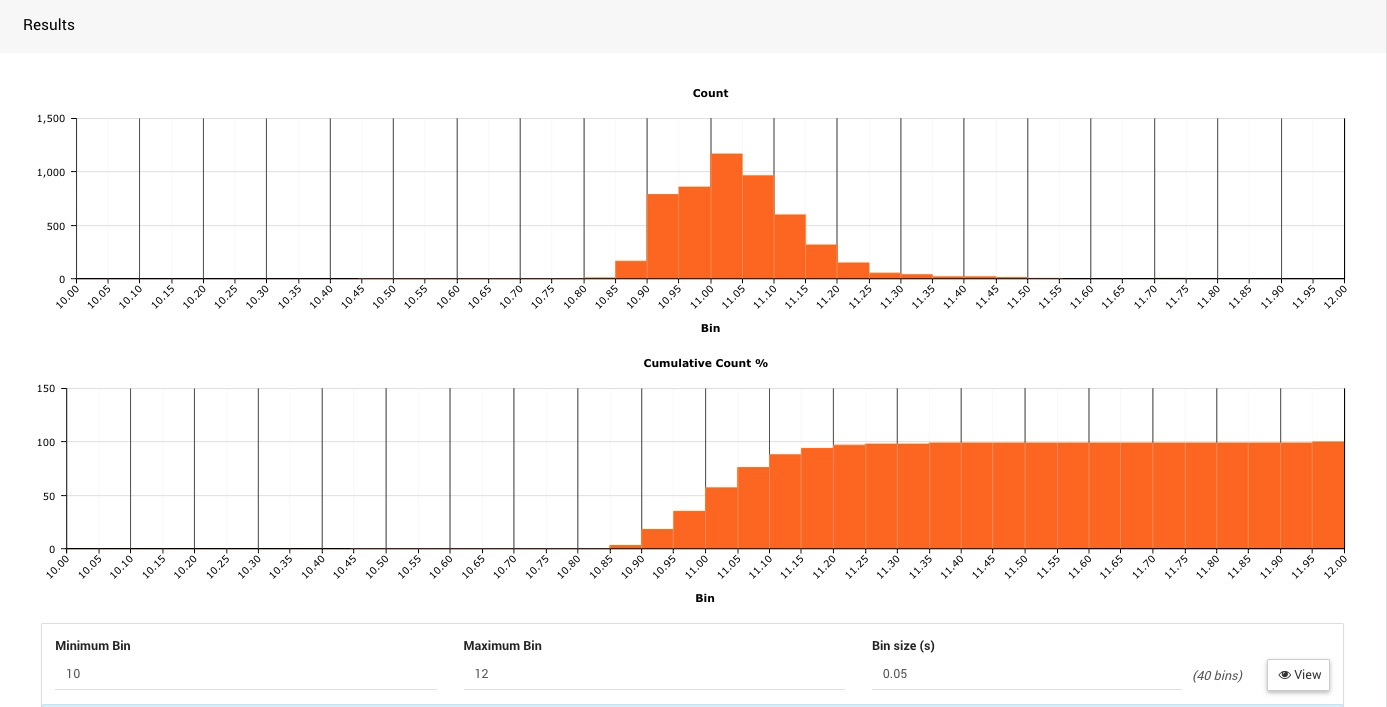
The graphs have been changed to histograms and support zooming.
Alarm raises report
A new report has been added, the Alarm Raises report. This report allows you to report on how many times one or more alarms have raised over a given period of time.
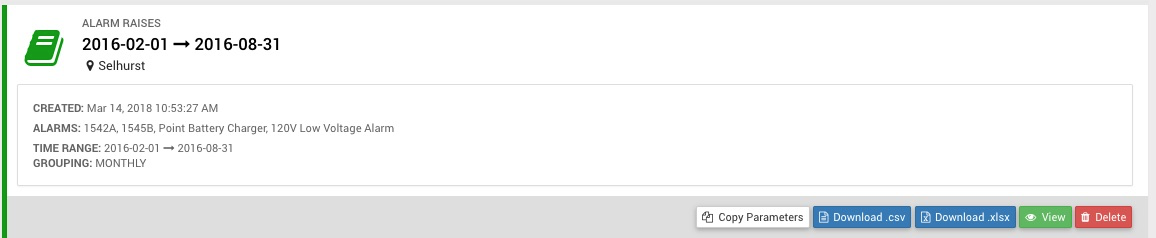
For more detailed information see the user guide.
Asset View / Asset Health Playback
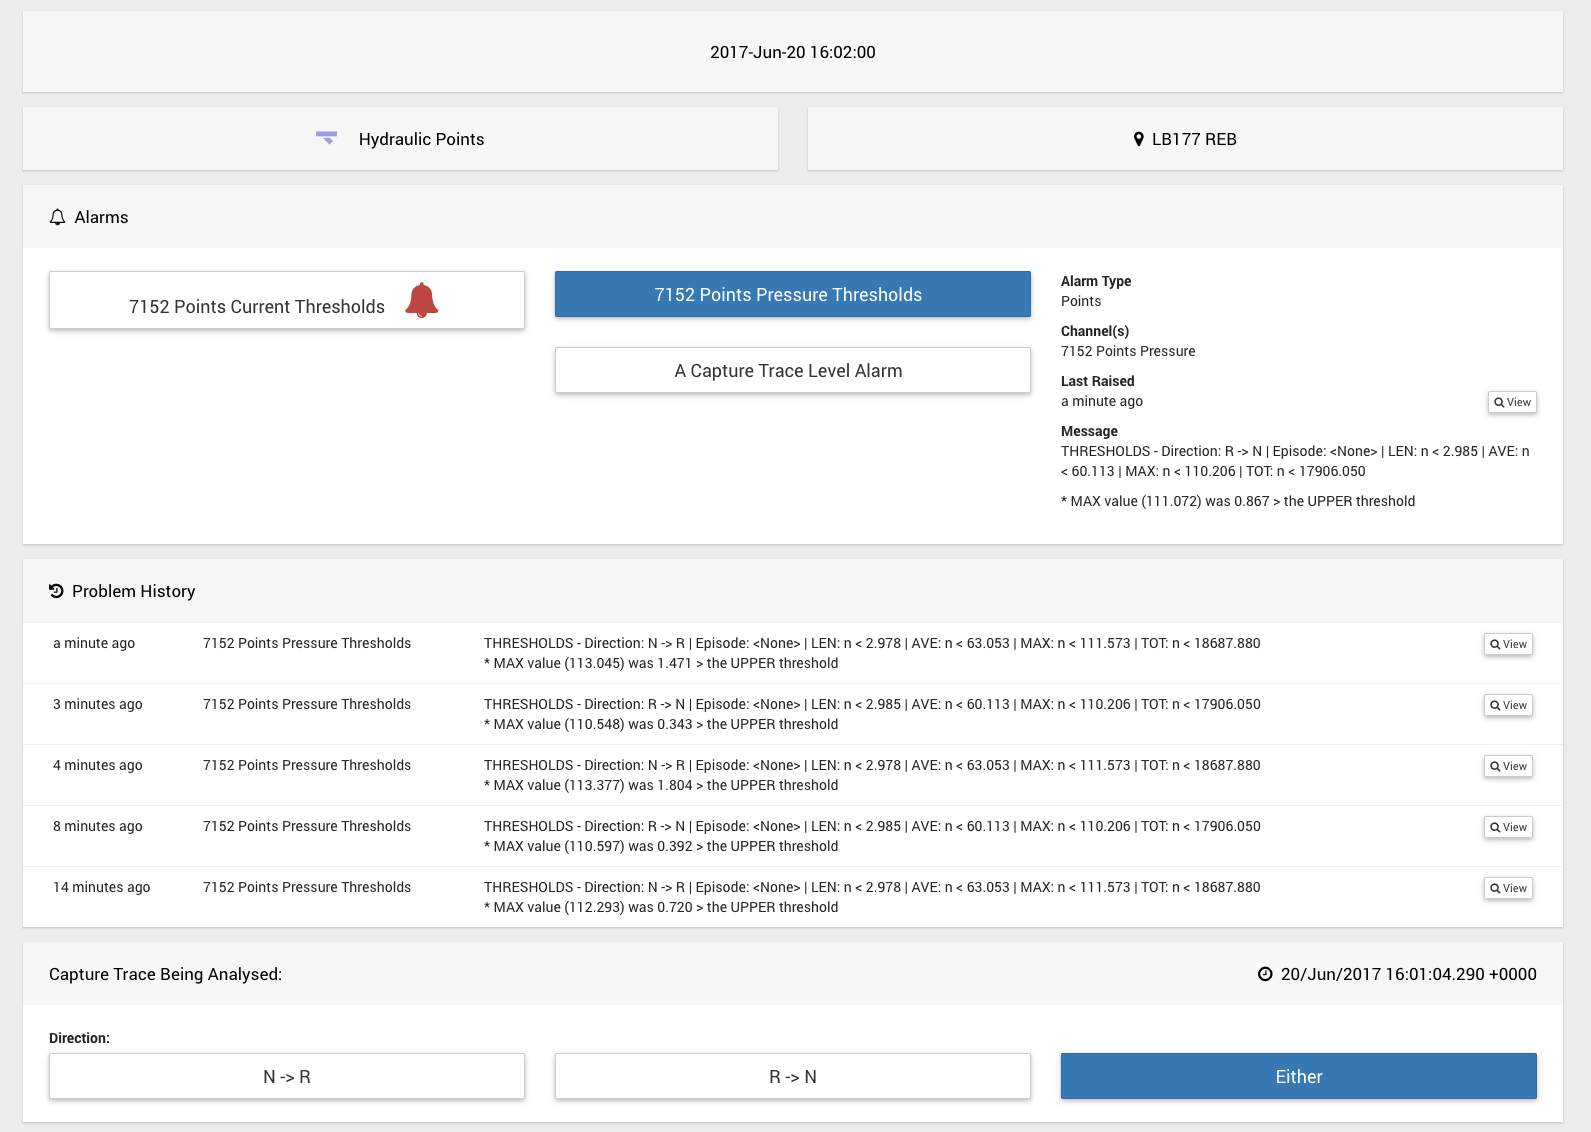
This page displays some key asset details including alarms associated with that asset.
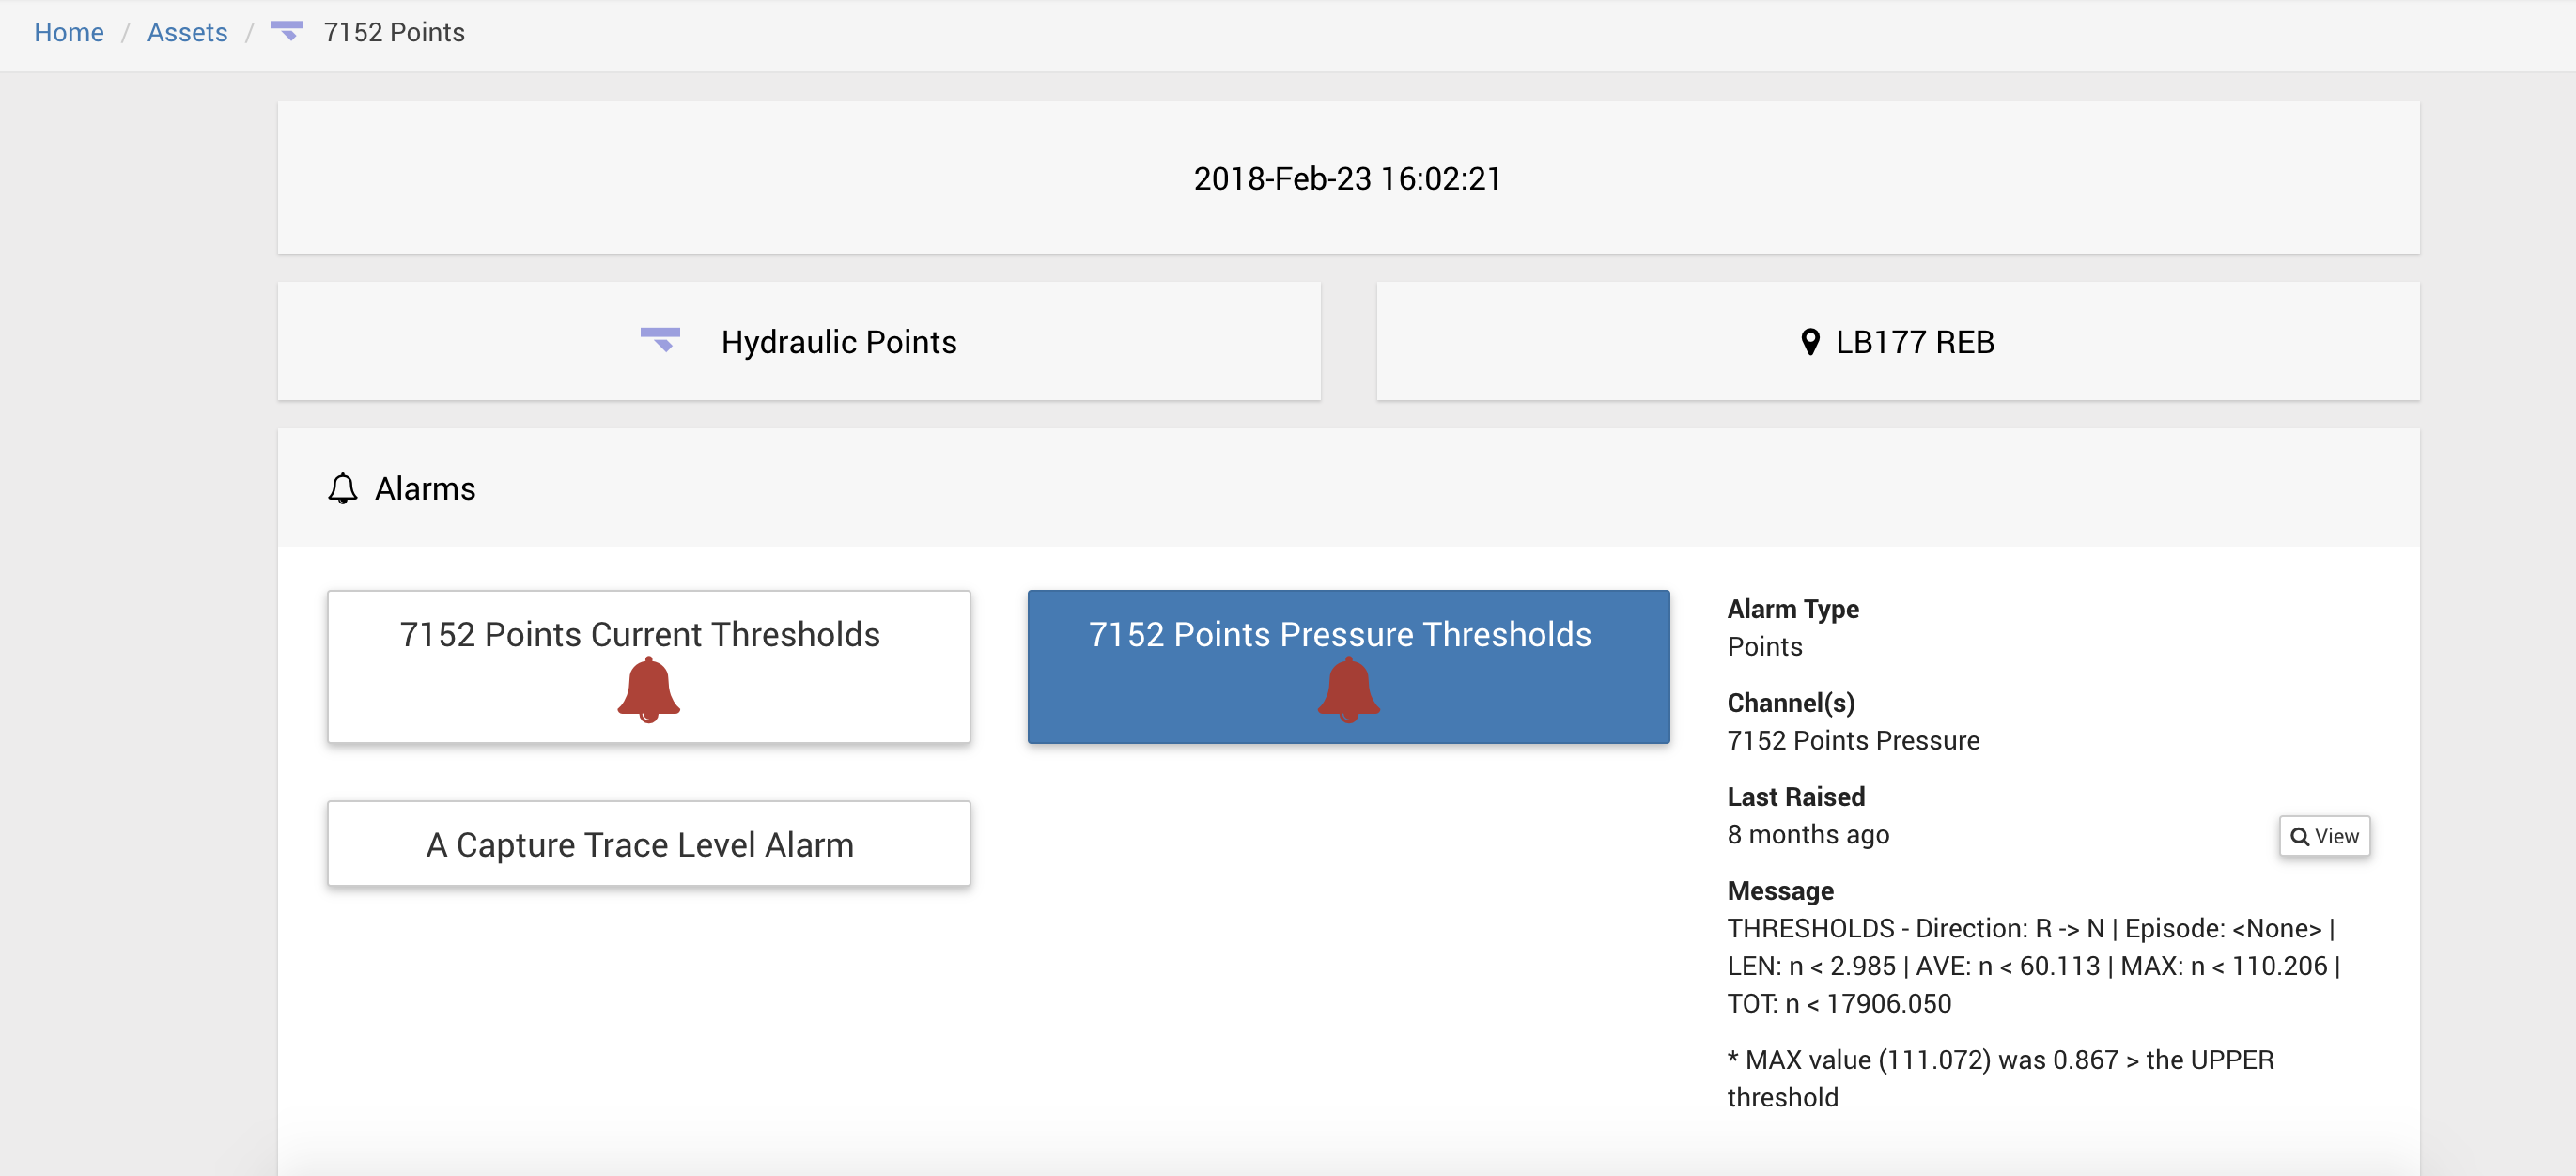
Alarms that are currently active show a flashing red bell icon.
If an asset has multiple alarms associated with it and one or more of those alarms is currently active, then that asset will be automatically selected.
Selecting an alarm shows more details to the right including the time that the alarm was last raised and the alarm raise message if that alarm is currently active.
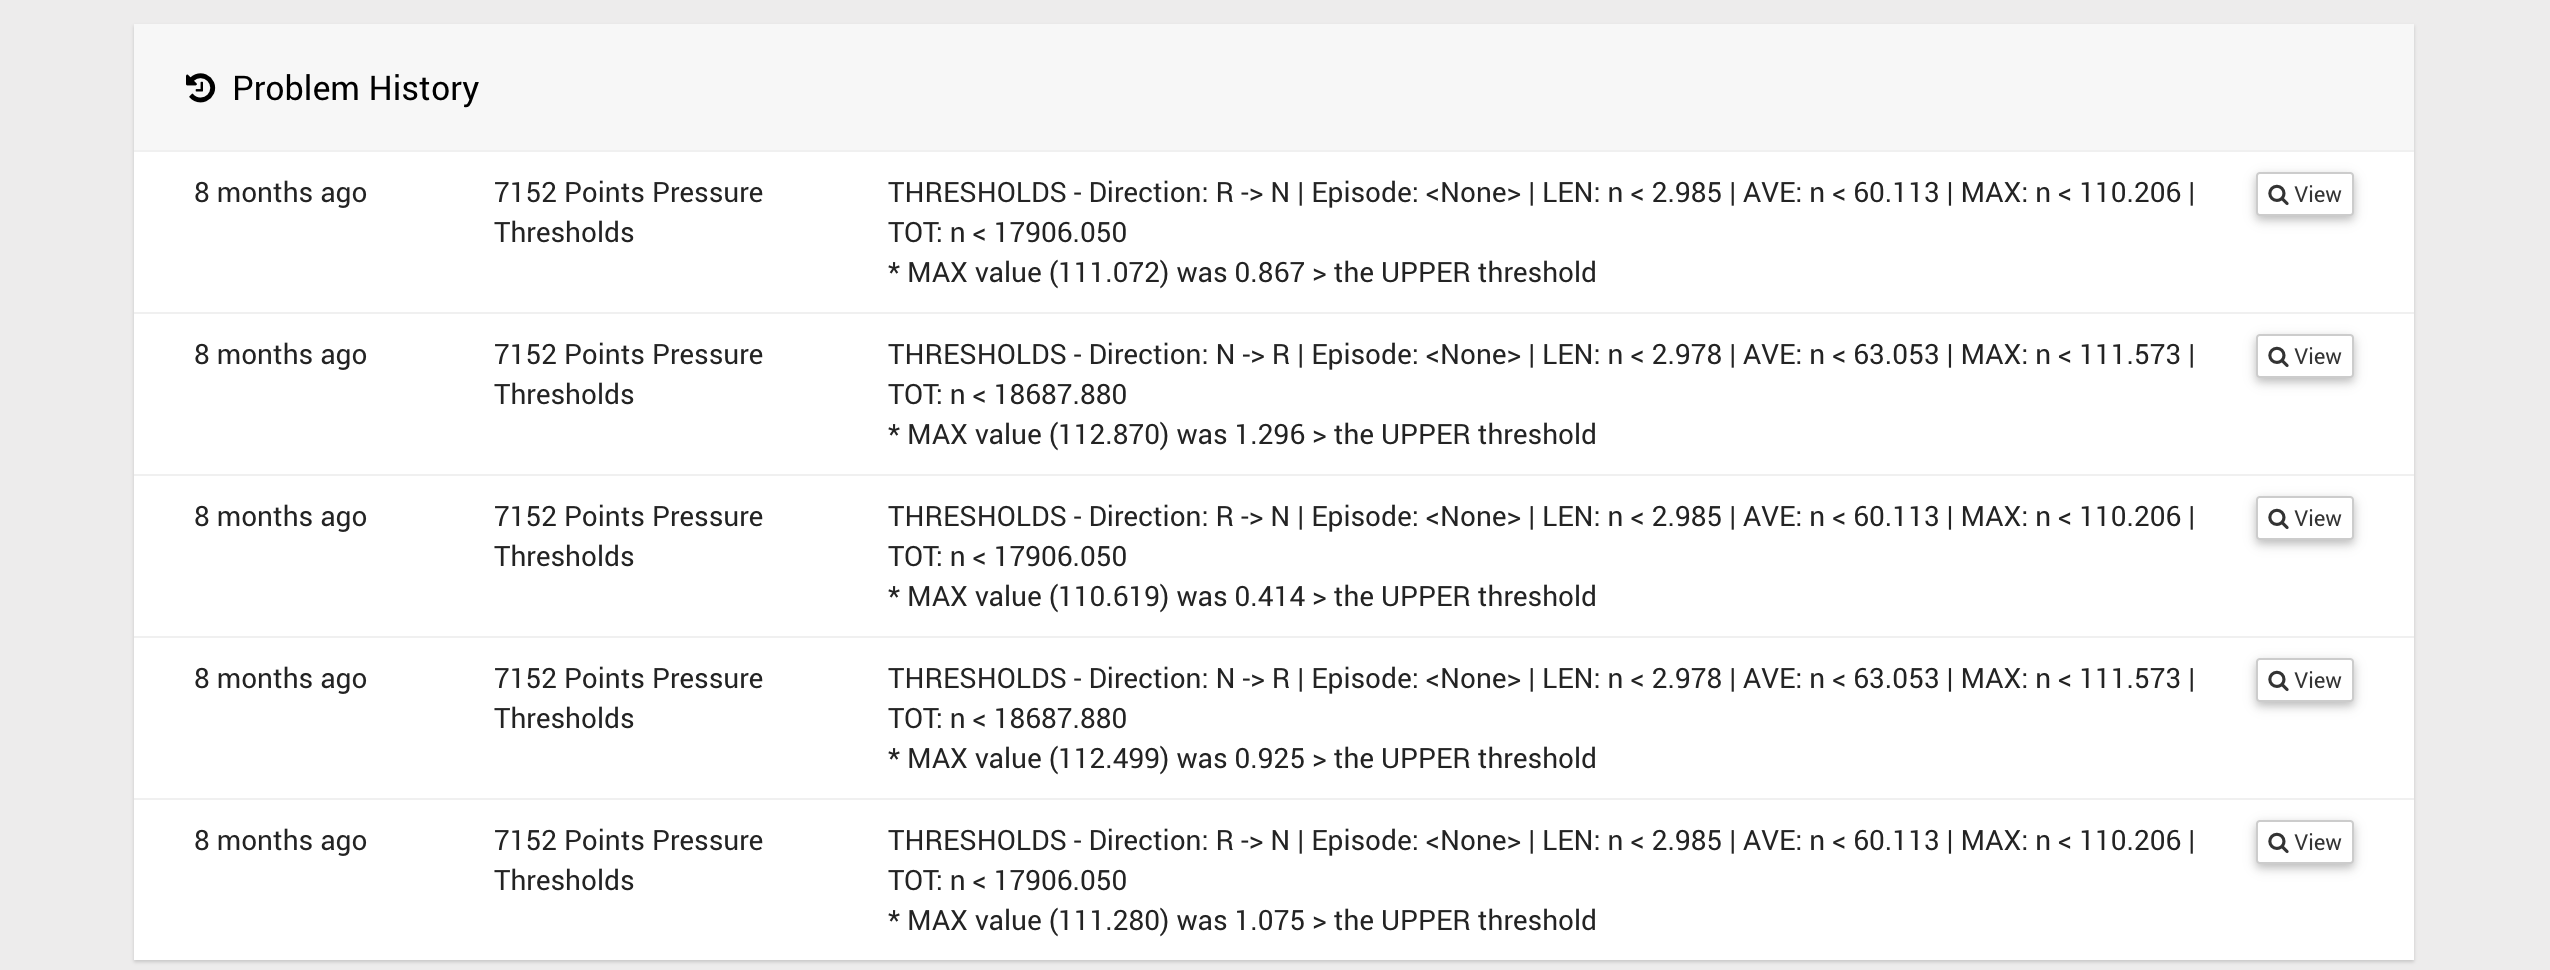
Below the alarms section for that asset is the problem history for that asset. This shows the most recent alarm raises for that asset, which can be from any alarm associated with that asset.
If the alarm selected is raised and has the ability to show graphs for investigating this raise, these will also be shown.
The below figure is an example of what would be shown for a Points Alarm that is currently active.
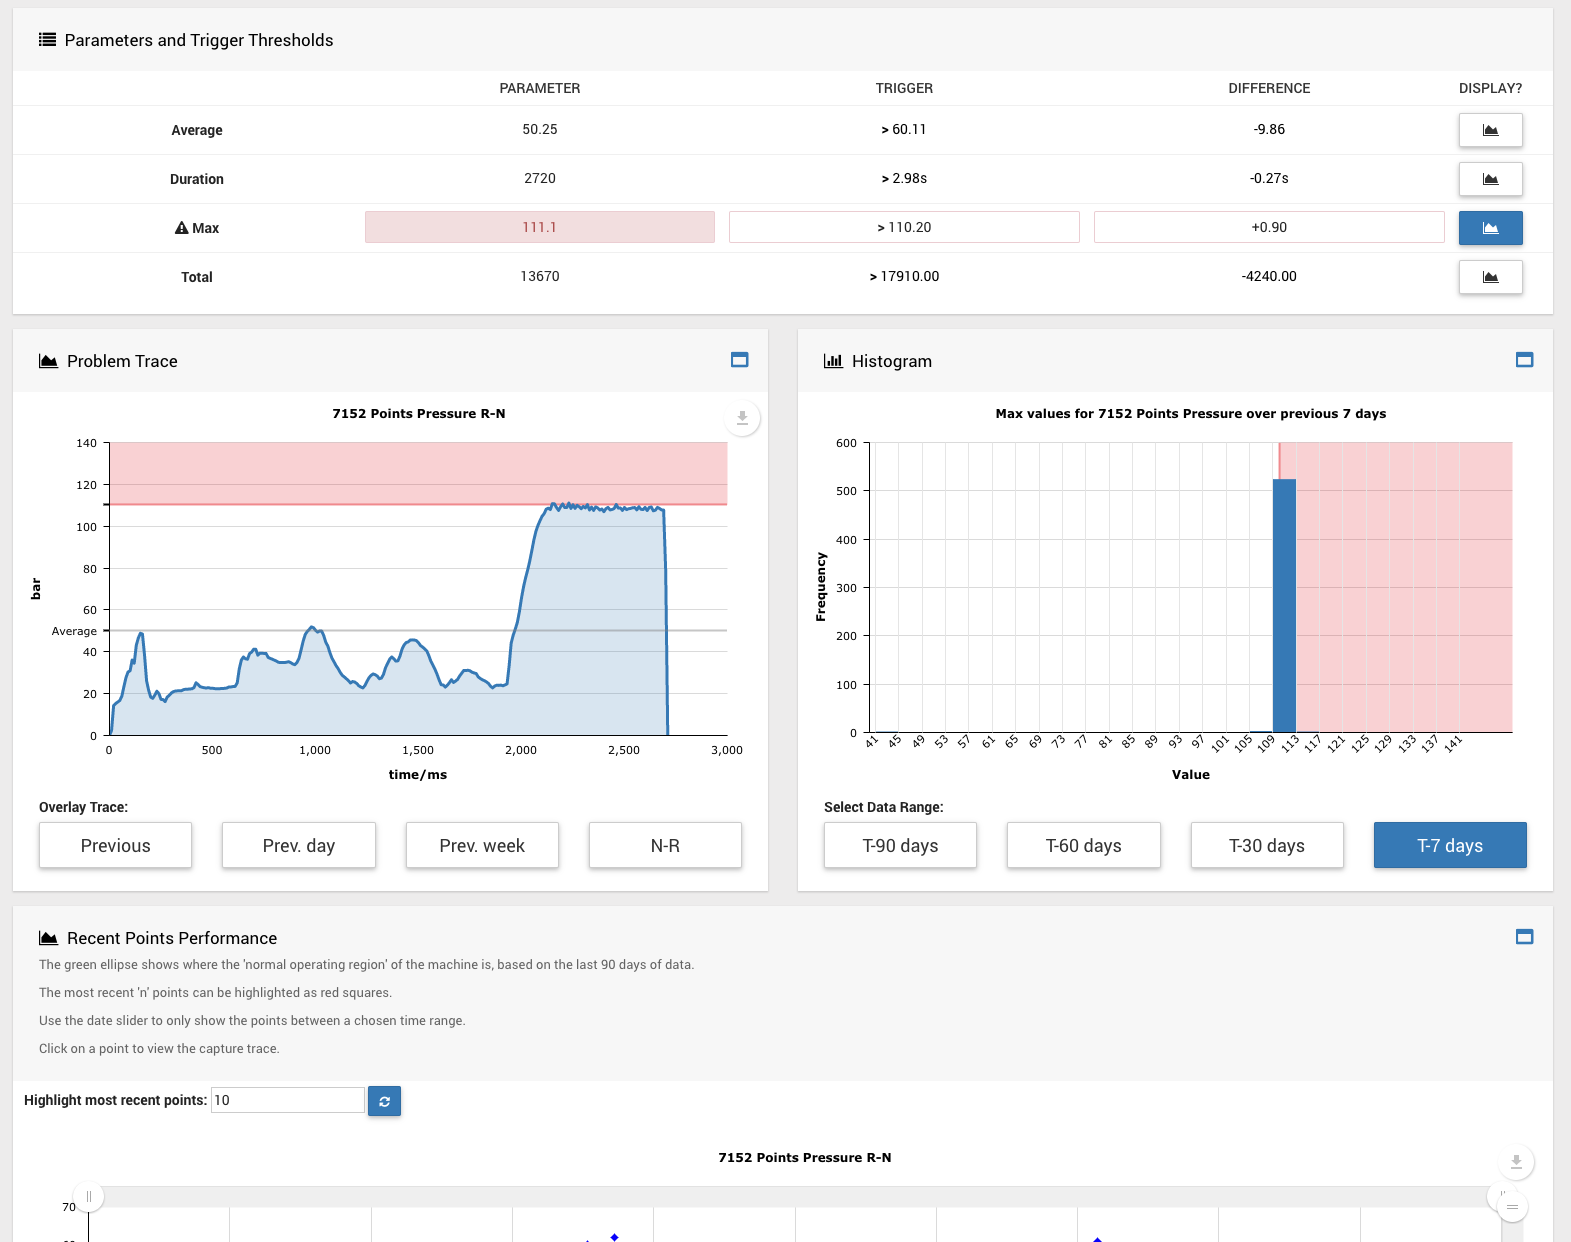
If an alarm is not currently active, then these alarm relevant graphs will still be shown, except that the most recent trace compared to the selected time at the top of the page will be shown.
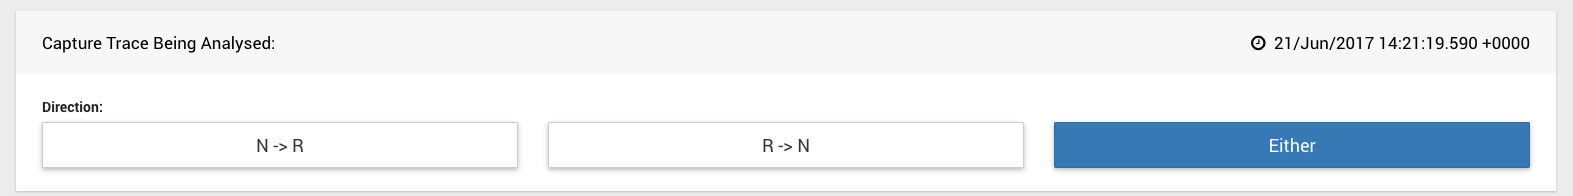
Depending on the alarm selected, filters can be applied to the most recent trace being shown, for example, a swing direction if a Points Alarm is selected.
The selected time at the top of the page can be used to see how the asset looked at a time in the past.
If the selected time is before the currently active alarm time, then the alarm will no longer be shown as 'currently active'.
Similarly, the last raised time, problem history and the extra graphs analysing the most recent capture trace, will all be relative to the selected time.
This means that this page can be used as a 'playback' page for the asset as well as viewing it in its current state.
Health Dashboards can share health groups
Health dashboards can now share health groups - groups of health indications which contain alarms.
A new button has been added to the health dashboard edit screen: 'Add existing group'
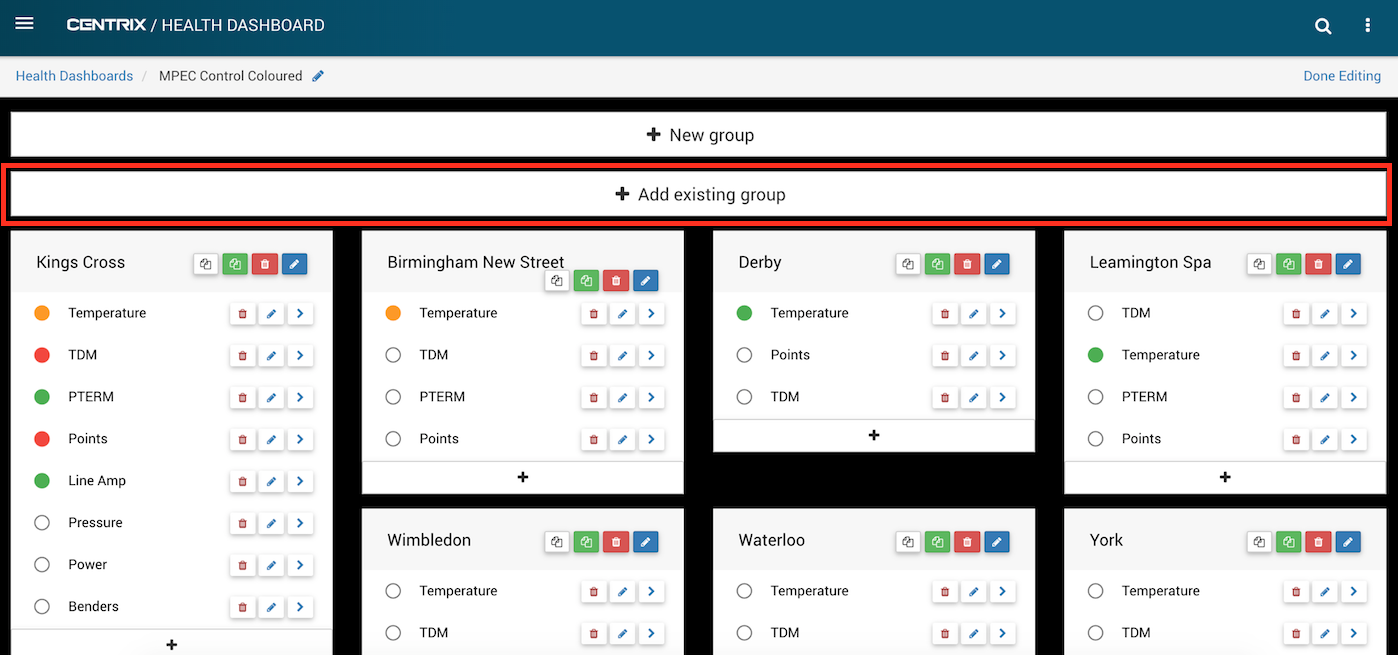
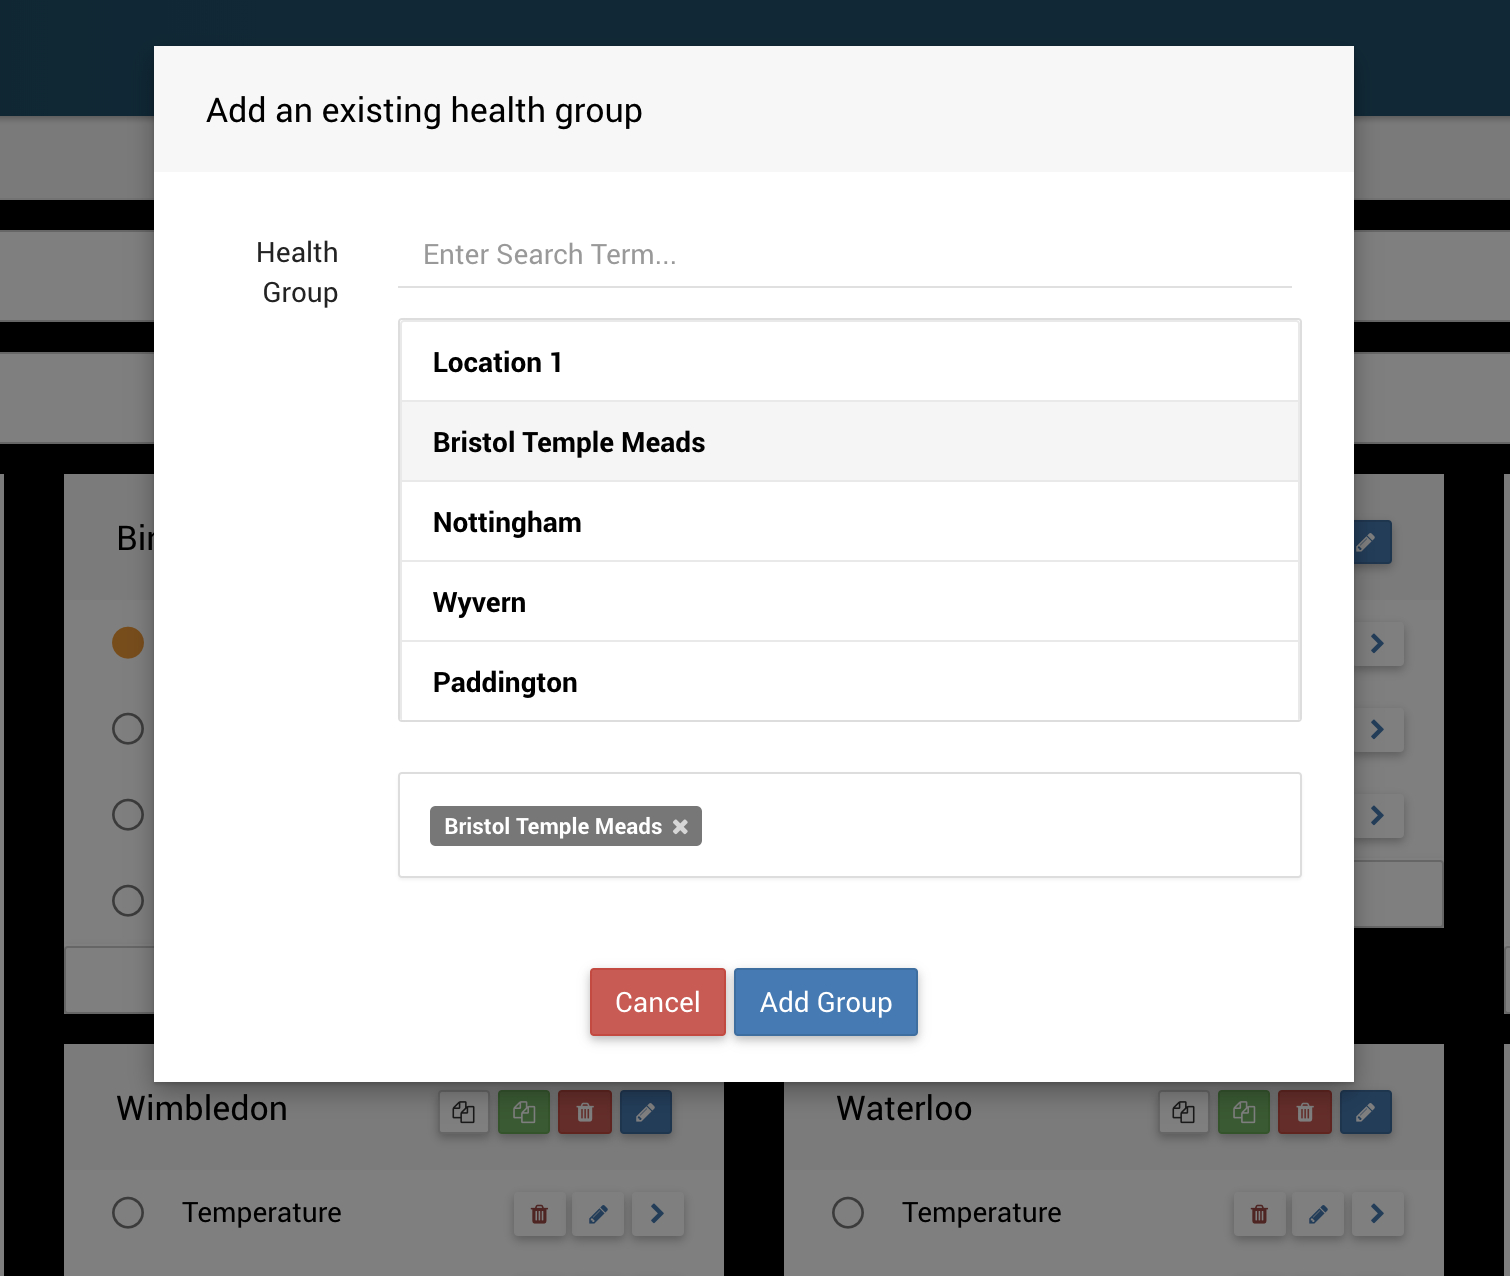
This button allows you to add a health group from an existing dashboard to the current dashboard.
The health dashboard being edited has user groups associated with it.
You can only add a health group from a dashboard which has a user group which is also associated with the current dashboard being edited.
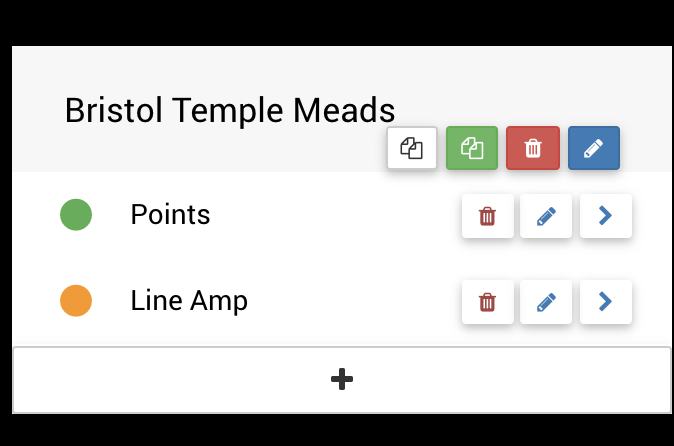
The health group is added with all of the health indications and alarms associated with the health group as it is on the dashboard it has been copied from.
The dashboards share the health group. If a change happens to the health group on one dashboard, this change will be reflected everywhere else the health group appears.
If you delete a health group from a dashboard it will be removed from the dashboard but remain on all other dashboards it exists on.
If it exists on no other dashboards and it is deleted, then it will be fully deleted.
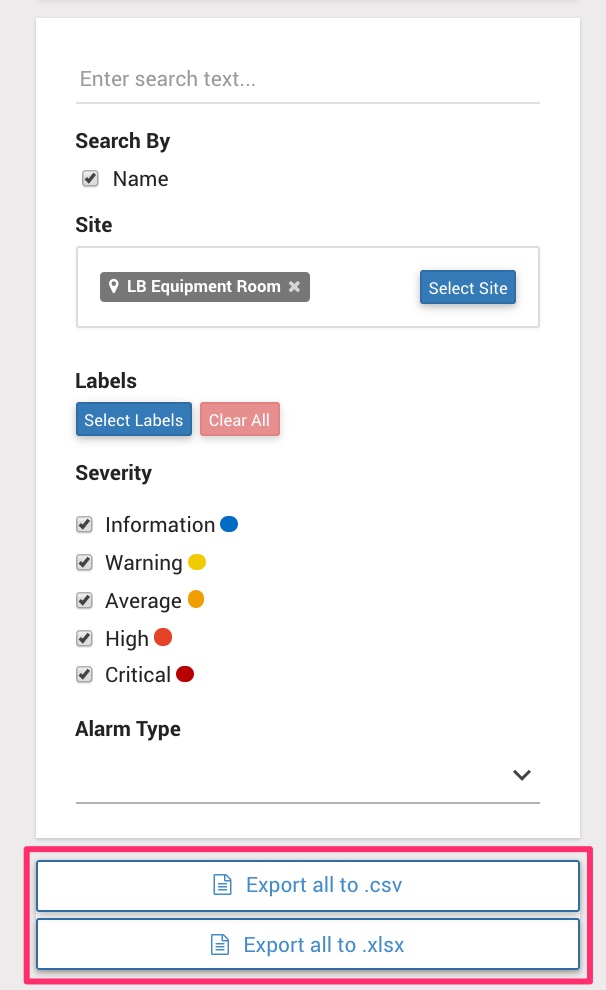
Export Alarms
On the Alarm Management list page you can now export alarms to either csv or xlsx format.
Note: The export buttons will not appear until a Site has been selected.
Filter the list as you would normally, then click the export button for the file type you want. Every Alarm in the list, across all pages, will be exported.
Once one of the export buttons has been clicked, the export buttons will be disabled. If any of the filters are changed, triggering the list to reload, the buttons will be reactivated.
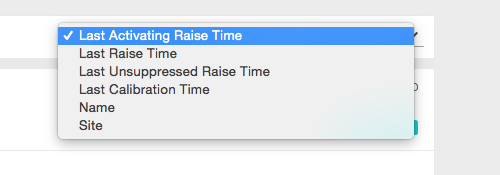
Alarm Sorting
Previous, the Alarm Status page only allowed sorting by "Last Raise Time" which actually sorted on the last "activating" raise time leading to some confusion.
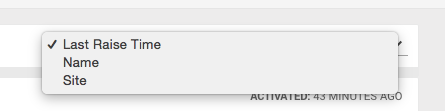
The list of sorting options now includes options for all of the raise times as well as the last calibration time. The previous option "Last Raise Time" has been renamed to "Last activating Raise Time" to reflect the actual field it sorts on.
Digital Channels can be plotted on the inspect channel graph
Previously, only analogue channels could be plotted on the inspect channel graph.
Now digital channels can also be plotted.
All of the analogue channels will remain on the same graph (or 'panel') as they did before.
Each digital channel will have it's own graph (or 'panel') below the analogue panel.
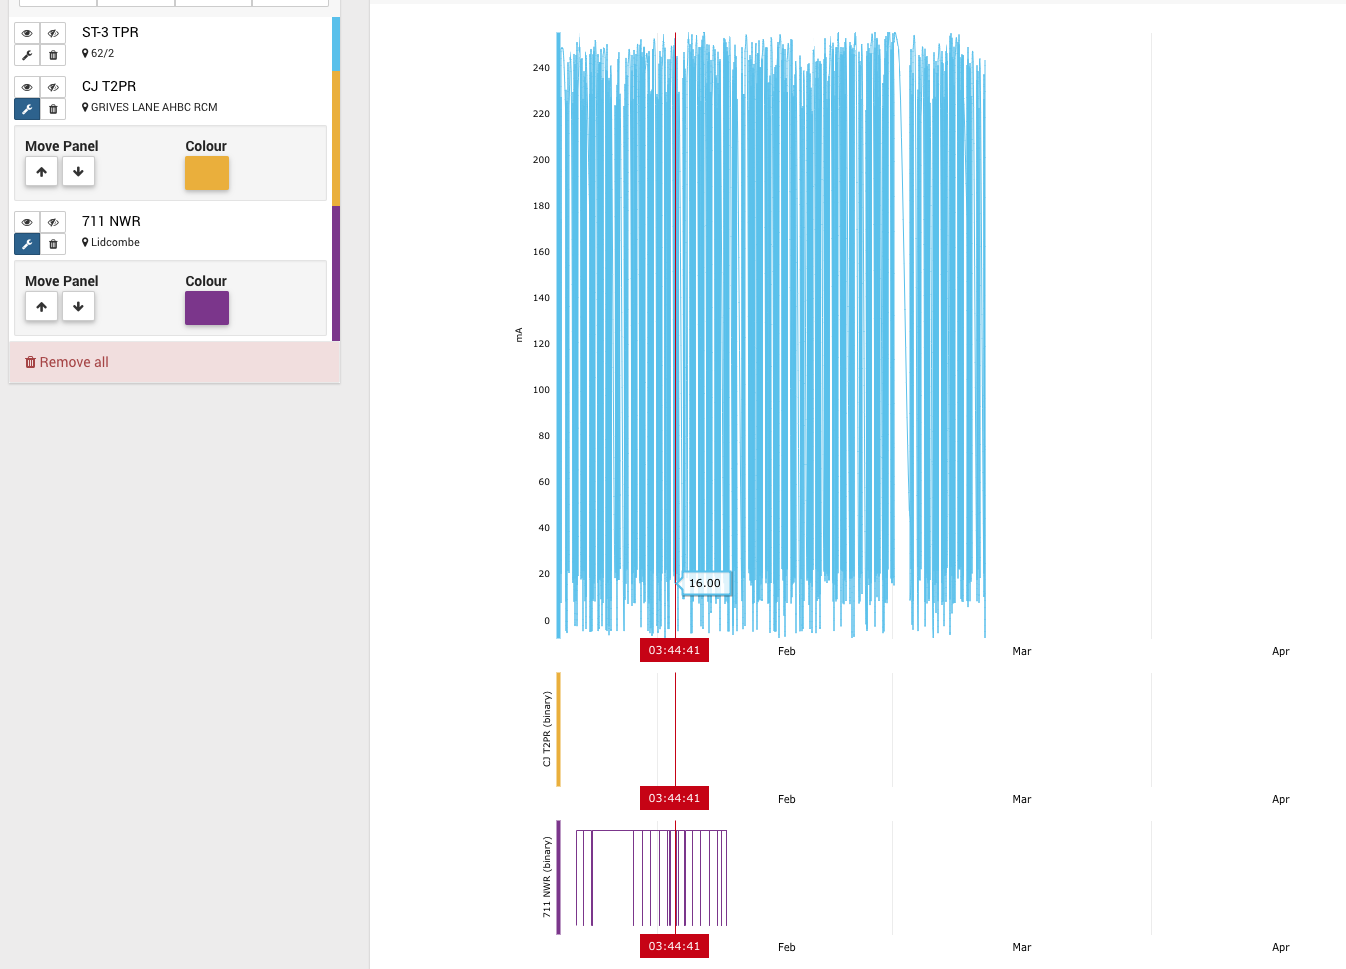
Now that there are multiple panels, each containing one or more channels, these panels can be rearranged.
For example by pressing the up arrow under the move panel option, we can move the purple channel above the yellow one.
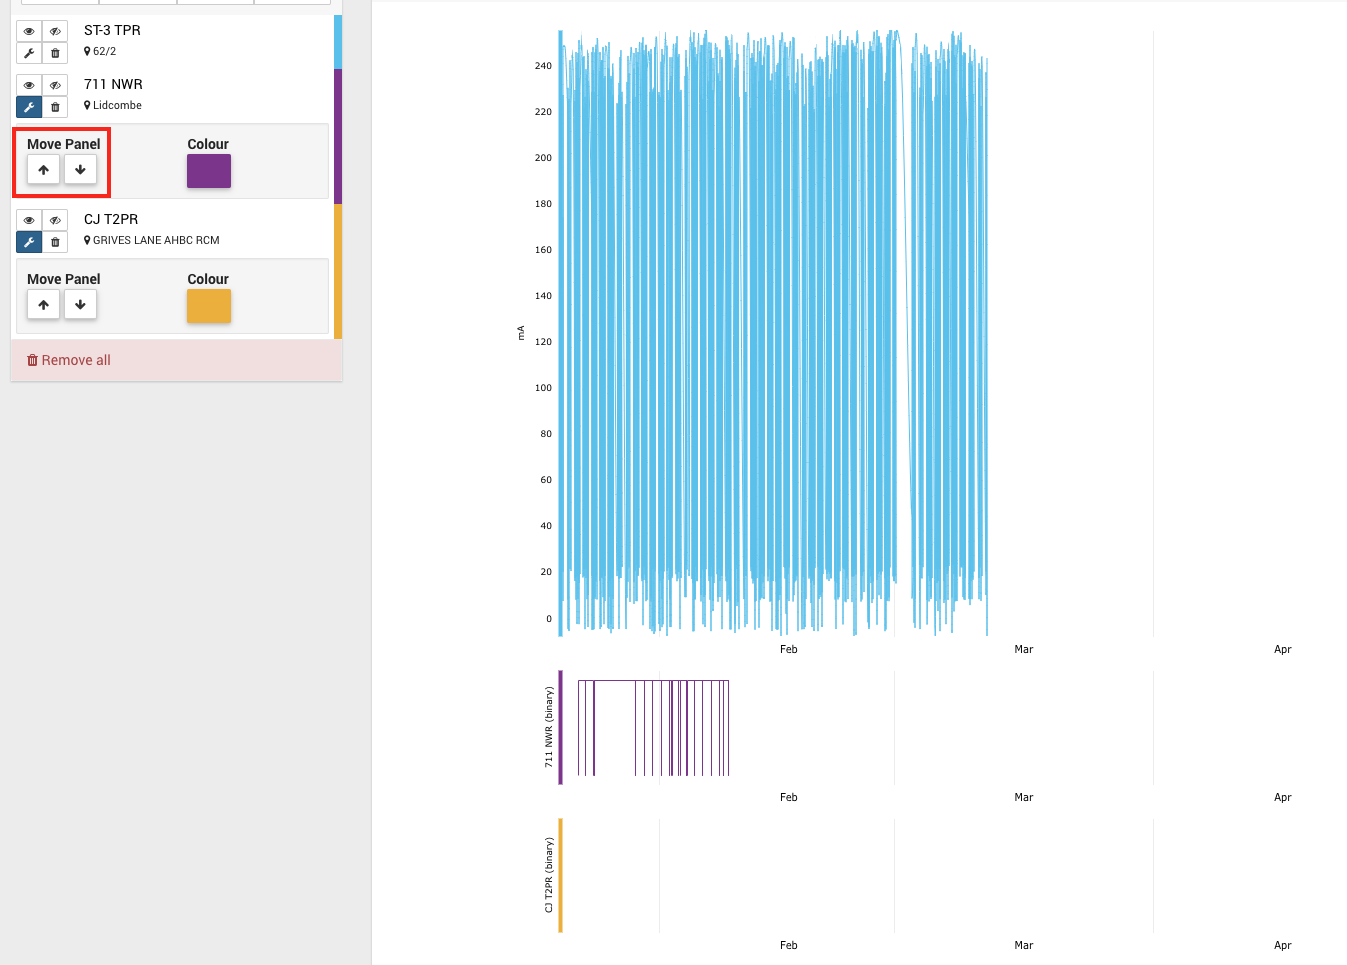
Note that the panel containing the analogue channel data will always remain at the top.
Points Alarm Wizard
Previously, alarms would not be generated for points assets with less than 20 swings for each direction.
The Points Alarm Wizard will now generated alarms for points asset with any number of swings greater than zero. The alarm will be generated with a warning triangle next to it.

By default, none of the warning alarms will be selected, they must be assessed by the user and checked before clicking the Save Selected Alarms button.
Syslog Code Alarm
Syslog Code Alarm is a new alarm in Centrix. This alarm can be created from the Alarm Management page.
When creating this alarm for a site, a site needs to be selected along with one or more Syslog codes. The alarm will alarm will fire when any of the selected Syslog codes are sent from any logger on the associated site.
Minor amendments and fixed issues
- Track circuit flick alarms has the ability to add a lower limit as well as an upper limit.
- Previously, choosing a 'minimum occupation time' of e.g. 3 seconds, would have alarmed on track circuit flicks with a duration between 0 and 3 seconds.
- Now, the lower limit of 0 seconds can also be changed. A track circuit flick alarm can be made to trigger for track circuit flicks between, for example, 0.2 and 3 seconds.
- Alarm Status and Alarm Management lists can be filtered by selecting a site.
- Previously the only way to filter by site was to type the site name into the search box.
- Now a site can be selected from the select tool, this means that alarms can be filtered by site and searched for by name at the same time.
- State Transition Counts reports can now be downloaded to either csv or xlsx format.
- The Assets List can now be filtered by Group.
- Raw Digital Events Report xlsx download:
- Column header Date (UTC) has been changed, the name of the selected sites timezone will be displayed in the brackets e.g. Date (Europe/London).
- Two new columns have been added, Time Zone Offset which shows the offset from GMT, and Unix Timestamp (ms) which shows the 13 digit unix millisecond timestamp.
Bug fixes
- Fixed: Raw analogue events report; 'download .xlsx' produced worksheet without data (column headers only).
- Fixed: State transition counts report; 'Results by Date Group' graphs did not display correctly if there were less than 3 channels.
- Fixed: Track circuit alarm wizard; assets appeared multiple times in the assets list.
- Fixed: Alarm Raises; 'Show Suppressed' hides suppressed alarm raises.
- Fixed: Permission issue when altering groups assigned to a site.
- Fixed: Display of units on graphs when the "raw" units or "display" units were not present but a text version was.
- Fixed: Reduce memory usage when generating raw digital/analogue reports.
- Fixed: Display of units on points performance graph on asset view page.
- Fixed: Track circuit alarm wizard was memory inefficient.
- Fixed: Unable to save changes to an existing Group.
- Fixed: Several minor UI bugs on the Inspect Graph.