Centrix R84 Release Notes
- James Spencer
- Former user (Deleted)
Inspect Graph changes
Displaying outlying data
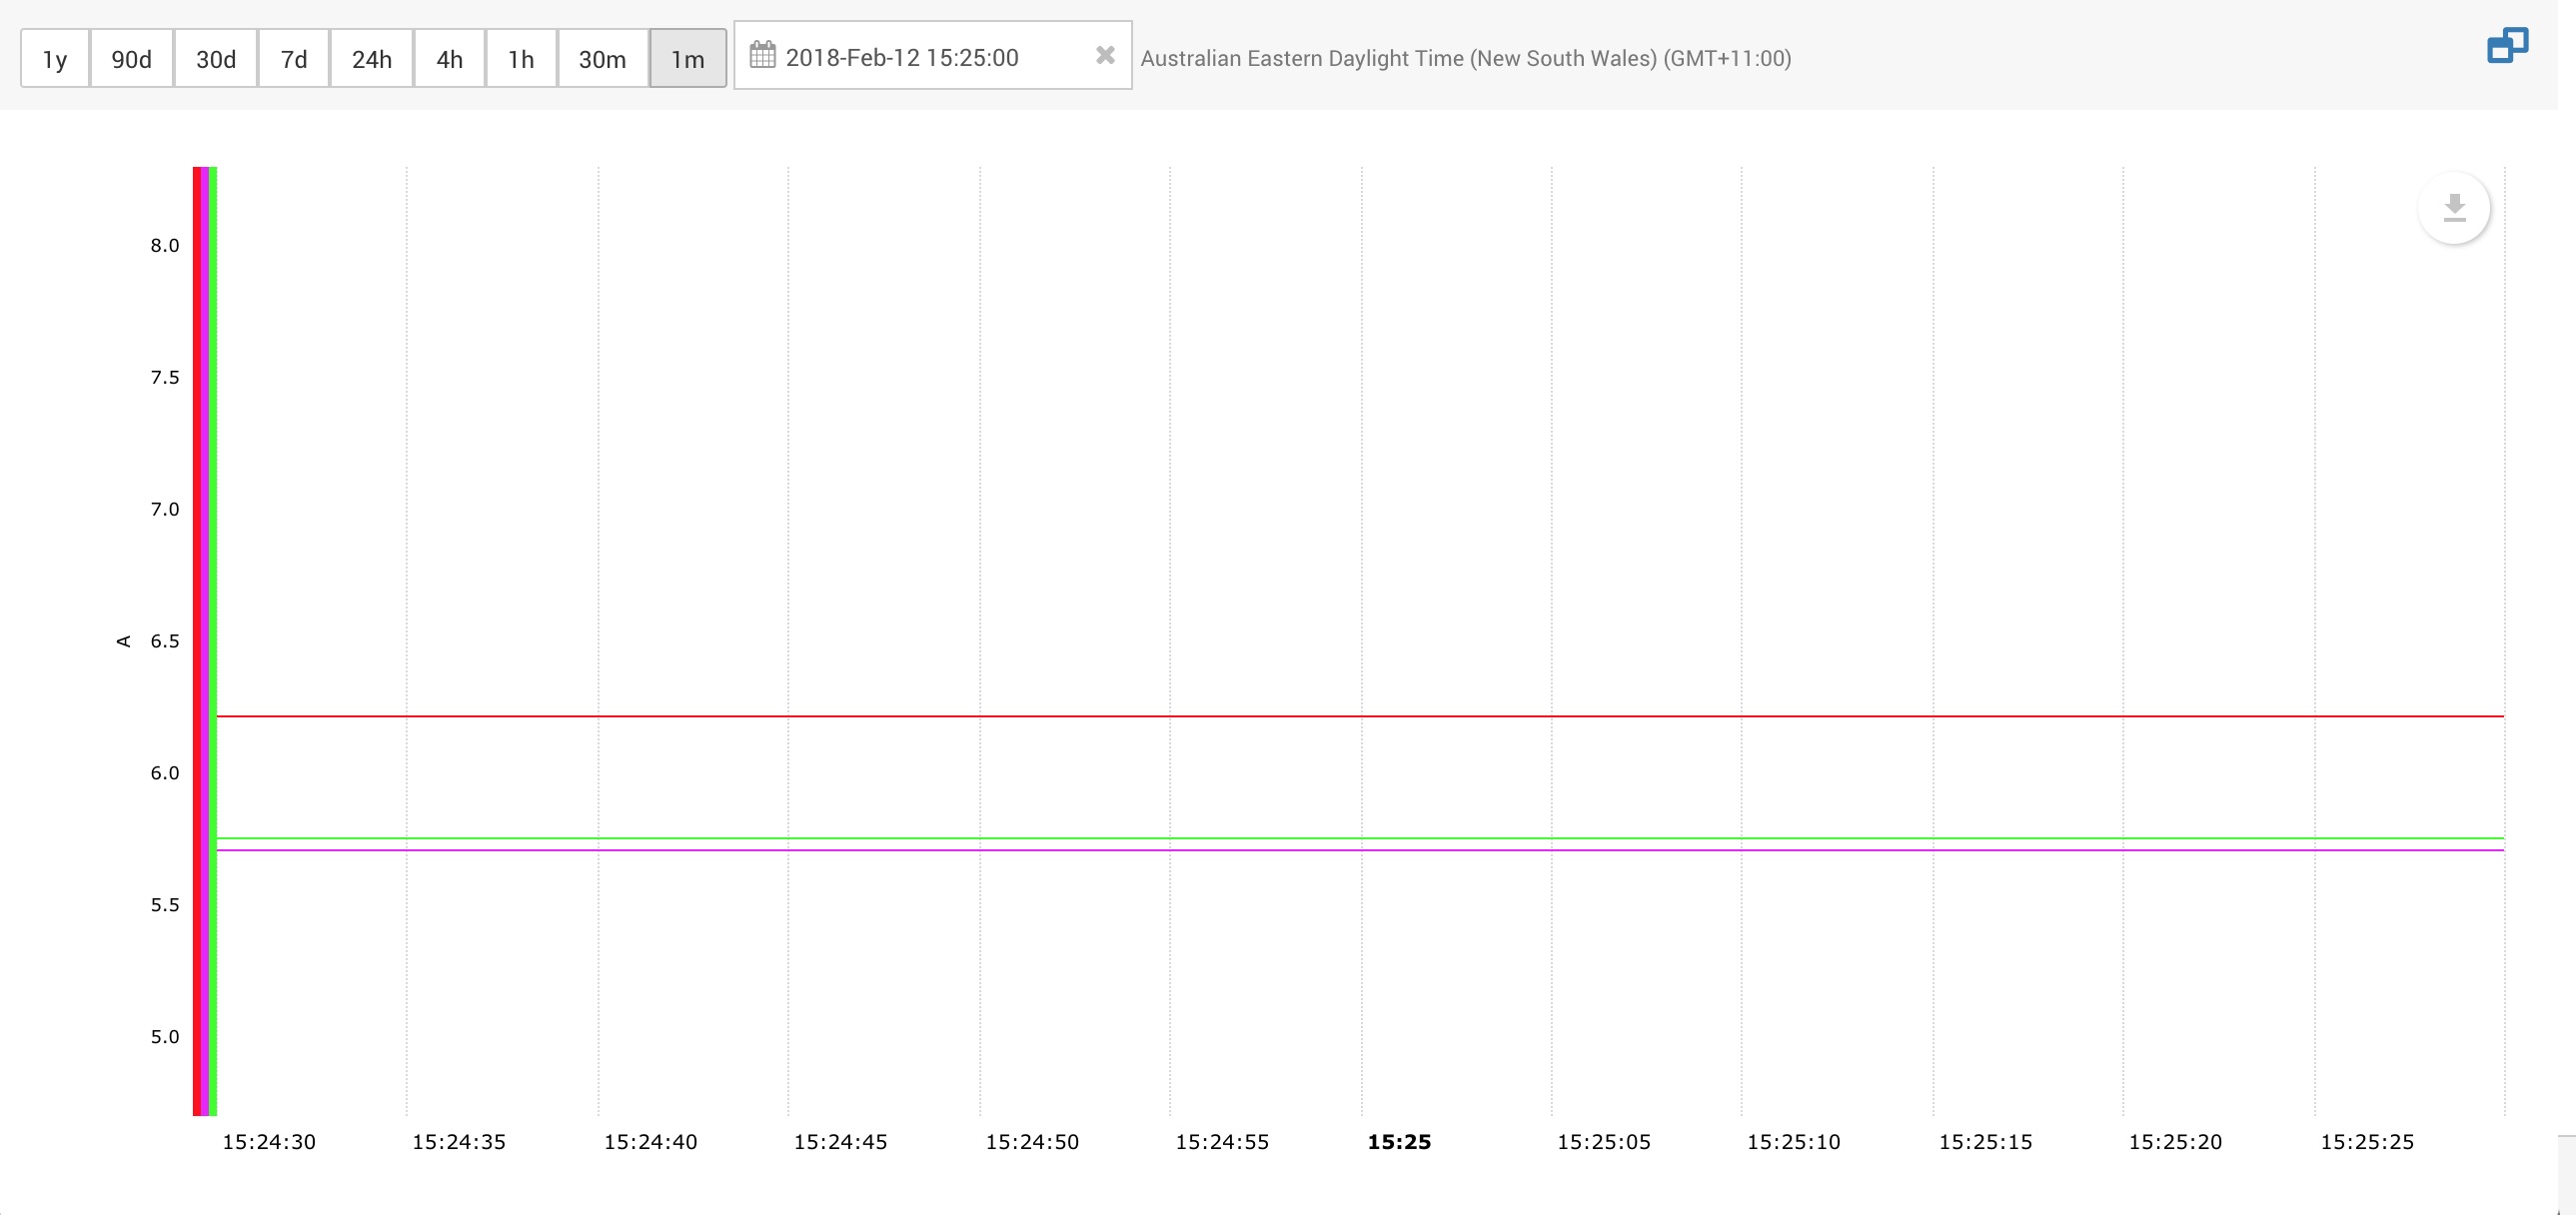
Previously, the inspect graph would only show data for the selected time range, which would result in the graph appearing empty when it should not.
For example, if a selected time range did not contain any data but there were outlying data points on either side of the time range, then the graph would be empty, suggesting there weren't any more data points.
Now the graph will show the line between the previous and next data points, the image below is an example of how this looks.
Capture Channels
Previously, only traces from analogue and digital channels could be displayed on the inspect graph. As of this release, traces from capture channels can also be displayed.
They appear on their own graph / panel just like data from digital channels.
It is impractical to display all the capture channel data on the graph when zoomed out as the timescales of each capture are so short.
Therefore, when zoomed out, a single point is shown per capture trace.
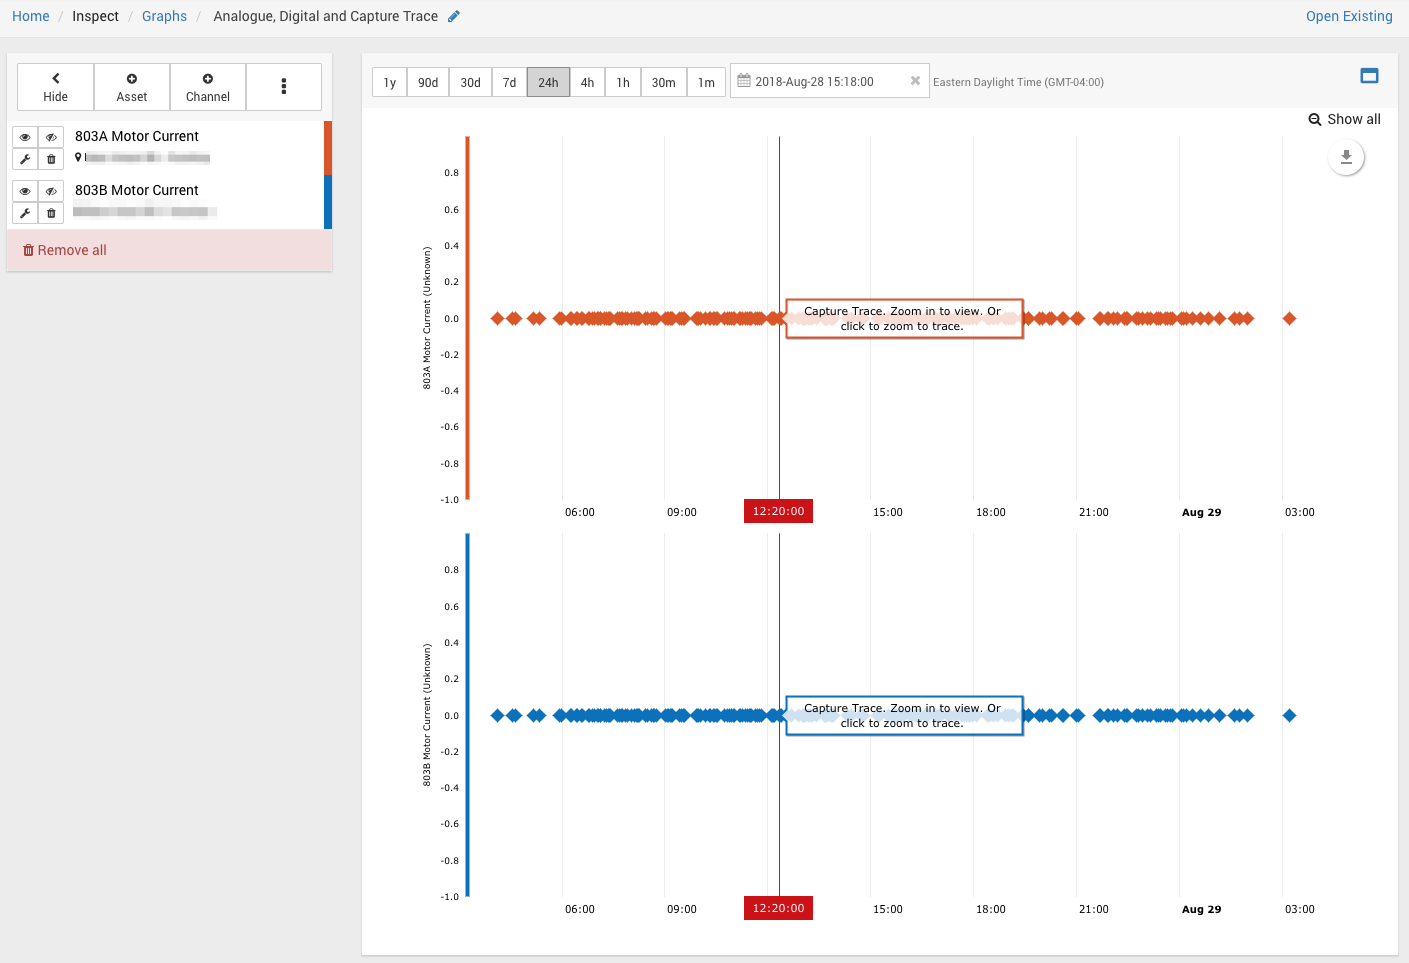
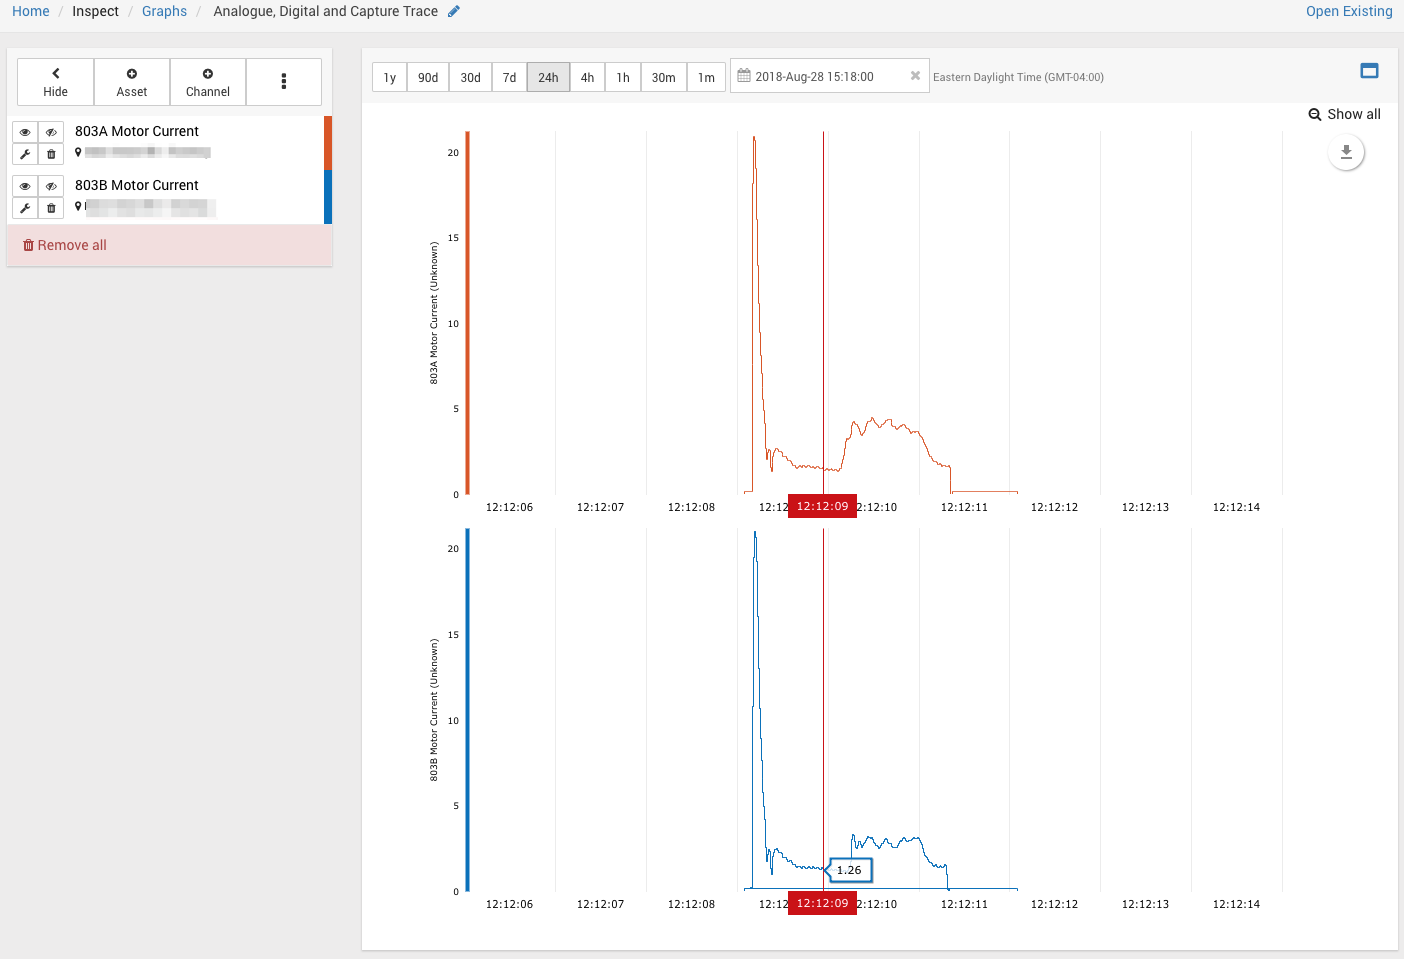
If you zoom in close enough, the actual capture trace data will be shown, rather than the single points.
Also, if you click on the single data point representing the capture trace it will zoom in to the capture trace with some time either side. This allows you to see what other channels are doing before or after the trace.
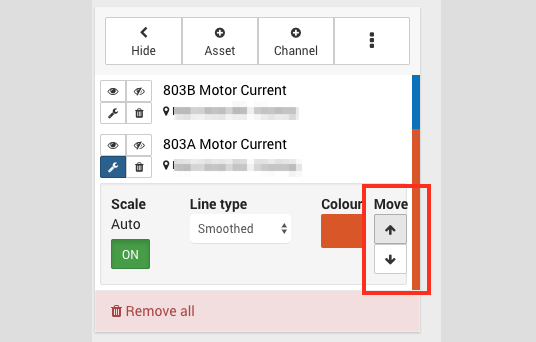
The panels for each capture channel can be moved up and down relative to each other just like the graphs for digital channels can be.
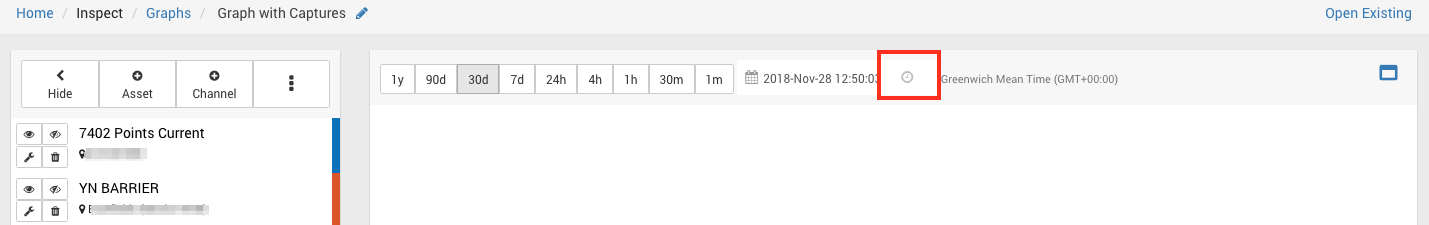
Date Picker has zoom to now button
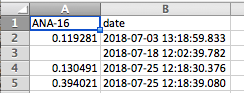
Millisecond precision on data export from graphs
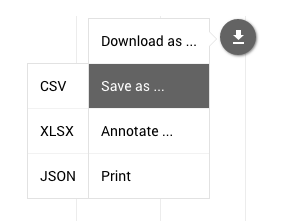
The "Inspect" graph allows the currently displayed data to be exported to a number of formats, previously the timestamps were only showing to second prevision. They now show to millisecond precision.
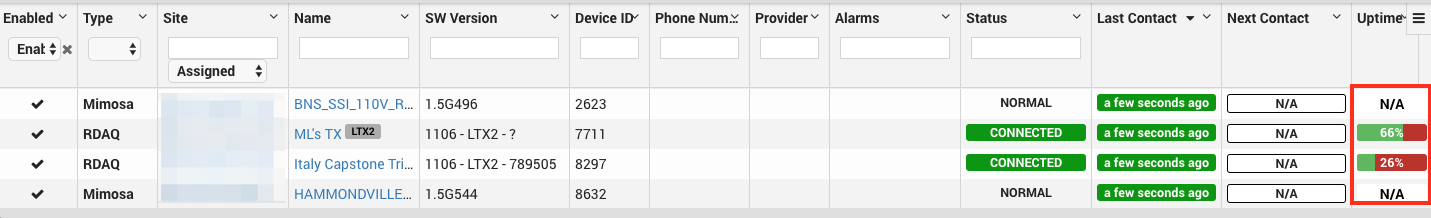
Uptime Statistics for RDAQ loggers
RDAQ loggers (SA380 Push) collect connection statistics when communicating with Centrix, these are now visible on the Loggers page. These may help track down loggers that have potential communication issues such as poor GSM signal strength or network congestions at certain times of the day.
The uptime value is updated every night and shows the logger uptime over the last 30 days.
For non RDAQ Loggers, N/A will be shown:

Inspect Captures
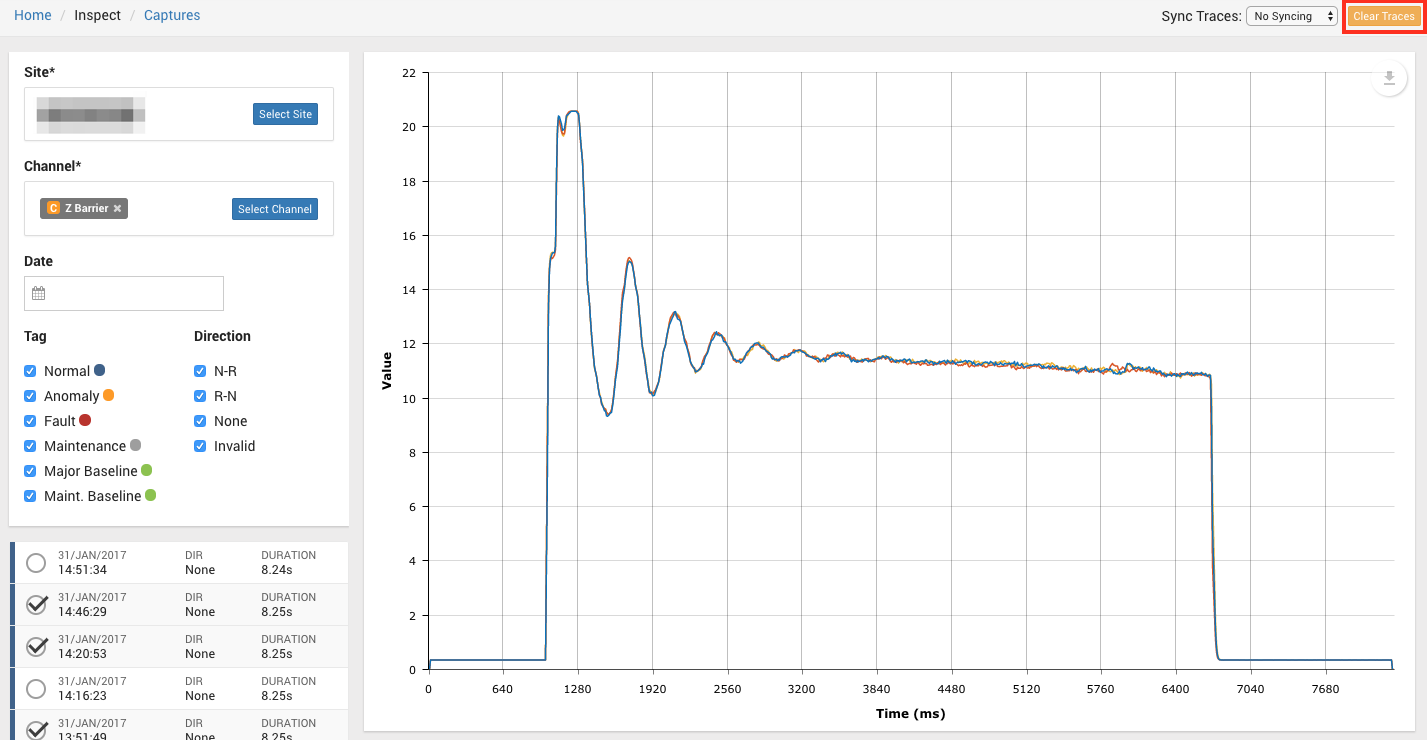
Clear Traces button added:
The button is in the top right corner and can be used to quickly remove all traces and clear the graph.
User Management
Fixed: Groups visible on user list view
Bug fix: groups are visible again in User Admin when viewing a list of users
Disable User
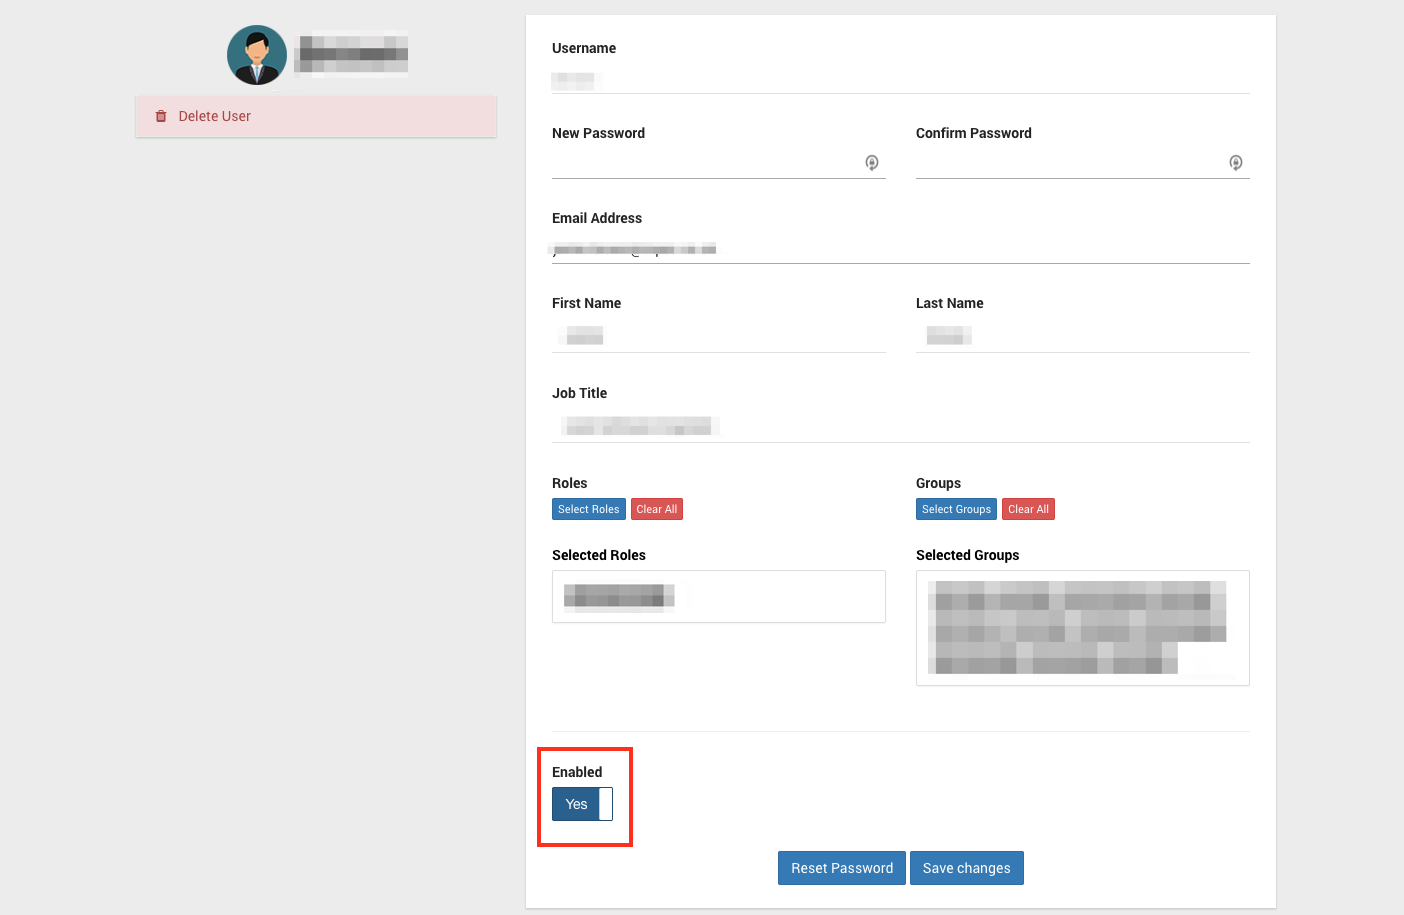
A button has been added which allows you to enable or disable a user.
A user that has been disabled has not been deleted, but will not be able to log in to Centrix until they are enabled again.
Inspect Events
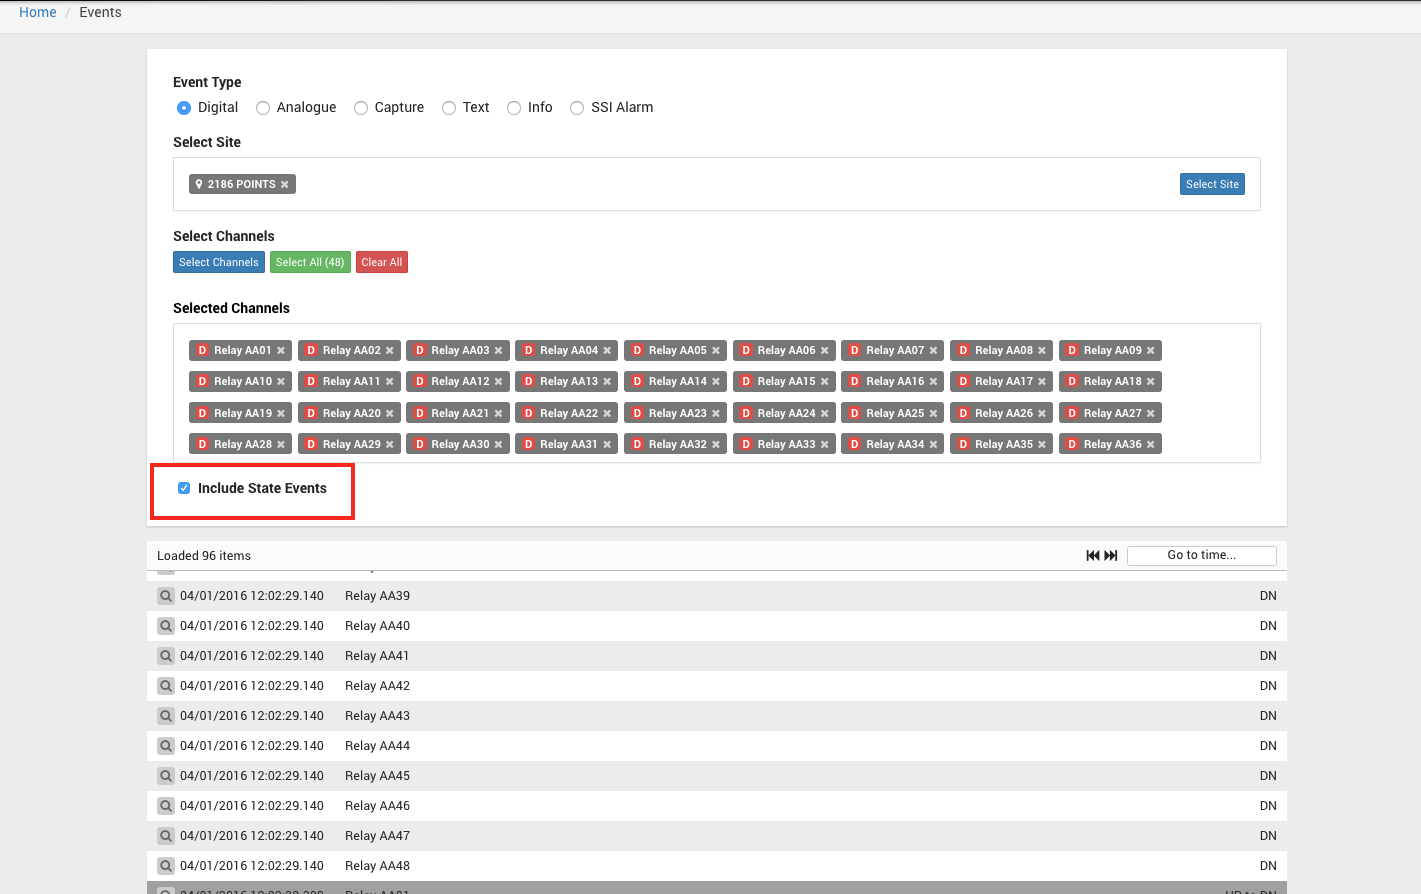
Include State Events Checkbox
For inspecting digital events, a checkbox has been added so that you can toggle whether you see state events.
By default, state events are excluded.
Current Time stored in URL
This allows the url to be shared and the recipient of the URL will be zoomed in to the event closest to that time.
The time is in milliseconds since epoch (1st January 1970)
![]()
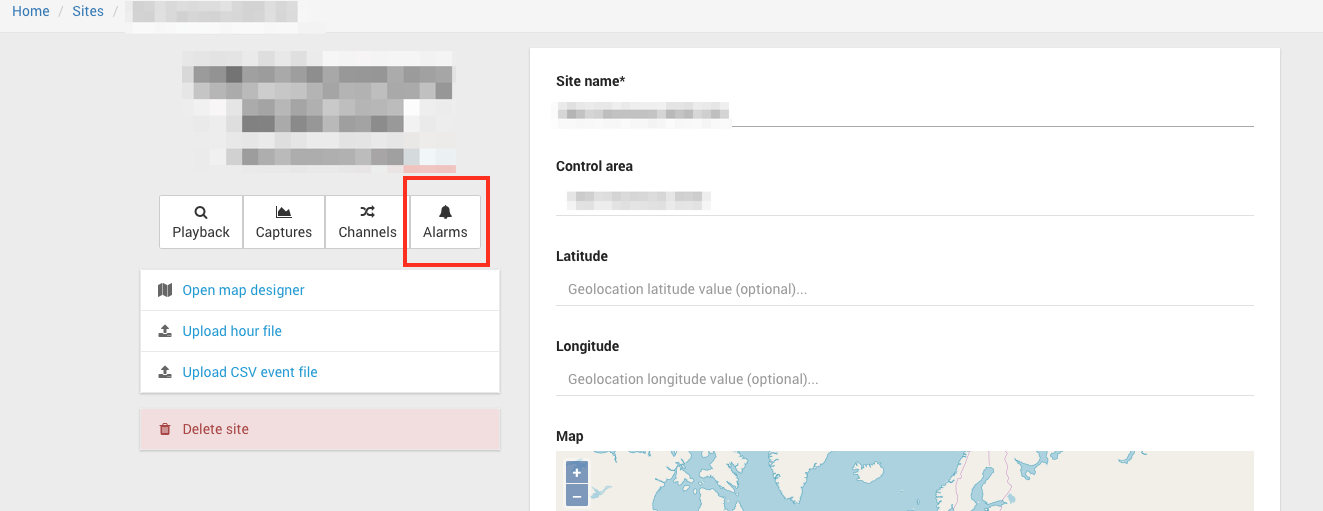
Button to go from Site View to Alarms page
Minor amendments and fixed issues
- When creating a Logger Contact alarm, the suppression period defaults to 24 hours.
- The channel selector on the Channel Change alarm page no longer contains archived channels.
- Added text descriptions for syslog codes 60, 61 and 62 for (related to status of Centrix connectivity).
- Some of the "Sync" options on the Capture graph behaved erratically when the trigger fell outside of the waveform.
- The "Sync to trigger" options are no longer available when showing traces without triggers.
- Paging links at the bottom of item selectors have been fixed, allowing navigation between pages again.
- The "reverted to normal" functionality on logger contact alarms now works correctly.
- Raw Digital/Analogue Reports now show the correct timestamp across all time zones.
- Performance increase to loading alarms on Alarm Status page.
- Map, unmap and remove buttons are disabled for a Mimosa logger that has not been associated with a Site yet.
- Excel dates output as strings rather than timestamps in reports.