Points Swing Count
- Jamie (Deactivated)
Overview
The Points Swing Count report is designed to provide an overview of the number of times points assets move for a given site. The report also breaks down the direction of the movement (N-R, R-N) and captures invalid movements (N-N, R-R).
The results of the report can be used as a basis for maintaining points, or for investigating potential problems with points assets.
Accessing the report
Users of all access level can access this report.
- Login to Centrix
- Click the Reporting tab
- Select Points Swing Count from the left hand side
Running a report
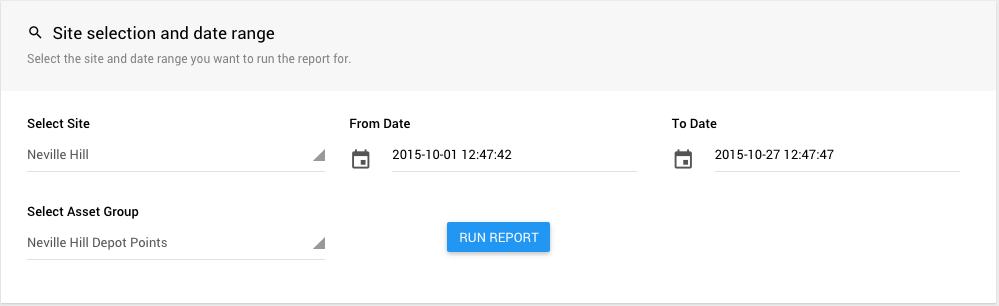
The report requires the following 4 inputs to be provided;
| Site | Site (location) you want to run the report for |
|---|---|
| From Date | Earliest date from which you want to select events for to produce the report |
| To Date | Latest date to which you want to select events for to produce the report |
| Asset Group | Group of assets to run the report on |
After completing the required fields, click Run Report. After a few moments, the results should be immediately returned.
The time taken to run the report will vary depending on the quantity of data being processed. This is effected by the date range selected and the frequency of data for the selected site.
Interpreting the results
The report results are split into two stacked bar charts, one for valid points movements (N-R, R-N) and one for invalid points movements (N-N, R-R).
Reading the charts
The y-axis represents a category for each points asset that belongs to the selected site and asset group.
The x-axis represents the number of movements detected for each points asset. A movement is defined as the loss and gain of detection in any or no direction.
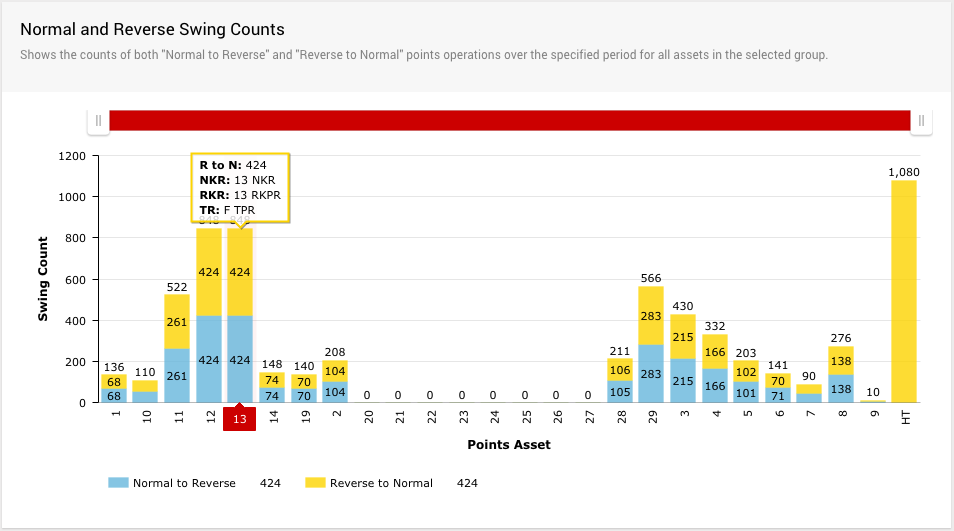
The total number of movements for each points asset is displayed above each stacked column. The column is split between movement counts for each direction, for valid counts these are N-R and R-N, for invalid counts these are N-N and R-R.
The counts for each direction of the stacked bar chart will be shown within the bar if there is enough space. This depends on the number of points assets displayed in the chart, the zoom level of the chart and the size of your display. If the values don't show, you can hover over a bar to inspect its value.
Hovering over any column will show additional information about that data object. This includes; the count, the NKR relay, the RKR relay and the TR relay.

Interacting with the charts
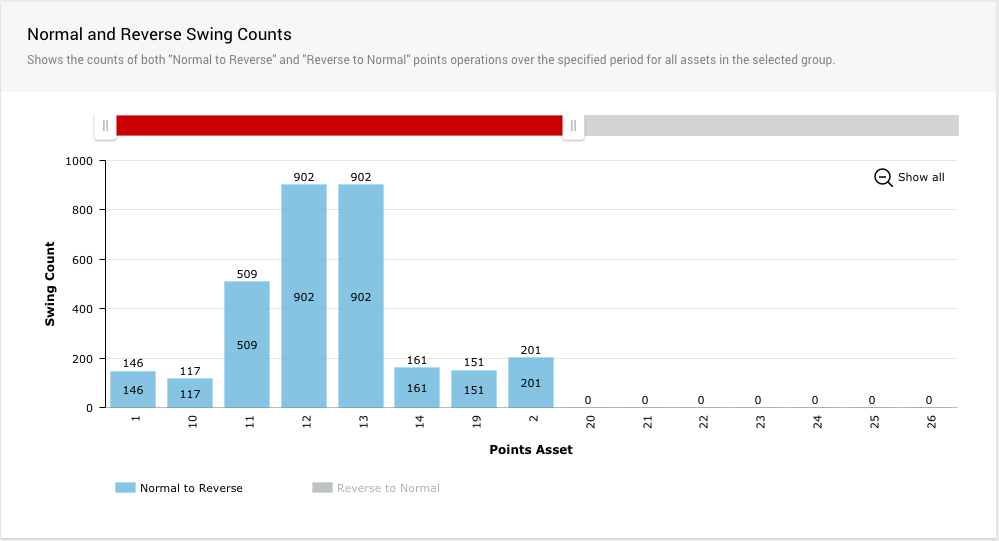
By default, the chart will show all the points assets for the selected site and asset group. You can restrict this view to a subsection of assets by using the scroller above the chart or by clicking and dragging in the chart area around the data you want to zoom into.
To return to the default view, click the Show all button that appears in the top right of the chart after zooming.
The zooming and scroll position of the charts are synchronised so if you change the view of either the valid or invalid chart, the other chart will show the same data area.
You can toggle the columns for each direction on/off by clicking on them on the chart legend. This is useful if you only want to inspect/compare movements in a specific direction.
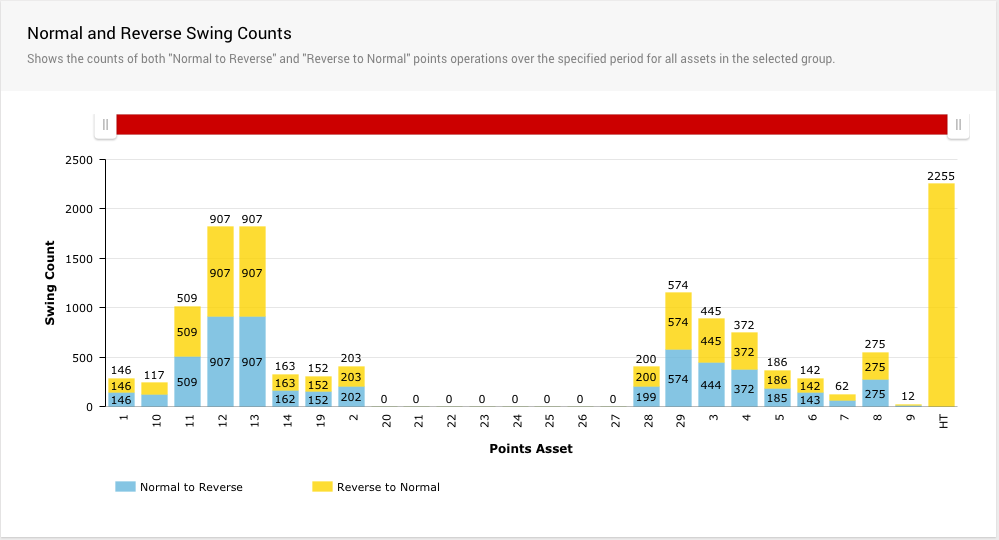
Valid swing counts
This section of the report is designed to show the number of conventional movements of points. A valid movement is defined as the loss of detection in one direction and the gain of detection in the opposite direction. E.g. NKR DN > RKR UP.
Under normal operating conditions, the counts for N-R and R-N for any given asset should be identical.
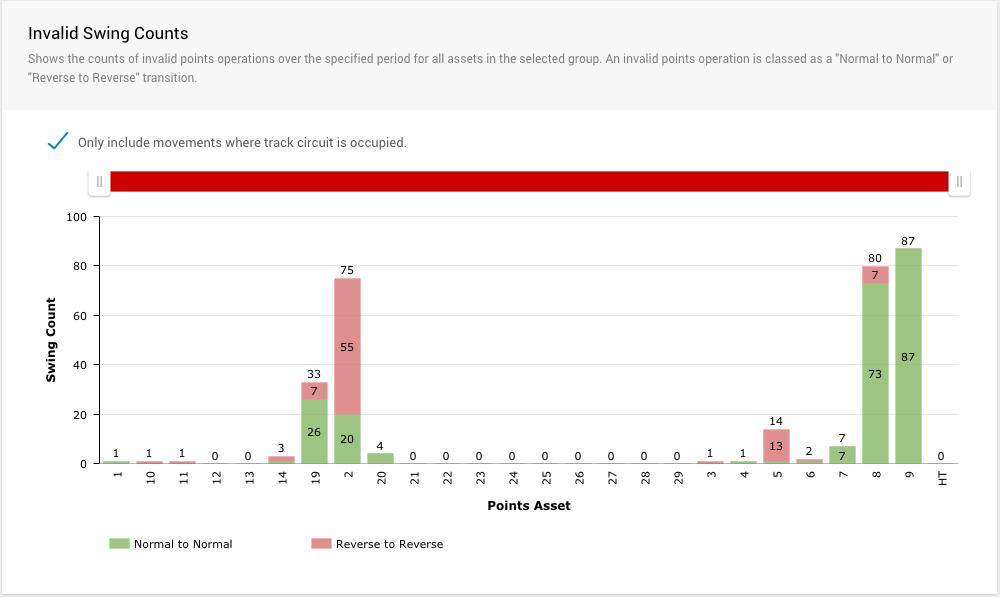
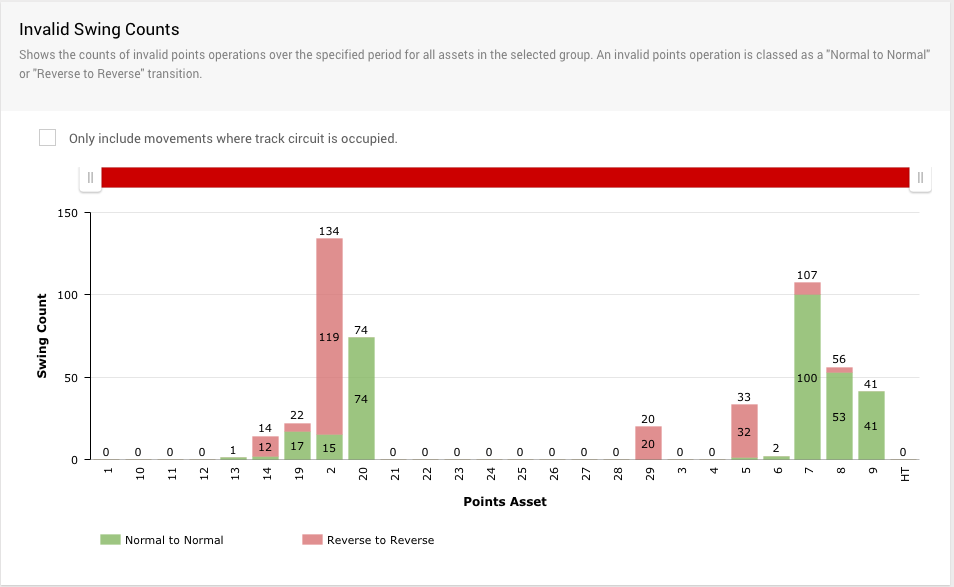
Invalid swing counts
This section of the report is designed to highlight unconventional movements of points. An invalid movement is defined as the loss and gain of detection in the same direction without detection in the opposite direction. E.g. NKR DN > NKR UP.
To counteract likely maintenance, this part of the report contains an option to only include movements where the track circuit is occupied. This means that the movement will only be counted if the corresponding track circuit relay is also down. E.g. TR DN > NKR DN > NKR UP. If the track circuit is not occupied, then the movement will be ignored. This mode is enabled by default, but if you want to count all invalid movements irrespective of the track circuit, simply uncheck the checkbox.
Event data drill down
It is possible to drill down for any points asset to show the event data that was used to calculate the report values. To perform a drill down, click on the column for the points asset you want to inspect the data for. After a few moments the data will appear at the bottom of the report page for inspection.
The drill down is presented as a table of events that have occurred over the given date range for the channels associated with the asset. This includes NKR, RKR and TR operations.
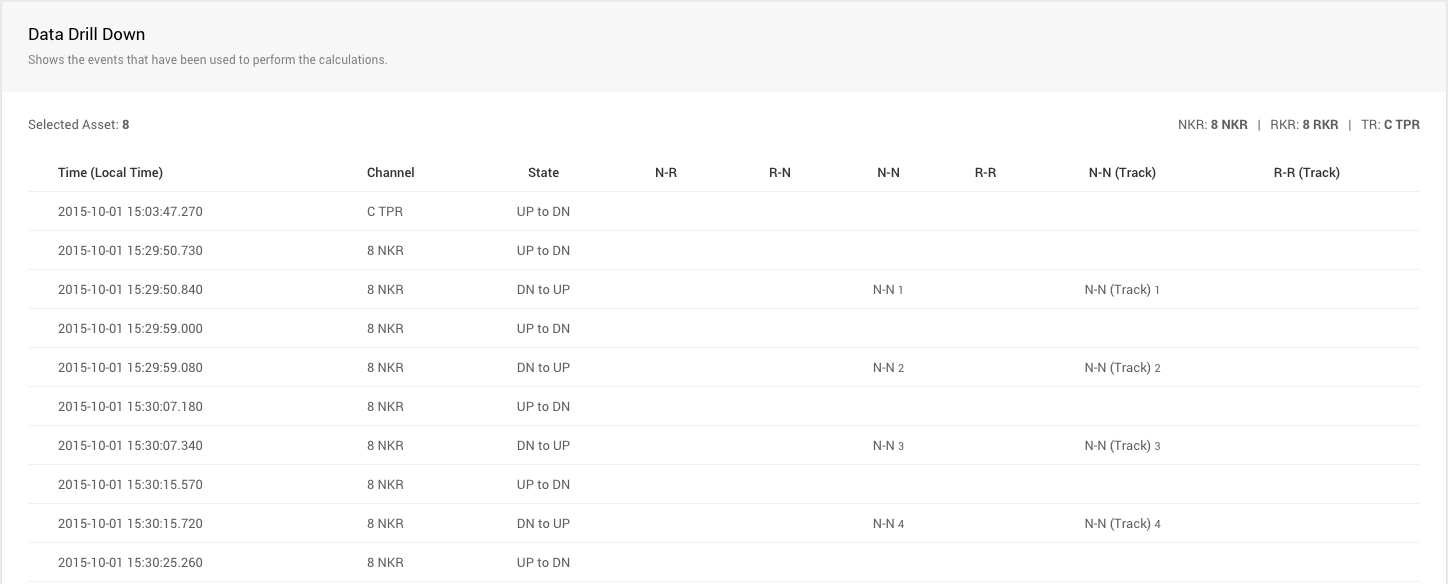
The table is ordered by time (ascending) with one row representing one relay event. The columns are defined as follows;
| Time | Date and time of the event (in your local timezone) as supplied from the data logger |
|---|---|
| Channel | Channel (relay) the event occurred on (NKR, RKR or TR) |
| State | Transition represented by the event (UP to DN or DN to UP) |
| N-R | Displays "N-R" if the event was counted as a valid normal to reverse movement |
| R-N | Displays "R-N" if the event was counted as a valid reverse to normal movement |
| N-N | Displays "N-N" if the event was counted as an invalid normal to normal movement (with or without track occupation) |
| R-R | Displays "R-R" if the event was counted as an invalid reverse to reverse movement (with or without track occupation) |
| N-N (Track) | Displays "N-N (Track)" if the event was counted as an invalid normal to normal movement (with track occupation) |
| R-R (Track) | Displays "R-R (Track)" if the event was counted as an invalid reverse to reverse movement (with track occupation) |
The table also shows a running value for each of the counters (N-R, R-N, N-N, R-R etc), so next to each occurrence of these movements an incrementing value will be displayed.
Logic table
This table shows how the report determines specific conditions for counts.
| TRANSITION | TO | |||
|---|---|---|---|---|
| FROM | Gain Normal | Loss Normal | Gain Reverse | Loss Reverse |
| Gain Normal | X | - | X | X |
| Loss Normal | N -> N* | X | N -> R | X |
| Gain Reverse | X | X | X | - |
| Loss Reverse | R -> N | X | R -> R* | X |
X = bad transition | * will also check status of track circuit and maintain 2 counters