Centrix R12 Release Notes
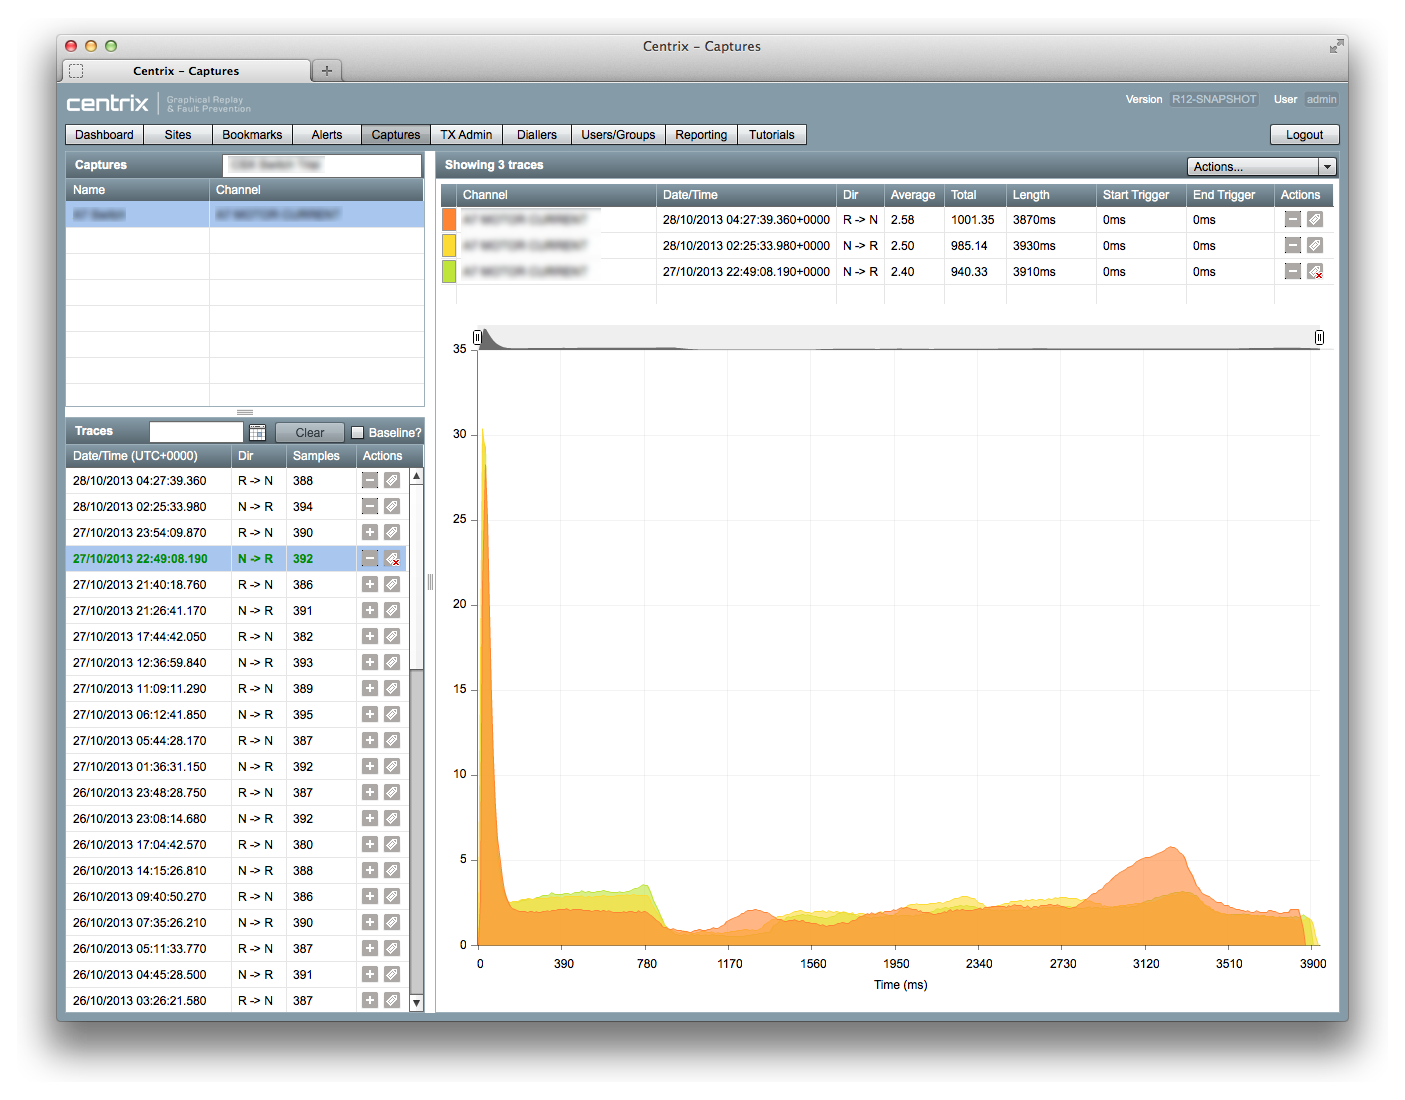
To add a trace to the current graph, click the [+] icon from the Traces panel on the bottom left.
To tag a trace as a baseline, click the tag icon either from the Traces panel on the bottom left, or from the current trace table above the graph.
To remove a trace from the graph, either click the [-] icon from the Traces panel on the bottom left, or from the current trace table above the graph.
To clear the graph of all traces, click the Actions menu and select Clear all traces.
The Traces list can be filtered to only show baseline traces by ticking the “Baseline?” checkbox to the right of the date selector.
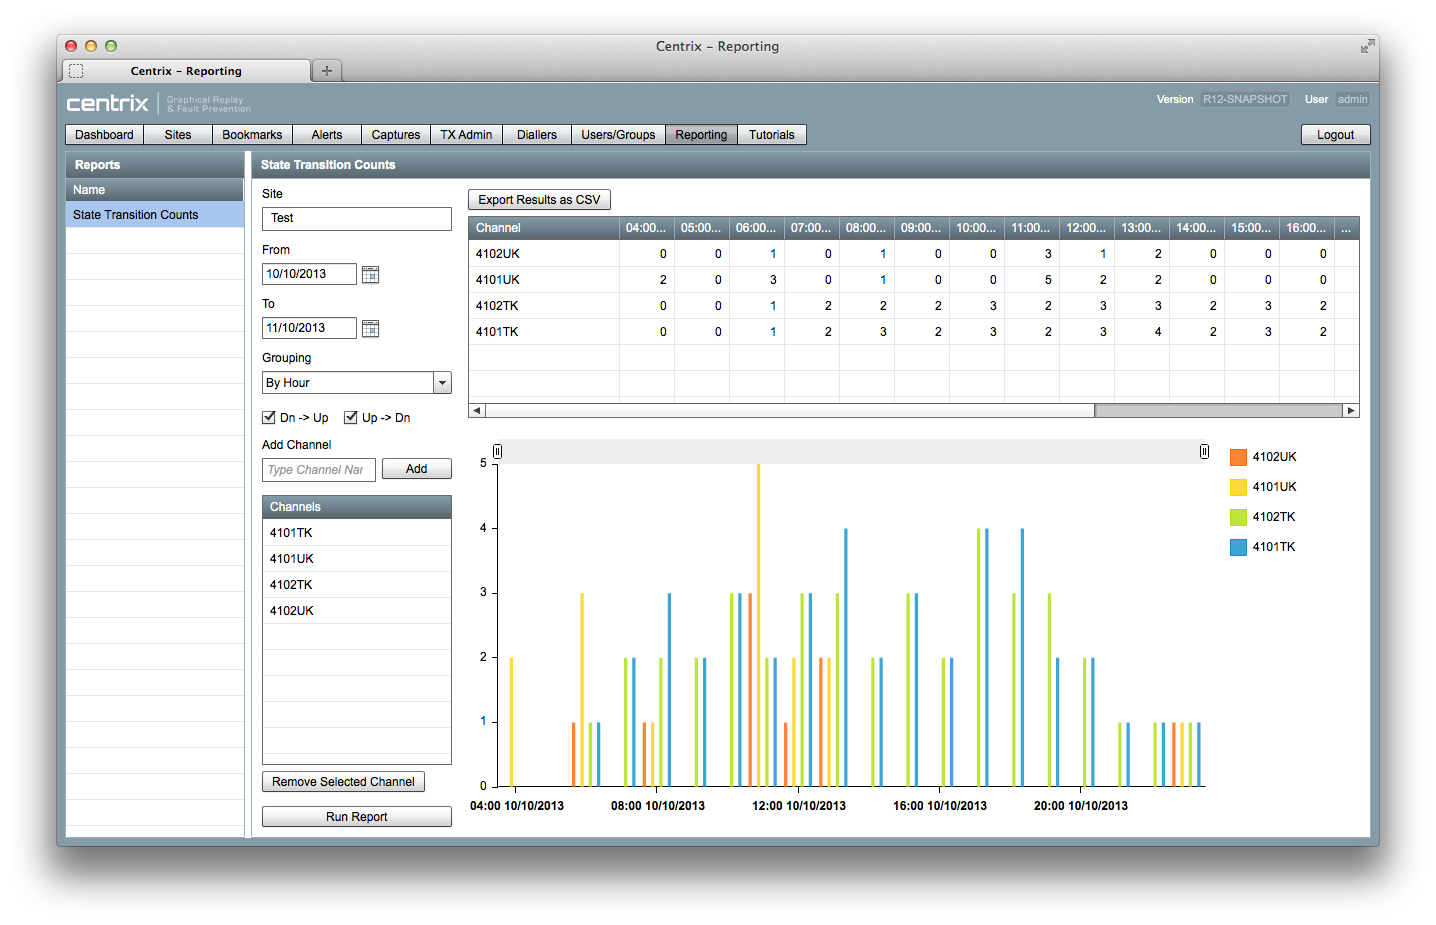
Up to 10 channels can be compared on the graph from a single site. Add channels by typing the channel name in the Add Channel box and clicking Add.
The counts can be grouped by; Year, Month, Day or Hour.
Click Export Results to CSV to export the raw report data for manipulation in an external application (e.g. Microsoft® Excel).


