SA380 series Syslogs
- Janos Vaczi (Unlicensed)
- Former user (Deleted)
Introduction
SA380 series loggers write a journal about the most important internal activities like startup, shutdown, communication.
The syslog is the first place to look during debugging and investigation.
Where to find the Syslog
SA380
GUI
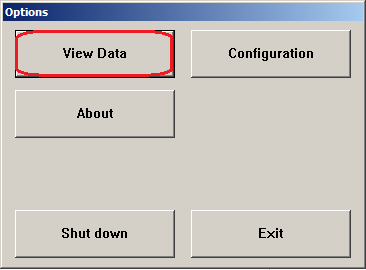
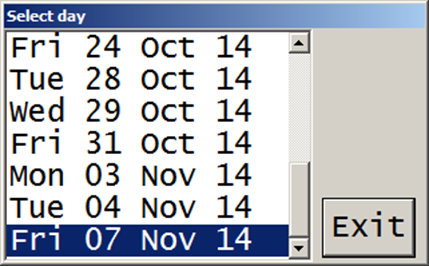
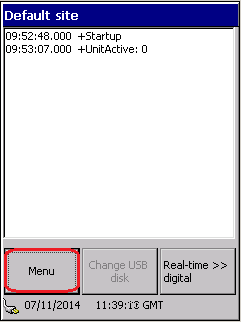
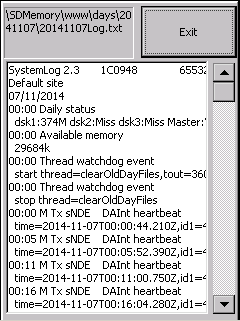
Go to Menu. View Data. Select the appropriate date. Select the dateLog.txt file.
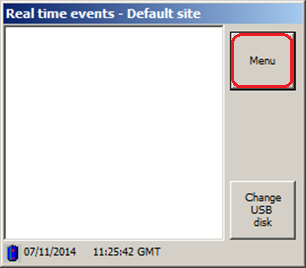
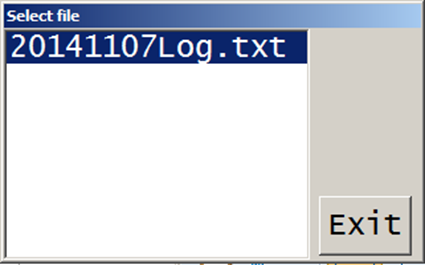
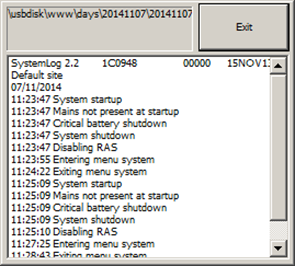
Syslog will show up as text file:
Web interface
You have to have network access to the logger to do this. It can be achieved by connecting directly with an Ethernet cable, or connecting remotely through a network.
You need to have the IP address of the logger!
Enter the logger's IP address into your web browser:

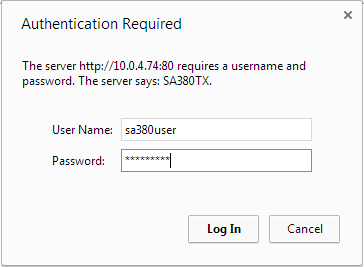
You will be prompted to enter username/password:
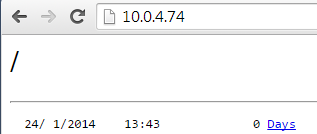
You will be able to browse the data stored on the logger as a folder:
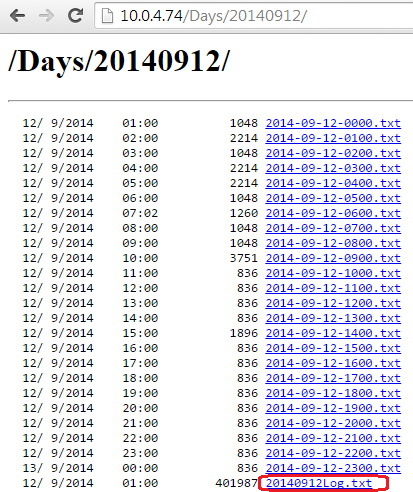
Navigate to the syslog file:
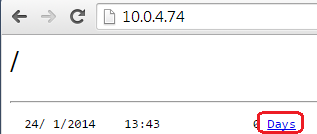
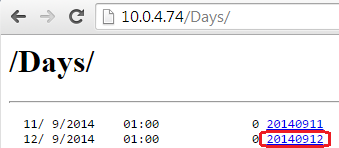
The folder belonging an actual date can have multiple digital log files and a syslog file. Select the dateLog.txt syslog file:
SA380TX
GUI
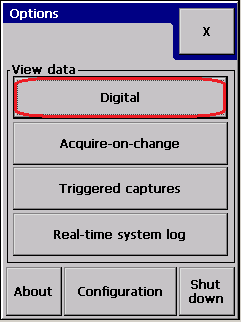
Similarly to SA380: Go to Menu. Go to Digital instead of Real-time system log! Press Show. Select system log and press Show.
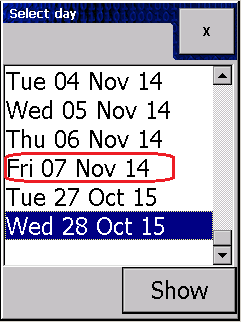
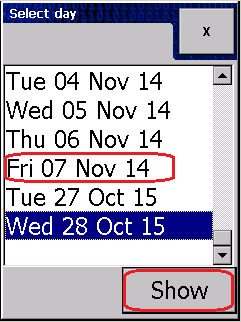
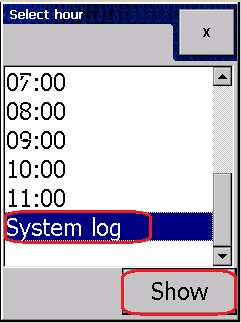
Syslog has to show up:
Web interface
For the SA380TX logger you have to enter the IP address and have to specify the port as well:

You will be prompted for username/password. This and navigating to the actual syslog is the same as on the SA380.
SA380TX-L
dPanel
First you have to select the right type of connection:
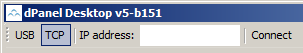
For USB cable connection, select USB:
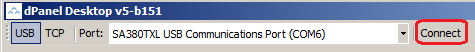 dPanel have to pick up the logger connected to the computer. Press Connect.
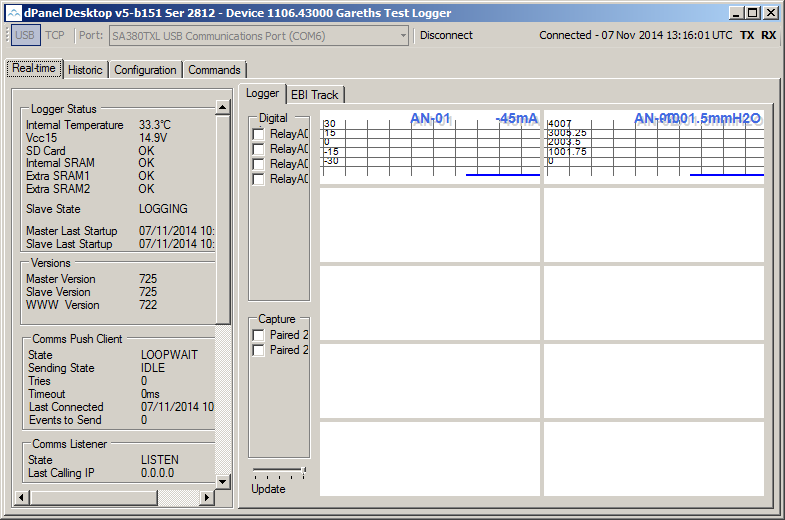
The connected logger will enumerate the information on the Real-time tab:
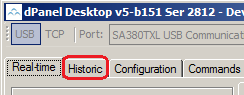
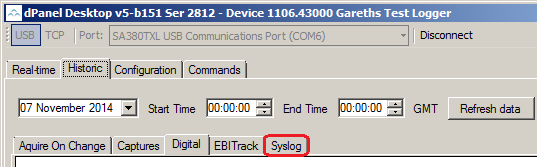
To get to the syslog, select Historic:
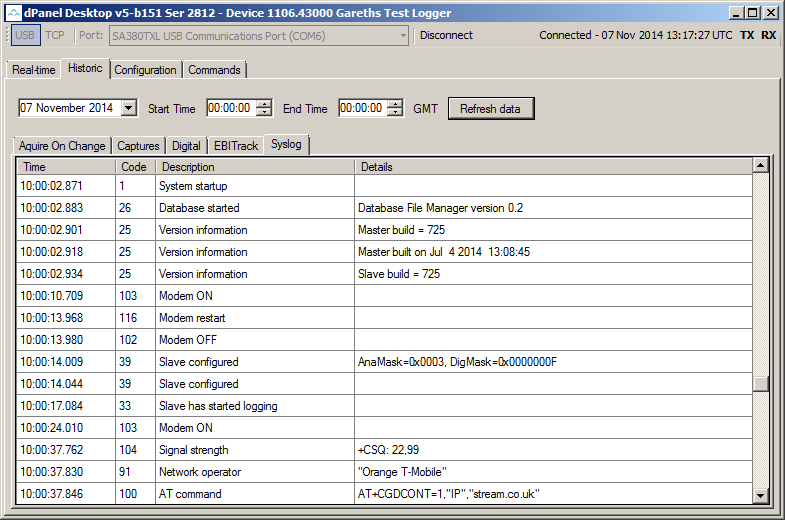
Select Syslog on the sub-tab:
 Normally it shows the last syslog entries retrieved from the logger. First time around it will be empty.
To simply retrieve the latest syslog, press Refresh data:
Web interface
SA380TX-L loggers with new version of firmware (version number?) have web-based configuration tool. The presence of the web tool can be checked with dPanel:
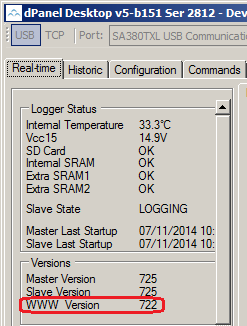 On the real-time tab we get a valid WWW version, which indicates the web-tool is installed on the logger.
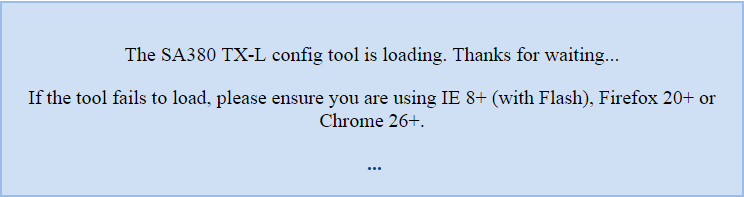
Enter the logger's IP address into your browser:

Successful connection will show the loading screen first:
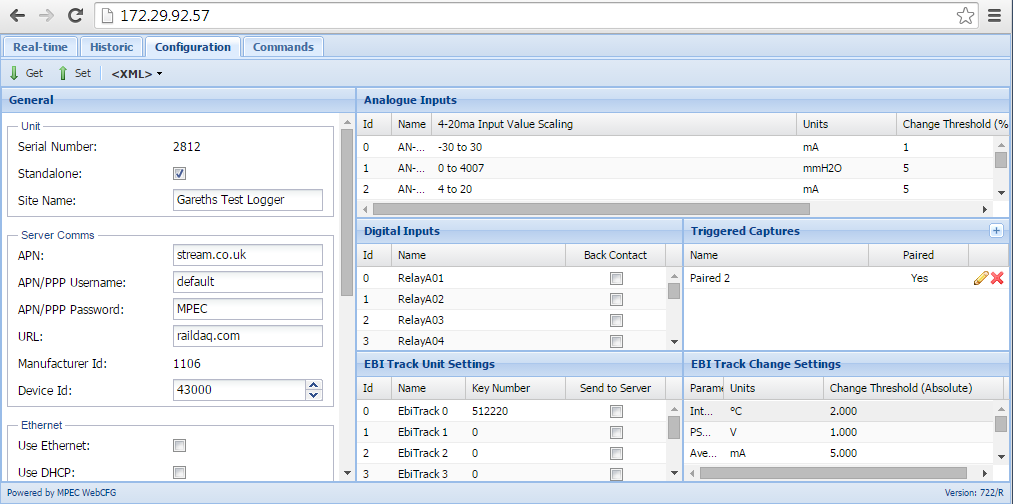
Once loaded it shows the current configuration of the logger:
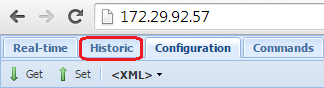
Navigate to the syslog: Select Historic tab.
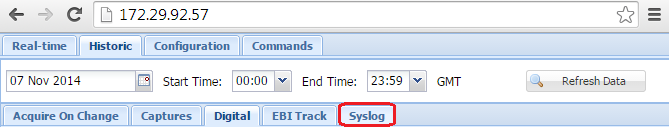
Historic data normally shows the syslog by default. If not, select Syslog sub-tab:
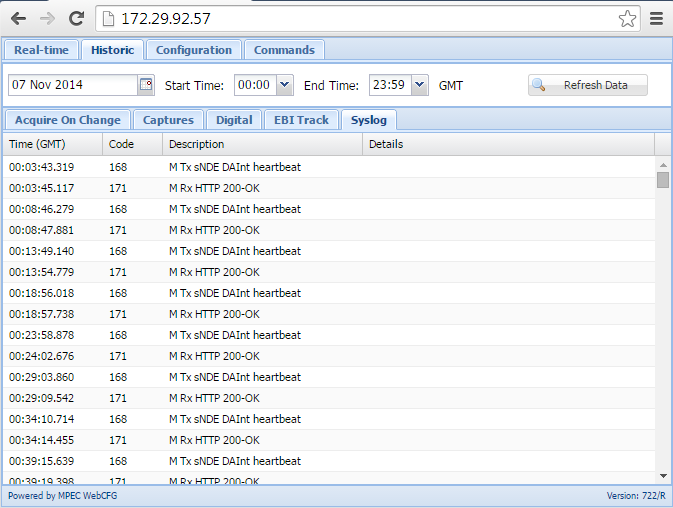
WebCFG retrieves the latest syslog entries:
How to read the Syslog
Basics
| Syslog | Description | Example |
|---|---|---|
| System startup | First message after the logger boots. | System startup 1.5T444 29Oct14 serno=65532 |
| System shutdown | Usually the last message in the syslog before the logger powers down or restart. | no parameters |
| Daily status | Available disk space on each disks. Slave unit statuses. GPRS and dialup status. | Daily status dsk1:374M dsk2:Miss dsk3:Miss Master:Y Slaves:NNNNNNN RasDial:Disconnected RasServe:Enabled |
| Disk failed or not present | Internal or External disk. Internal disk is critical. SA380 needs external disk when used as juridical logger. | |
| Remote access heartbeat received | Remote client connected to the logger and retrieved site name and firmware version. | no parameters |
Enabling RAS server Disabling RAS server | Can be seen time-by-time in SA380 loggers to make sure the RAS server is not hung up in call. | no parameters |
The SA380TX-L logger has a few more messages worth including here.
| Syslog | Description | Example |
|---|---|---|
| Database started | Part of the normal startup. Version indicates data structure changes. | Database started Database File Manager version 0.2 |
| Slave configured | Slave processor got configuration. Optional parameters show available digital and analogue channels. | Slave configured AnaMask=0x0003, DigMask=0x0000000F |
| Slave has started logging | Started the slave processor logging cycle. It is not logging during configuration phase. | no parameters |
Errors
| Syslog | Description | Example |
|---|---|---|
| Thread stopped | Software failure or possible overload. (1) | thread=DiskLogger,state=8 |
| Thread safety system restart | Software failure or possible overload. (2) | no parameters |
| Unexpected disk removal | Error: only for Internal | |
| Battery level low at startup | Flat battery; battery is not charging. Let the logger charge the battery for a few hours. If the error still shows, send the logger back to MPEC for battery replacement. | 2.9V |
| Event receiver overflow | System is overloaded. (3) | |
| Could not delete folder | Happens during old file deletion. Usually indicates file system error. Logger restart may fix it, if it happens because of clashing file access. | \usbdisk\www\days\20140817 |
| Could not create file | Important for SA380: must have external disk installed. | |
| Modem command failed | Serial port error; modem error. It is not an error during modem baud-rate detection! Try to restart communication on the logger. | missing echo |
| M Tx File processing failed | Slow comms (file has been removed since), file system error. Logger had no connection to the server long enough to fill the message queue in the meantime. Check in the syslog if the GPRS communication was lost for a long time. | Could not build:type:EBE tick:395137049463 seqno:0 count:1 file:\usbdisk\www\Days\20120910\ebierr\2012-09-10_MMM TX_0_0.txt |
In case of system overload errors (1) (2) (3), it is a good idea to double-check the data collection settings. It is possible that the logger is collecting way too much data.
Acquire-on-change thresholds are the usual suspects. You may want to set the threshold higher.
GSM Modem
SA380TX
| Syslog | Description | Example |
|---|---|---|
| Modem power off | ||
| Modem power on | ||
| Modem command | AT commands | |
| Modem command failed | check "Modem command" to find what triggered the error | |
| GSM signal strength at turn on | ||
| Disconnecting RASdial | Ending GPRS connection | |
| RASdial disconnected | Important for SA380: must have external | |
| Creating RASdial entry | Have to add a number to Windows phone book to be able to call it with RasDial | |
| SIM registered to | Tells the network | |
| Could not reg. with GSM network | International Mobile Subscriber Identity; International Mobile Station Equipment Identity | |
| GSM IMSI/IMEI | International Mobile Subscriber Identity; International Mobile Station Equipment Identity | |
| Dialling RASdial entry | RasDial call; opening PPP connection; shows user,pass | |
| RASdial connected | RasDial succeded | |
| RASdial error | err=Remote Access Error Code | err=691 |
| New RASserve timeout | RAS server started; timeout restarted | |
| DCD inactive (call cleared down) | Modem data carrier line is down (connection lost) | |
| Disabling RAS server | RAS server stop | |
| DCD active (call connected) | TX2: Dialup has been called | |
| RING received | Dialup during GPRS session | |
| GPRS started | GPRS thread start | |
| GPRS ended | GPRS thread end | |
| Modem fallback wait | Modem didn't manage to register to network, falling back for 1 hour |
SA380TX-L
| Syslog | Description | Example |
|---|---|---|
| Network registration failed | ||
| Network operator | ||
| AT command | ||
| AT command failed | ||
| Modem OFF | ||
| Modem ON | ||
| Signal strength | ||
| PPP Connect | shows user, pass | |
| PPP Connected | shows ip, gateway, dns servers | |
| PPP Disconnect | ||
| PPP Disconnected | ||
| Modem error | baud rate not detected | |
| Modem fallback for | ||
| Modem restart | Restart comms |
MIMOSA push
SA380TX
| Syslog | Description | Example |
|---|---|---|
| Mimosa client started | Thread started | |
| M My IP | IP change triggers MIMOSA disconnect-reconnect | |
| M Tx epRC Request bootstrap | ||
| DNS response | ||
| M Rx epRCr Bootstrap | only response parsed | |
| Mimosa connected to II | epRequestControl has been answered OK | |
| M Tx sNCf Send chan names | Important for SA380: must have external | |
| M Build Event | After 1.5 the logger only logs the fact that the message has been serialised. tick:ticktime interval, smp:number of samples in message,evt=number of events Events contain the samples. | time=2015-10-28T08:58:48.290Z,tick=1395864412451-1395864412500,smp=503,evt=50 |
| M Tx sNDE DAInt heartbeat | ||
| M Tx sNDES DADataSeq | On old loggers (before 1.5) ch:channel name, n:number of samples, time, tick, ch1:channel name, off1:MIMOSA offset, id1:calculated MIMOSA ID | ch:TC 1 Sec 4 TF n:7 time:2014-04-08T00:24:13.250Z tick:64424673636 ch1:TC 1 Sec 4 TF off1:577 id1:4750341636673 |
| M Tx sNDES DAWaveform | On old loggers (before 1.5) | ch:2325A N-R n:352 time:2014-04-07T03:12:25.070Z tick:55834692254 ch1:2325A WI off1:68 id1:4750350352452 |
| M Rx HTTP 200-OK | On old loggers (before 1.5) | |
| No DNS response | h:hostname, t:timeout | h:sntp.corp.ukrail.net t:36s |
| M Tx Couldn\'t send data | send() failed | |
| M Tx Socket opening failed | invalid handle or connect() error | |
| M Tx Send failed - no conn | No bearer; Too many retries | |
| M My IP changed! | Triggers MIMOSA reconnect | |
| M Tx No bearer | No bearer; GPRS down, eth: no IP address | |
| M Rx No response from core sys | ||
| M Rx HTTP error | Logger stores the failed messages in mimosa/mimlog.txt | 503-Service Unavailable |
| M Tx Fallback for | retry in given time | |
| M Tx File processing failed | ||
| M Rx Error processing | epRequestControl response parsing error | |
| Mimosa disconnected from II | Probably easiest to look for this and then trying to find the root cause. | |
| Mimosa client ended |
SA380TX-L
| Syslog | Description | Example |
|---|---|---|
| Mimosa client started | ||
| Mimosa client ended | ||
| M Tx Fallback for | random fallback time | |
| M Tx Send failed - no conn | ||
| M Tx Couldn\'t send data | because of HTTP 4xx status code; cannot send DataSeq etc. | |
| Mimosa connected to II | ||
| Mimosa disconnected from II | ||
| M Tx Couldn\'t send chan names | Failed to send | |
| M Tx Couldn\'t send heartbeat | ||
| M My IP changed! | ||
| M Tx sNDES DADataSeq | ch:channel number in hex, off:MIMOSA offset | ch:A800 off:2560 n:1 time:2014-11-10T15:50:34.495Z tick:1253 |
| M Tx epRC Request bootstrap | ||
| M Rx epRCr Bootstrap | shows ntp, hosts, heartbeat | |
| M Tx sNDE DABool digital | ||
| M Rx epRCr Bootstrap error | device ID, missing parameter | |
| M Tx aborted | It's a complicated one, internal errors can trigger this! No available message bufer |
Syslog examples
SA380TX
| Date | Time | Syslog code (for automatic processing) | Message | Parameters | Description |
|---|---|---|---|---|---|
| 15/09/2014 | 09:06:04 | 234 | Driver information | PSUDriver.dll copied to \Windows\:1.0.0.1 | Normal startup installs operating system drivers. |
| 15/09/2014 | 09:06:04 | 234 | Driver information | Rs485Driver.dll copied to \Windows\:1.0.1.1 | |
| 15/09/2014 | 09:06:04 | 234 | Driver information | rs485isr.dll copied to \Windows\:1.0.0.1 | |
| 15/09/2014 | 09:06:04 | 234 | Driver information | SpeakerDriver.dll copied to \Windows\:1.0.0.1 | |
| 15/09/2014 | 09:06:04 | 234 | Driver information | TimerDriver.dll copied to \Windows\:1.0.0.1 | |
| 15/09/2014 | 09:06:04 | 234 | Driver information | watchdogDriver.dll copied to \Windows\:1.0.0.1 | |
| 15/09/2014 | 09:06:04 | 234 | Driver information | newSPIDriver.dll copied to \Windows\:1.0.0.1 | |
| 15/09/2014 | 09:06:04 | 234 | Driver information | oalioctl.dll copied to \Windows\:1.0.0.1 | |
| 15/09/2014 | 09:06:04 | 234 | Driver information | MpecSnmp.dll copied to \Windows\:1.0.3.1 | |
| 15/09/2014 | 09:06:04 | 125 | Config | can't open \NandFlash\stw\CfgPlaceCfg.xml | Not an actual error message. The place of the configuration is not set. Default: internal disk. It could be in CPU NAND flash. |
| 15/09/2014 | 09:06:04 | 234 | Driver information | Activated SNMP service | Operating system driver has been (re)started. |
| 15/09/2014 | 09:06:04 | 234 | Driver information | Started SNMP service | Custom agent driver has been started. |
| 15/09/2014 | 09:06:04 | 43 | Thread watchdog event | stop thread=EMPTY | |
| 15/09/2014 | 09:06:04 | 1 | System startup | 1.5T441 4Sep14 serno=65532 | Start of normal startup. Logger can write to disk. |
| 15/09/2014 | 09:06:04 | 125 | Config | backup:Days\20140915\cfgchg\2014-09-15 09-06-12 MimosaCfg.xml | |
| 15/09/2014 | 09:06:04 | 79 | Config changed by MIMOSA | MimosaCfg.xml | ticktime gets incremented which is part of MIMOSA configuration, hence it updates. |
| 15/09/2014 | 09:06:04 | 43 | Thread watchdog event | start thread=Logger,tout=300000 ms | syslog thread started. Thread watchdog has 5mins timeout. |
| 15/09/2014 | 09:06:04 | 43 | Thread watchdog event | start thread=Sysmon,tout=11000 ms | |
| 15/09/2014 | 09:06:04 | 43 | Thread watchdog event | start thread=miniQ,tout=30000 ms | |
| 15/09/2014 | 09:06:04 | 43 | Thread watchdog event | start thread=DiskLogger,tout=120000 ms | |
| 15/09/2014 | 09:06:04 | 234 | Driver information | Activated SNMP service | Restarted SNMP service. Configuration has been set. |
| 15/09/2014 | 09:06:04 | 234 | Driver information | PROTOSLAVEDRV:RegisterData, RS485 owner=ebitrack, exit | Protobuf slave module exits because RS485 belongs to EbiTrack. |
| 15/09/2014 | 09:06:04 | 43 | Thread watchdog event | start thread=EbiTrack,tout=90000 ms | |
| 15/09/2014 | 09:06:04 | 43 | Thread watchdog event | start thread=SCThread,tout=60000 ms | |
| 15/09/2014 | 09:06:04 | 43 | Thread watchdog event | start thread=Scheduler,tout=60000 ms | |
| 15/09/2014 | 09:06:04 | 43 | Thread watchdog event | start thread=mimosaClient,tout=14400000 ms | |
| 15/09/2014 | 09:06:04 | 130 | Mimosa client started | ||
| 15/09/2014 | 09:06:04 | 188 | M Tx No bearer | Conection profile set bearer (Ethernet or GPRS) is not active. Mimosa data push falls back and tests it continuously. | |
| 15/09/2014 | 09:06:04 | 128 | GPRS started | ||
| 15/09/2014 | 09:06:04 | 33 | Logger active | ID=0 (ch 1 - ch 384) | TX logger is active. (=Has valid samples.) |
| 15/09/2014 | 09:06:04 | 33 | Logger active | ID=1 (ch 385 - ch 768) | Slave 1 is active. |
| 15/09/2014 | 09:06:04 | 33 | Logger active | ID=2 (ch 769 - ch 1152) | Slave 2 is active. |
| 15/09/2014 | 09:06:25 | 100 | Modem command | Auto-detect modem baudrate | |
| 15/09/2014 | 09:06:26 | 43 | Thread watchdog event | start thread=Netaccess,tout=300000 ms | |
| 15/09/2014 | 09:06:27 | 102 | Modem power off | ||
| 15/09/2014 | 09:06:28 | 49 | Daily status | dsk1:366M dsk2:Miss dsk3:Miss Master:Y Slaves:NNNNNNN RasDial:Disconnected RasServe:Disabled | |
| 15/09/2014 | 09:06:28 | 52 | Available memory | 40928k | |
| 15/09/2014 | 09:06:28 | 43 | Thread watchdog event | start thread=clearOldDayFiles,tout=3600000 ms | |
| 15/09/2014 | 09:06:28 | 43 | Thread watchdog event | stop thread=clearOldDayFiles | |
| 15/09/2014 | 09:06:36 | 132 | Mimosa server started | ||
| 15/09/2014 | 09:06:37 | 103 | Modem power on | ||
| 15/09/2014 | 09:06:52 | 101 | Modem command failed | no response | Belongs to baud-rate auto-detect. |
| 15/09/2014 | 09:07:50 | 100 | Modem command | baudrate=115200 | |
| 15/09/2014 | 09:07:50 | 100 | Modem command | ATE1 | |
| 15/09/2014 | 09:07:53 | 105 | Creating RASdial entry | ATD*99***1# | |
| 15/09/2014 | 09:07:53 | 100 | Modem command | AT+CREG? [H+R] | |
| 15/09/2014 | 09:07:57 | 100 | Modem command | AT+CREG? (roaming) | Checks registration. Roaming is enabled. |
| 15/09/2014 | 09:07:57 | 100 | Modem command | AT+CSQ | |
| 15/09/2014 | 09:07:57 | 104 | GSM signal strength at turn on | 42% -90dBm | GSM modem receive signal strength. It could be improved. |
| 15/09/2014 | 09:07:59 | 112 | GSM IMSI/IMEI | IMEI:[353943040151148] IMSI:[234330421932261] | |
| 15/09/2014 | 09:08:00 | 100 | Modem command | AT+CPIN? | |
| 15/09/2014 | 09:08:00 | 100 | Modem command | AT+COPS=3,0 | |
| 15/09/2014 | 09:08:01 | 100 | Modem command | AT+COPS? | |
| 15/09/2014 | 09:08:02 | 91 | SIM registered to | Orange T-Mobile | |
| 15/09/2014 | 09:08:03 | 100 | Modem command | AT+CGDCONT=1,"IP","ii-dte.corp.ukrail.net" | |
| 15/09/2014 | 09:08:05 | 106 | Dialling RASdial entry | usr=bypass,pass=password | |
| 15/09/2014 | 09:08:26 | 110 | RASdial error | err=691 | Access denied because the user name, password, or both is not valid on the domain. |
| We would need O2 SIM card to be able to connect. The APN has to be enabled as well. This can be an intermittent problem if the SIM configuration has changed. |
NTP Time synchronisation
| Date | Time | Syslog code (for automatic processing) | Message | Parameters | Description |
|---|---|---|---|---|---|
| 10/11/2014 | 10:34:33 | 43 | Thread watchdog event | start thread=SNTP,tout=300000 ms | |
| 10/11/2014 | 10:34:33 | 148 | DNS response | h=ntp.exnet.com,ip1=79.135.97.70,t=0s | NTP hostname is given by MIMOSA server epRequestControl message. |
| 10/11/2014 | 10:34:33 | 152 | Sending SNTP request | ip=79.135.97.70 | |
| 10/11/2014 | 10:34:34 | 153 | SNTP response | rtt=800,clockofs=-1203 | Round-Trip-Time must be below 2sec. |
| 10/11/2014 | 10:34:34 | 63 | Setting time | to:2014-11-10T10:34:33.177Z by:SNTP | Sets clock since offset is greater than 1sec. |
| 10/11/2014 | 10:34:33 | 64 | Set time | from:2014-11-10T10:34:34.390Z |
SA380TX-L
| Time (GMT) | Code | Text | Details | Description |
|---|---|---|---|---|
| 00:02.9 | 1 | System startup | Normal startup. First message. | |
| 00:02.9 | 26 | Database started | Database File Manager version 0.2 | |
| 00:02.9 | 25 | Version information | Master build = 725 | |
| 00:02.9 | 25 | Version information | Master built on Jul 4 2014 13:08:45 | |
| 00:02.9 | 25 | Version information | Slave build = 725 | |
| 00:10.7 | 103 | Modem ON | ||
| 00:14.0 | 116 | Modem restart | Restart Modem thread. | |
| 00:14.0 | 102 | Modem OFF | ||
| 00:14.0 | 39 | Slave configured | AnaMask=0x0003, DigMask=0x0000000F | 2 analogue channels, 4 digital channels |
| 00:14.0 | 39 | Slave configured | ||
| 00:17.1 | 33 | Slave has started logging | Slave CPU is sampling and sending samples to master CPU. | |
| 00:24.0 | 103 | Modem ON | ||
| 00:37.8 | 104 | Signal strength | +CSQ: 22,99 | +CSQ:<received signal strength>, <bit error rate> <rssi>: 0=-113dBm or less, 1=-111dBm, 2..30=-109..-53dBm, 31=-51dBm or greater Shows raw signal strength and Bit Error Rate (99 = not known or not detectable) |
| 00:37.8 | 91 | Network operator | Orange T-Mobile | |
| 00:37.8 | 100 | AT command | AT+CGDCONT=1,"IP","stream.co.uk" | |
| 00:37.9 | 106 | PPP Connect | user:default pass:MPEC | |
| 00:48.1 | 107 | PPP Connected | ip=172.30.92.57, gw=192.168.111.111, pDNS=172.31.4.129, sDNS=172.31.4.193 | |
| 00:48.1 | 134 | Mimosa alternate server started | Mimosa server started on TCP 8080. | |
| 00:54.0 | 130 | Comms push client started | ||
| 00:55.1 | 161 | M Tx epRC Request bootstrap | Logger sends epRequestControl to server. (1st message to send) | |
| 00:57.8 | 162 | M Rx epRCr Bootstrap | ntp:ntp.exnet.com h1:raildaq.com h2:hostName2 hb:300 | Response from server. These are the exctracted parameters. |
| 00:58.3 | 171 | M Rx HTTP 200-OK | ||
| 00:58.3 | 171 | M Rx HTTP 200-OK | Mimosa watchdog is armed | Logger restarts in 3 days time if cannot transmit any more messages successfully. |
| 00:58.3 | 208 | Comms push client connected | Successful epRequestControl message transmitted so logger is connected to server. | |
| 00:59.0 | 163 | M Tx sNCf Send chan names | unit config | Default user tags sent. |
| 00:59.0 | 163 | M Tx sNCf Send chan names | Actual channel names are being sent. | |
| 01:06.4 | 171 | M Rx HTTP 200-OK | Successful. | |
| 01:06.4 | 132 | Comms server started | Mimosa server started on TCP 80. | |
| 02:59.2 | 152 | Sending SNTP request | ip=79.135.97.70:123 | |
| 02:59.5 | 157 | SNTP timeout | sleep = 60079s | |
| 02:59.5 | 153 | SNTP response | clock ok | Logger's clock is within tolerance. (1sec) |
| 06:07.6 | 168 | M Tx sNDE DAInt heartbeat | ||
| 06:09.3 | 171 | M Rx HTTP 200-OK |
Related articles