Event Replay
- Jamie (Deactivated)
- James Spencer
- Robert Hunt (Unlicensed)
Overview
Event replay is one of the core features of Centrix, it is highly customisable using various widgets depending on the type of data you want to visualise.
Playback Control
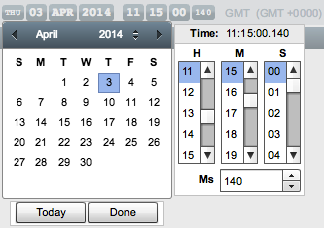
Most of the widgets in event replay rely on a central playback clock which is used to drive the time. You can see the current date and time of the playback clock in the top centre of the screen.

You can change the current playback date and time by clicking on the playback clock. This will present a date and time picker, use the arrows in the date picker to change the month and year. The scrollbars in the time picker can be used to set the hour, minute, second and millisecond. If you hit the Today button then it will set the date and time to the current time based on your computer's clock. After changine the playback time you may have to wait a few seconds for the data in each widget to update.
In the top left of the playback screen you can see a number of playback controls:
- Back 1 Day
- Back 1 Hour
- Rewind
- Pause
- Play
- Forward 1 Hour
- Forward Day
- Playback Speed
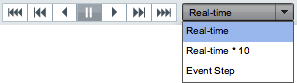
These controls allow you to navigate a fixed interval backwards and forwards in time as well as controlling playback. Using the Play or Rewind options allows you to automatically move the playback clock through time. The Playback Speed controls how fast playback occurs:
- Real-time - events are played back in real time.
- Real-time * 10 - events are played back at ten times real time.
- Event Step - Events are played back with a fixed delay between each event regardless of their actual time.
Keyboard Shortcuts
There are several different keyboard shortcuts which are useful during playback. Ensure that you have first clicked on the widget you wish to control before using the keyboard shortcuts.
- Up (↑) and Down (↓) arrow keys - step backward and forwards through items in widgets or scrolls the up left and down.
- Left (←) and Right (→) arrow keys - adjusts the spacing between items in widgets that are in "Time Spaced Mode" or scrolls the map left and right.
- Page Up and Page Down keys - steps backwards and forwards through items in widgets a page at a time.
- Spacebar key + Left Mouse Click - this turns the cursor into a hand (
 ) which can be used to pan the map when you click and drag the mouse cursor on the map.
 - + and - keys - zoom in and out the map view.
- Ctrl + Mouse Wheel (Cmd + Mouse Wheel on OS X) - zoom in and out the map view.
- 0 key - reset the zoom level to 100%.
Time Driven Lists
Several of the widgets make use of a standard control known as the time driven list. This control is used to display a list of time series data and can be used to move time backwards and forwards in playback.
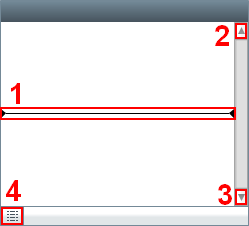
- Current time cursor - this line indicates the current time based on the playback clock.
- Scroll up button - moves backwards through the items in the list, altering the playback clock based on the item time.
- Scroll down button - moves forwards through the items in the list, altering the playback clock based on the item time.
- Enable Time Spaced Mode button (see below).
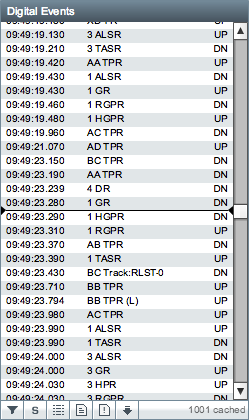
Enable Time Spaced Mode
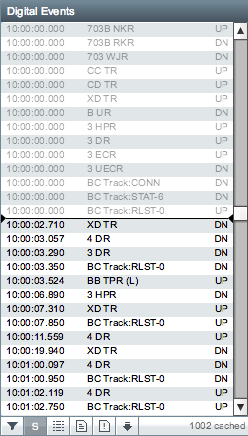
Pressing the enable time spaced mode button will cause the items in the list to be separated by vertical space which is proportional to the amount of time between them.

This feature can be useful when identifying items which occurred around the same time as each other. As mentioned in the keyboard shortcuts section, the Left (←) and Right (→) arrow keys can be used to increase and decrease the space between items. Below is an example of the time spaced mode in operation on the digital events widget.
Widgets
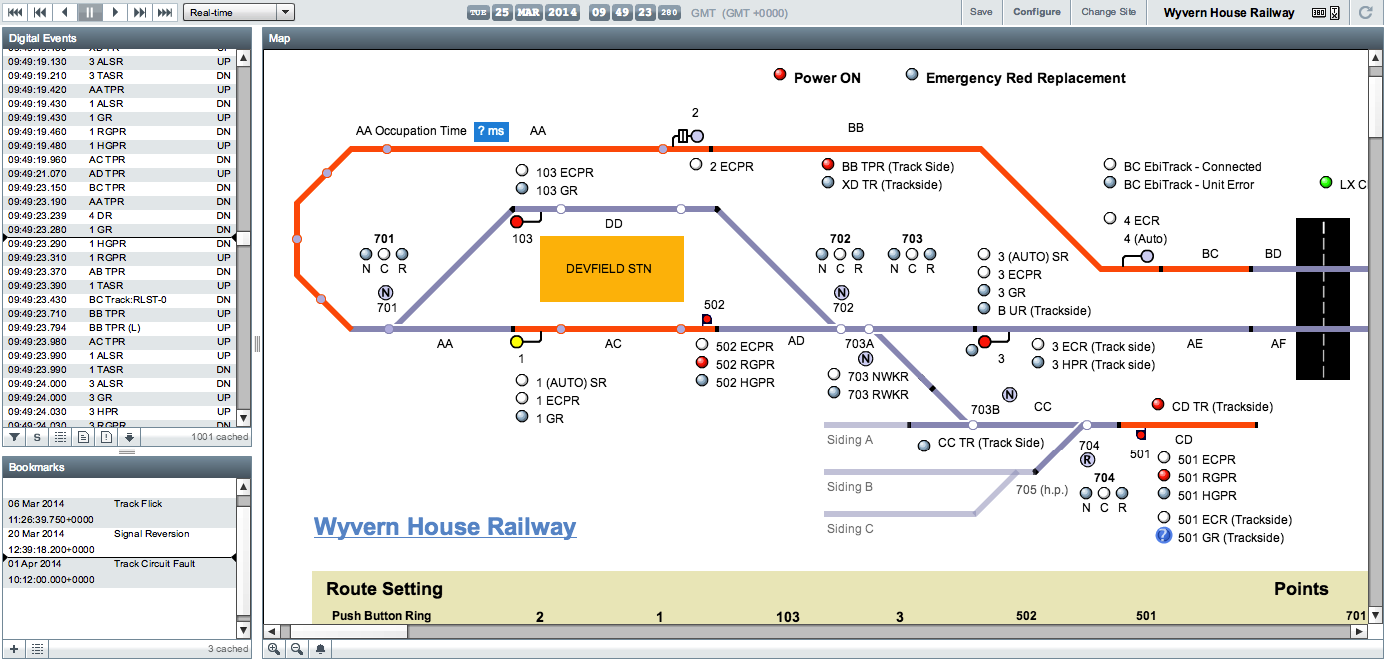
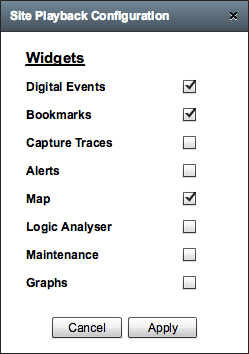
By default, the Digital Events, Bookmarks and Map widgets are visible on a new site until it has been customised by the user. To customise the visible widgets, click the Configure button in the top right of the playback screen.

You should see a dialog appear in the centre of the screen with a list of checkboxes which allow you to enable and disable the various widgets. Once you have selected the required widgets press the Apply button and the playback screen will reconfigure. Pressing Cancel will dismiss the dialog without making any changes.
The new configuration will only remain until you change site or logout, it is also not visible to other users. You can save the configuration by pressing the Save button in the top right of the playback screen, this will make it visible to all users who have access to the site.

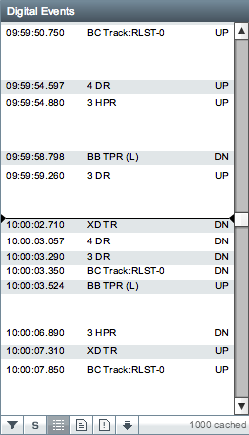
Digital Events
The digital event widget contains all digital event information, this may be from an hour file or other sources.
The toolbar below the list of digital events contains several buttons:
- Filter Channels
- Show Initial States
- Enable Time Spaced Mode
- View Original Hour (Events) File
- View Original System Log File
- Pull Latest Events From Logger
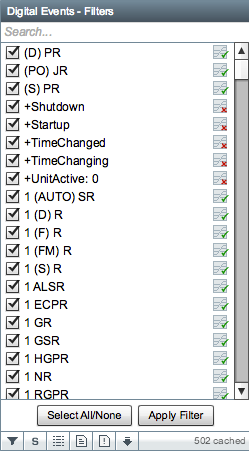
Filter Channels
Pressing the filter channels button will cause the list of events to disappear and a list of channels will be presented.

The list contains every channel that has been configured on the current site in alphabetical order. The checkbox allows you to select and deselect channels for inclusion in the events list. Pressing the Select All/None button will cause all channels that are currently in the list to either be selected or deselected. The small map icon to the right of the channel name in the list indicates if there is a graphical object on the map which is making of use of this channel, a green tick indicates there is and the red cross indicates that there isn't. Pressing the Apply Filter button will reload the events list with only the events for channels you have selected.
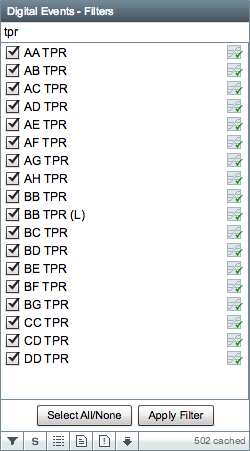
There is a text box at the top of the channels list which can be used to search the list, the search will match any part of the channel name and is case insensitive.
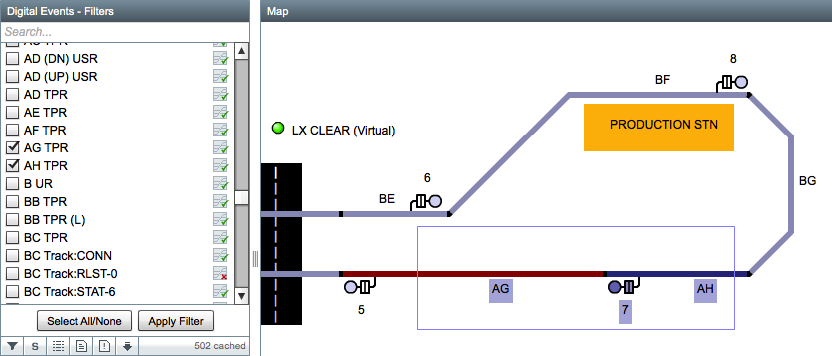
If the map widget is available then it can also be used to filter the list of channels, simply drag a selection around the objects on the map that you're interested in and you should see the channels in the list get selected automatically.
Show Initial States
Pressing the show initial states button will cause the list of events to be reloaded with the addition of the initial state events.

Initial state events are events which do not represent a transition (eg: UP to DOWN) but instead reflect the current state of a channel. There are various sources of initial state events but they are typically found on the hour on sites which have an SA380 logger associated with them. They are shown in the events list in grey to distinguish them from normal transition events. When the list cursor moves over a state event it will not typically trigger any changes on the map if it is visible because the state event should match the current state of the channel.
View Original Hour (Events) File
Pressing the view original hour (events) file button will open up a new window in your web browser with the original hour file which the digital event data came from.

The original hour file is displayed as raw text in the browser and can be saved for offline viewing.
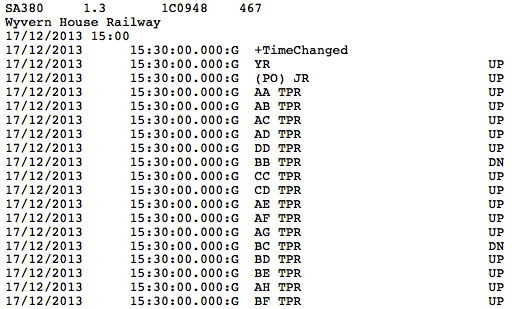
The original hour files are only available for sites with an SA380 or SA380 TX logger which has been configured to download hour files.
View Original System Log File
Pressing the view original system log file button will open up a new window in your web browser with the original system log file for the logger.

The original system log file is displayed as raw text in the browser and can be saved for offline viewing.
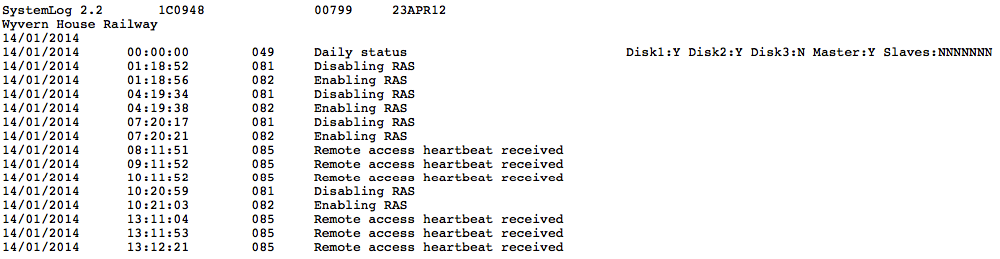
The original system log files are only available for sites with an SA380 or SA380 TX logger which has been configured to download system log files.
Pull Latest Events From Logger
Pressing the pull latest events from logger button will schedule an immediate call to download the latest hour fire and system log file when a dialler becomes available.

A confirmation message will be displayed indicating that a call has been scheduled.
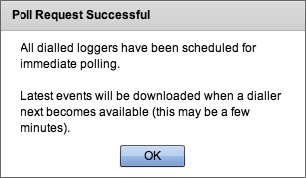
This feature is only available on sites with an SA380 or SA380 TX logger which is configured to be dialled.
Bookmarks
The bookmarks widget displays a list of bookmarks
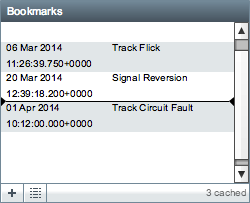
The toolbar below the list of bookmarks contains several buttons:
Create Bookmark
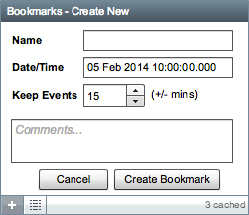
Pressing the create bookmark button will change the bookmark widget into the create bookmark view.

- Name - the name of the bookmark (eg: T19 Track Flick).
- Date/Time - the date and time of the bookmark.
- Keep Events - a time window either side of the Date/Time to keep events. During routine archiving of historical Centrix data, any bookmarks will be inspected and events that fall within the specified window will not be archived.
- Comments - a comment explaining in more detail the purpose of the bookmark.
Pressing the Create Bookmark button will create a new bookmark, pressing Cancel at any time will return you to the bookmarks view.
Capture Traces
The capture traces widget displays a list of capture traces. Clicking on the graph button next to the capture trace will open up the Captures module and display the selected graph.
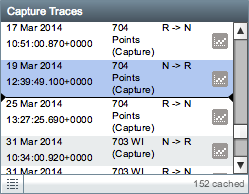
For more information, see Captures.
Alerts
The alerts widget displays a list of alert raises. Clicking on the clock button next to the alert raise will open up a dialog which shows a list of historical alert raises for the selected alert.
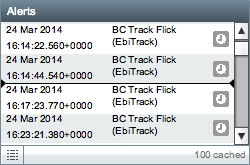
For more information, see Alerts.
Map
If a map has been designed for a site (using the Map Designer) then it will be visible in the Map widget.
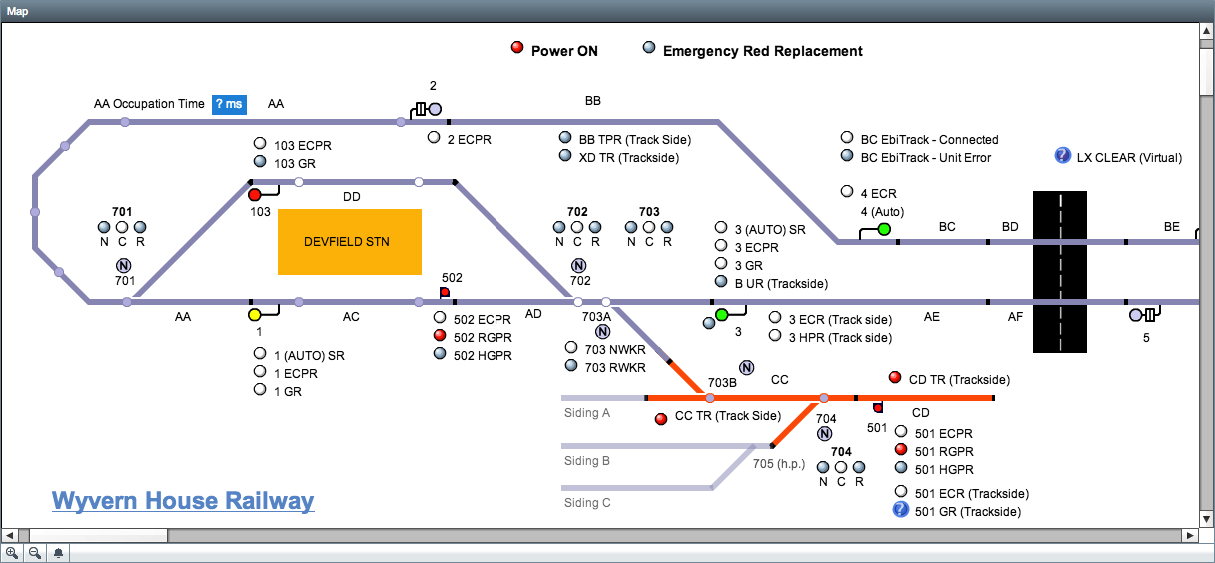
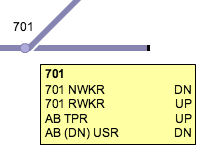
If you hover over an object on the map you will see a tooltip box appear nearby. The tooltip contains the name of the object in bold text along with a list of channels associated with the object and their current state (UP, DN or ?).
The toolbar below the map contains several buttons:
- Zoom In
- Zoom Out
- Show/Hide Alert Icons
Show/Hide Alert Icons
The show/hide alert icons button toggles the visibility of any alert icons on the map. When the button is not in the highlighted state, alerts will not be shown on the map.

When the button is in the highlighted state, the alerts will be shown on the map.

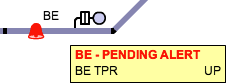
The alerts appear on the map as a flashing red bell icon. They will appear when an alert has been setup on the current site and it has been activated. The alert icon will appear near any objects on the map which share channels with the configured alert. For example, a Track Flick alert setup on track circuit BE will show the icon on the map by the BE track circuit object when triggered.
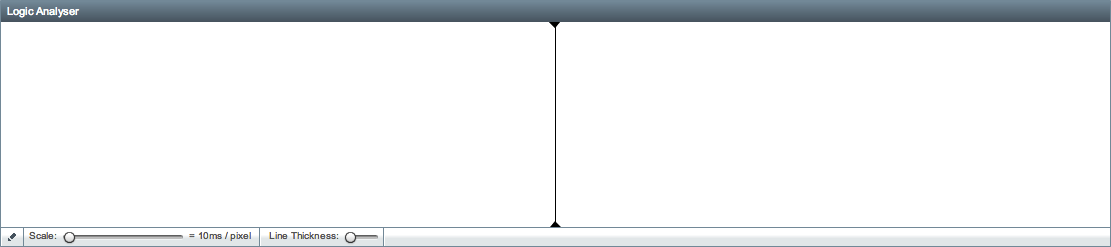
Logic Analyser
The logic analyser provides the ability to visualise the transitions of digital channels over time.
The logic analyser starts out without any channels configured on it, if you click on the Edit Channels button in the bottom left corner you will be taken to a screen where you can configure the channels.
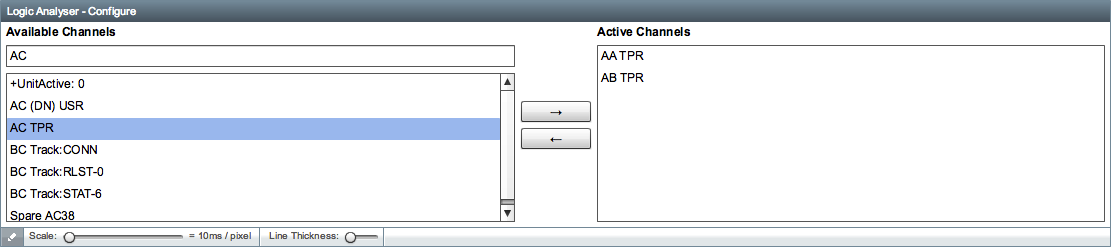
A list of of all available channels is displayed, the logic analyser can only display digital channel data. To add a channel to the logic analyser, first find it in the list or type in the text field at the top of the list to filter it. Once you have located the channel you want to add, click on it to highlight it and then press the right arrow button (→). You can add up to 10 channels and channels may be removed by highlighting them in the Active Channels list and pressing the left arrow button (←). Once you have finished adding the required channels, click the Edit Channels button in the bottom right corner again to return to the main logic analyser view.
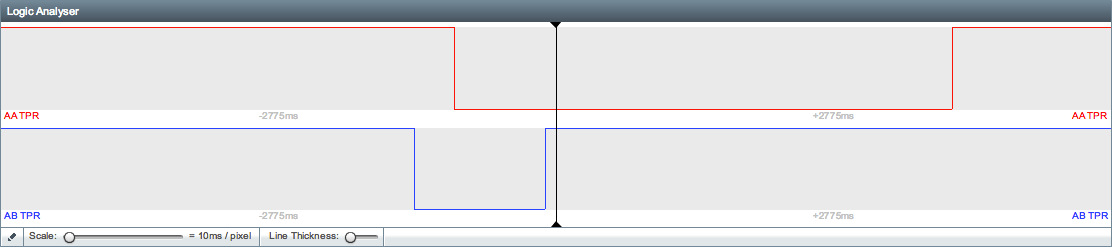
The channels will appear on the logic analyser as a line, the UP state is the top and the DN state is the bottom.

The toolbar below the logic analyser contains several controls:
- Scale - The first slider at the bottom of the logic analyser can be used to adjust the time scale on the x-axis. By dragging the slider to the right you can increase the amount of time represented by each pixel, this allows you to expand the timeframe visible in the logic analyser. The millisecond values either side of the centre line indicate the current size of the timeframe and change in relation to the position of the slider.
- Line Thickness - the second slider is used to adjust the thickness of the line drawn on the logic analyser, this may make it more visible.
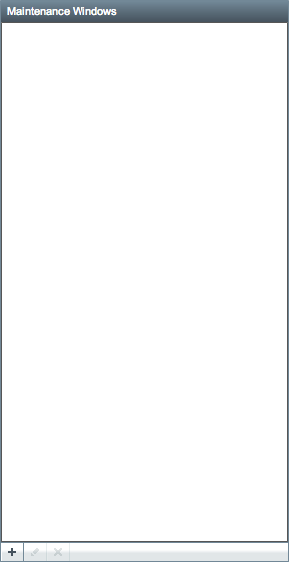
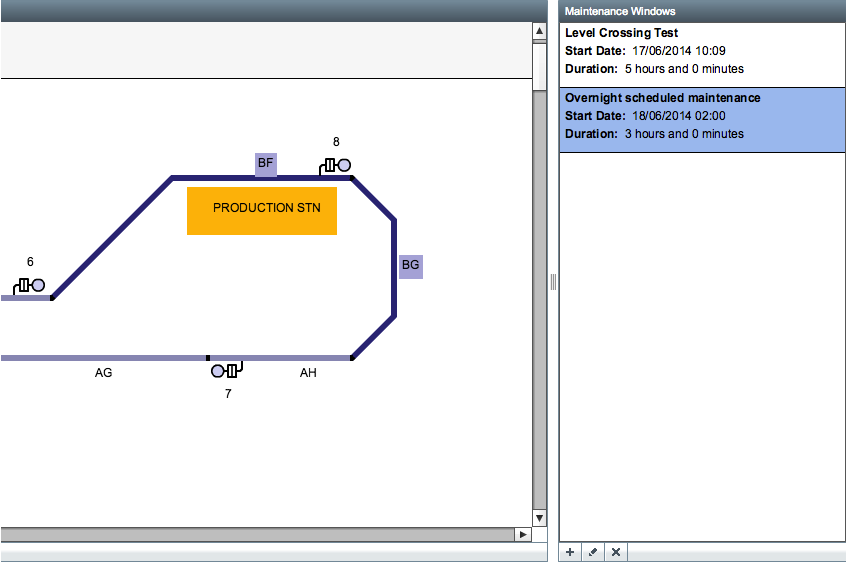
Maintenance Windows
The maintenance window widget is used as a mechanism to suppress alerts during certain time windows. By default, there will be no maintenance windows setup on a site.
The toolbar below the maintenance windows contains several buttons:
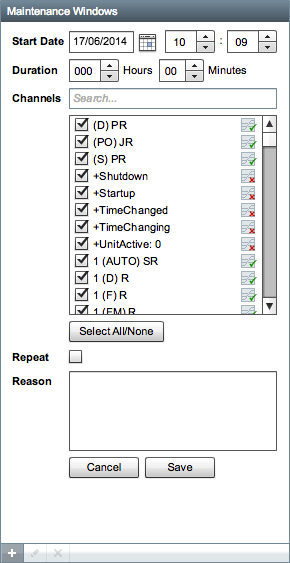
Add Maintenance Window
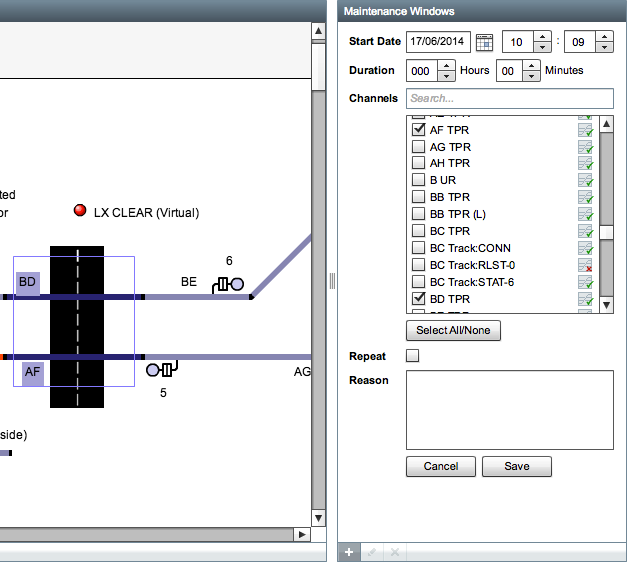
Press the plus button in the bottom left to create a new maintenance window.

The maintenance window form contains several fields:
- Start Date - the start date and time for the maintenance window.
- Duration - the length of the maintenance window in hours and minutes.
- Channels - the channels to include in the maintenance window, any alerts configured for the current site which involve the selected channels will be suppressed during the maintenance window.
- Repeat - check the box if the maintenance window should repeat every day.
- Reason - a short description that indicated the reason for the maintenance window (eg: track occupancy for scheduled maintenance).
Press Save to create the new maintenance window or Cancel to return to the main list.
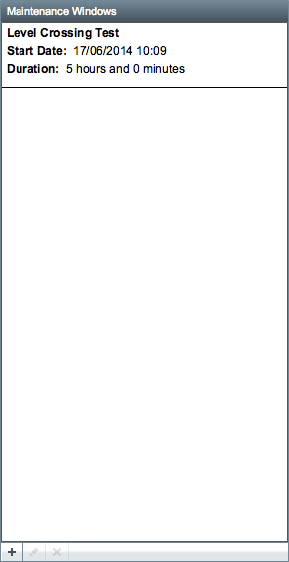
The list should now show the newly created maintenance window.
If you have configured the map widget, you can select a maintenance window to highlight any objects that are covered by the maintenance window.
When creating or editing a maintenance window, you can click and drag a selection on the map widget to populate the list of channels.
Edit Maintenance Window
To edit an existing maintenance window, first select it in the list and then click the edit button in the toolbar at the bottom of the widget.

Only maintenance windows which have not yet started can be edited.
Remove Maintenance Window
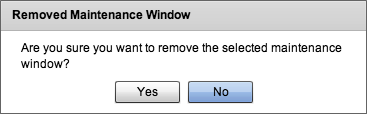
To remove an exiting maintenance window, select it in the list and then click the remove button.

You will see a confirmation dialog before the maintenance window is removed.
Graphs
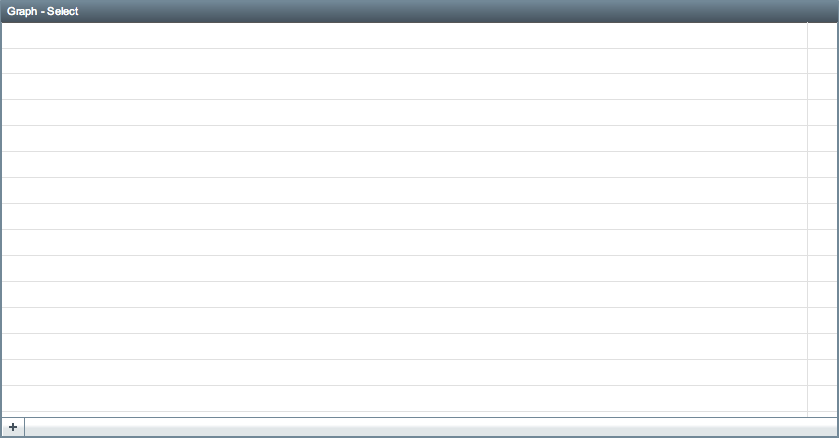
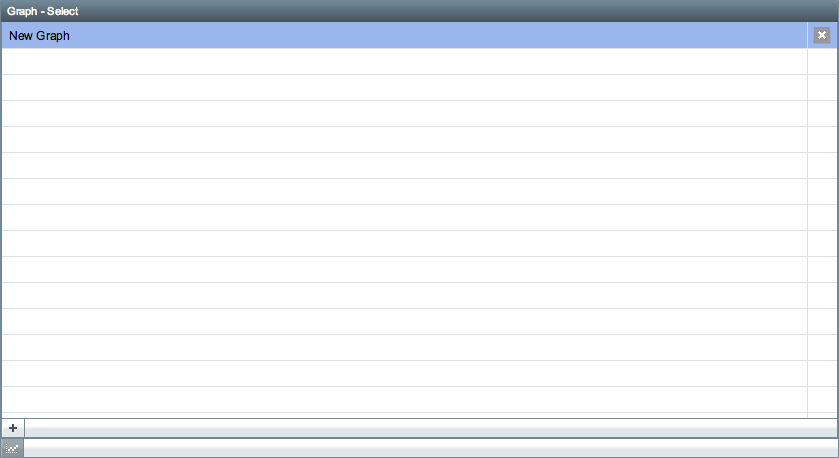
The graphs widget is used to display analog data such as Acquire on Change data from an SA380 TX or SA380 TXL series logger. Click on the graph button in the bottom left of the graphs widget to see a list of graphs.
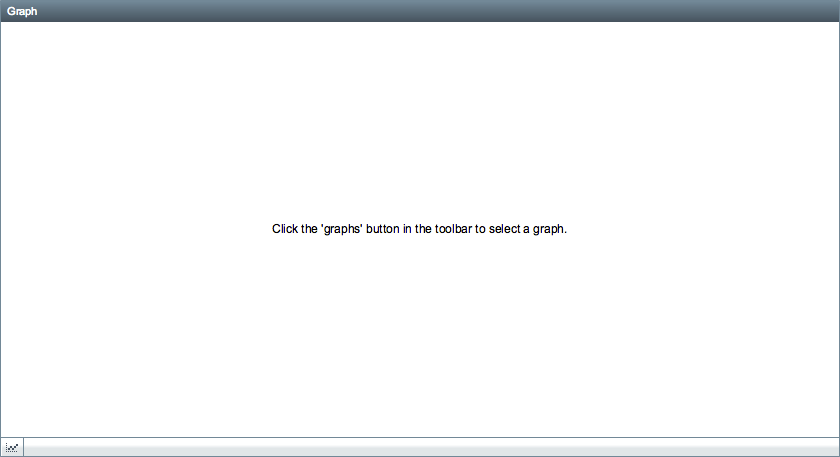
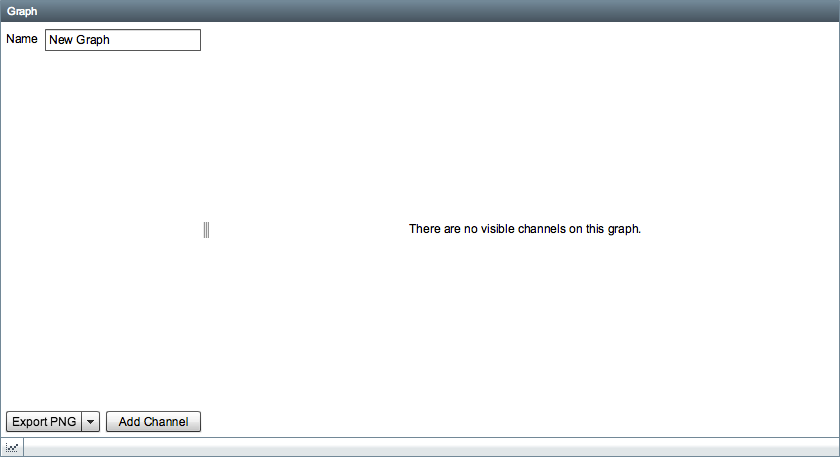
By default there will be no graphs configured on a site. Click on the Add Graph button in the bottom left corner to add a new graph.
Type in a name for the new graph.
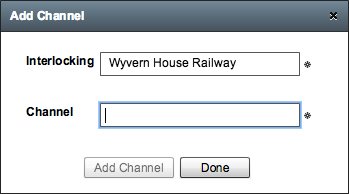
Adding a Graph Channel
After clicking the Add Channel button you will be presented with a dialog, by default the Interlocking field will be set to the current site but you can specify a different site if you want to add channels from another site for comparison.
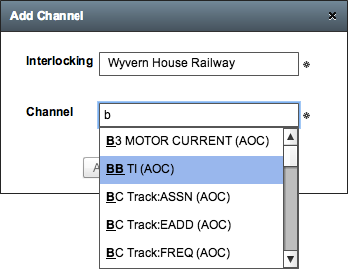
The Channel field contains a list of analog channels for the specified site, you can type in the field to filter the list of channels. Press the Add Channel button to add the channel to the graph, you should see the channel being added in the background, you can then specify another channel or press Done to dismiss the dialog and return to the graph.
Viewing a Graph
To view a graph, select one from the list of graphs.
The graph will then be displayed and the playback cursor will be placed at the current time specified by the playback clock.
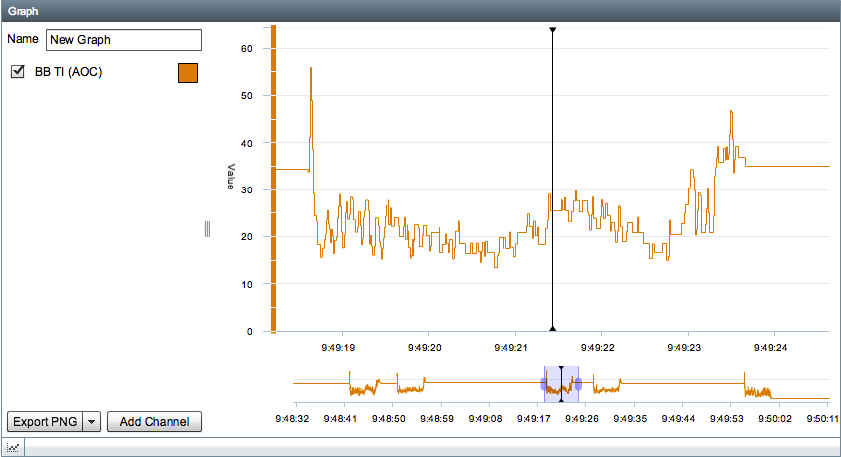
Hovering over the coloured square next to the graph channels will change the square into a refresh icon: 
If you click on the square you will force a manual update of the graph data for the selected channel, during the update the square will animate with a loading graphic: 
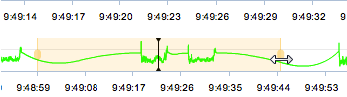
To zoom in and out of the graph, either use the mouse wheel on your mouse or drag the left or right handles in the graph preview bar under the main graph.
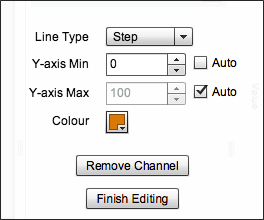
Editing a Graph Channel
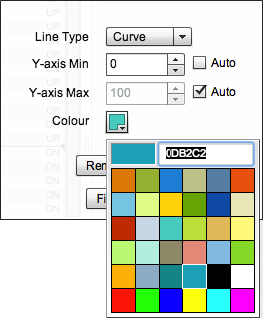
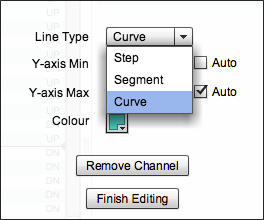
To edit a channel on the graph, click on it in the list on the left, this will open up an edit dialog with several options:
- Line Type - change how the line is displayed on the graph.
- Y-axis Min - sets the lower boundary for the scale on the Y axis. Use the Auto option to automatically determine the minimum based on the current data in view.
- Y-axis Max - sets the upper boundary for the scale on the Y axis. Use the Auto option to automatically determine the maximum based on the current data in view.
- Colour - change the line colour.
- Remove Channel - remove the channel from the graph.
- Finish Editing - save any changes.
The line type can be changed to one of the following options:
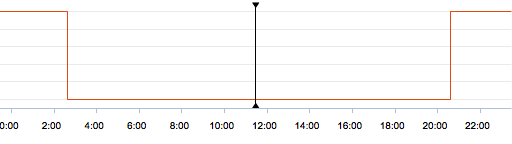
- Step - this is the default option, it steps the line between each data point
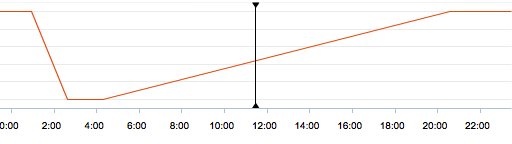
- Segment - joins each data point with a line
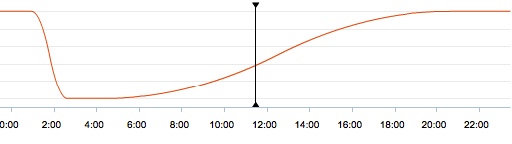
- Curve - approximates a curve between each data point
Line type options:
To change the line colour, click on the colour box and you will be presented with a colour picker. If you want to use a custom colour not available in the colour picker you can type a colour code in the field, the field uses the HTML/Hex colour format.