The points alarm wizard
- Nick Wright (Deactivated)
How does the points alarm wizard calculate appropriate alarm thresholds?
Track switches come in a variety of flavours. They differ in length, geometry, driving mechanism, repair history, and operating environment. As such, appropriate alarm thresholds will vary from machine to machine.
The points alarm wizard calculates alarm thresholds individually for each machine, each time it is run. It determines appropriate alarm thresholds by analysing historical data. That is, it examines how each machine has performed in the past, and picks alarm thresholds that will be triggered if any machines starts behaving differently.
The exact algorithm used is described in detail below.
Step one - build a training dataset
For each machine, the alarm wizard compiles a "training dataset" which contains the most recently recorded capture traces. This is used to establish the machine's typical performance (e.g. average current draw, hydraulic pressure etc).
The following items are included in the training dataset:
- Capture traces recorded for this asset in the last 90 days, up to a maximum of two thousand traces.
The following items are excluded from the training dataset:
- Any capture traces with a "fault", "maintenance", or "anomaly" tag, because these capture traces are not representative of that machine's normal behaviour, and will bias the result.
Note that these tags can be applied manually by the user, but they are also assigned automatically by the automatic tagging system, whenever Centrix receives a new capture trace.
Step two - extract features from the training dataset
The alarm wizard extracts three "features" from each capture trace in the training dataset. The features are are:
- Swing time for each throw.
- Average current draw for each throw, or in the case of clamp lock type machines, average hydraulic pressure per throw.
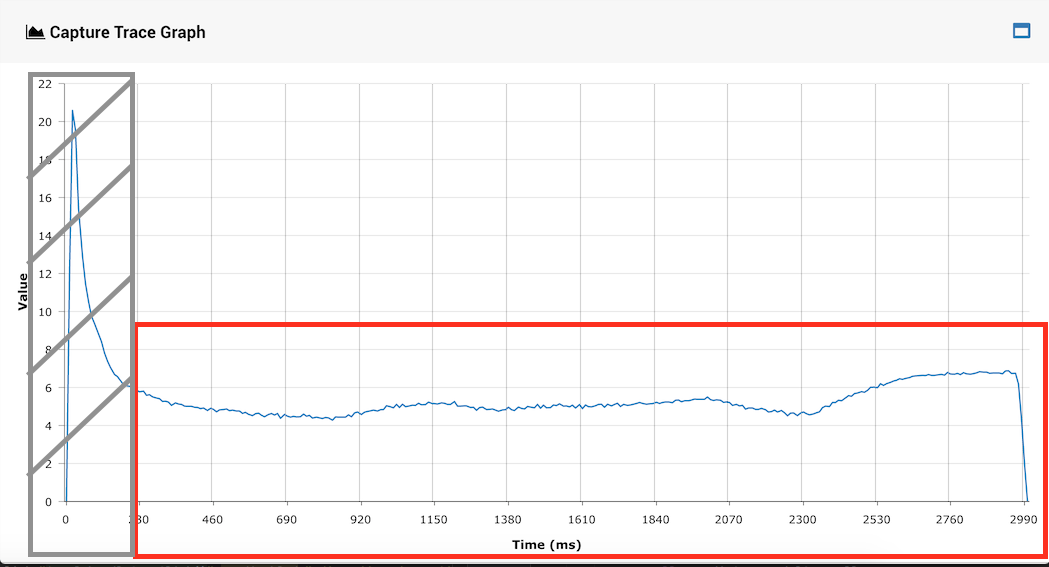
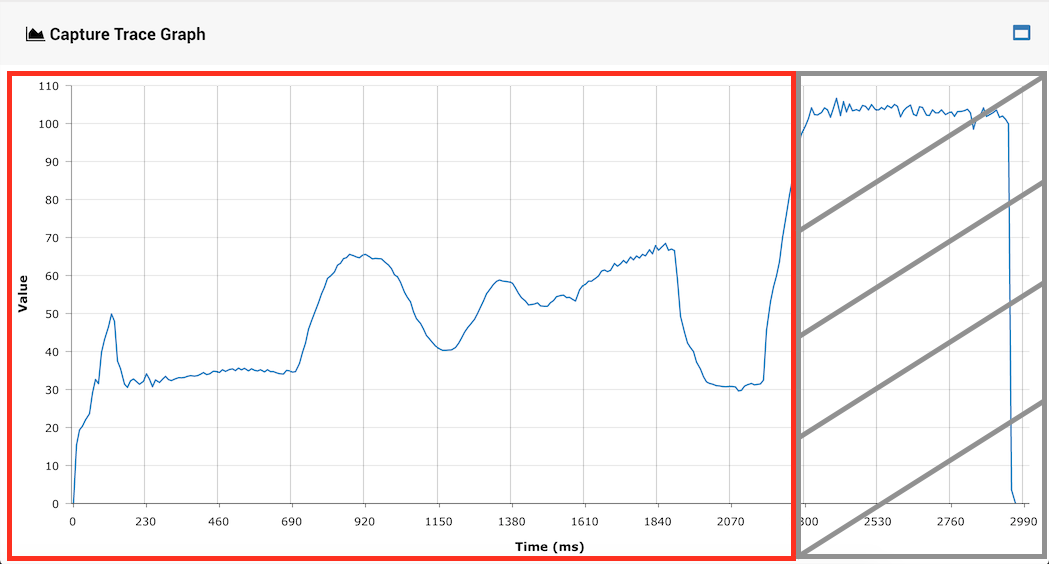
- For electrically actuated points machines, peak current draw for each throw, with the inrush current automatically removed by the trace splitting system (see images below, the section marked in grey is excluded).
- For clamp lock type machines, peak hydraulic pressure during the part of the capture trace where the switch blades are moving, again using the trace splitting system described above.
Now the alarm wizard has three lists of features (one feature per throw) for the training dataset. It will create an alarm threshold for each of these.
Step three - assign a probability distribution to each list of features
The alarm wizard calculates a probability distribution for each of the three lists of features. The probability distribution tells us how well the points machine should be expected to perform, when it's not suffering from a fault. That is, it tells us what the typical and "worst case" performance is for the machine.
For example, consider the performance of a single HW type machine over 90 days. Let's say it usually draws around 6.5 Amps average for each throw, but occasionally 6 Amps or 7 Amps. If you plotted the average current measurements on a histogram, you'd see it follow a rough bell shape.
To illustrate the above, the image below shows the distribution of average current draw per throw for a particular HW machine in Centrix, over 90 days.
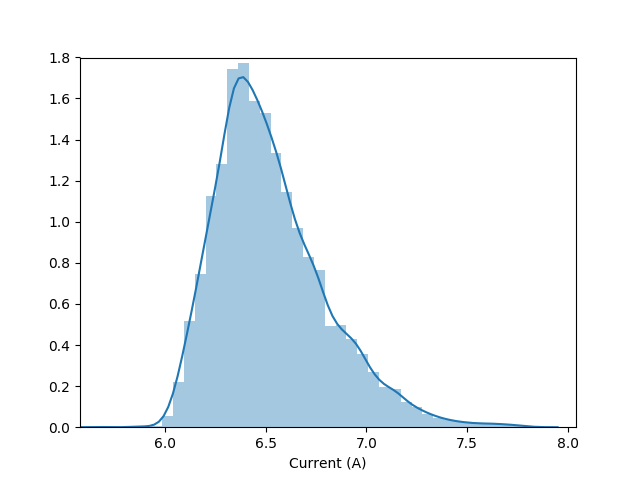
Centrix uses a statistical technique called Kernel Density Estimation (KDE) to assign an empirical probability distribution to each list of features, like the one shown above.
Step four - choose the alarm thresholds
The points alarm wizard generates three alarm thresholds, each corresponding to one feature list. That is, it creates alarm thresholds for swing time, average, and peak current/pressure.
The alarm thresholds are selected such that they are close to the upper, "worst case" limit of performance for the machine. The probability distribution for each feature is used to calculate this limit.
The image below shows where the average current alarm threshold for the machine depicted above would have been set.
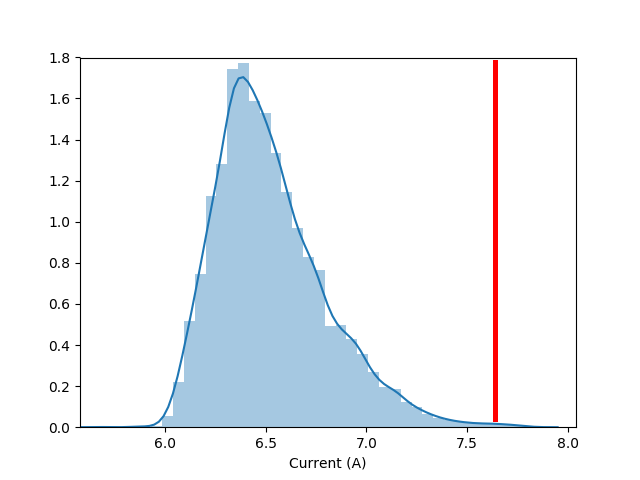
The alarm wizard allows the user to generate low, medium, or high sensitivity alarms. If the user chooses to create alarms with a higher or lower sensitivity, then alarm threshold shown in the image above would be shifted a either to the left or right, respectively. Higher sensitivity thresholds will be triggered more frequently, so is suitable for those users preferring a stricter alarm regime.