Plot capture features over time
- Jamie (Deactivated)
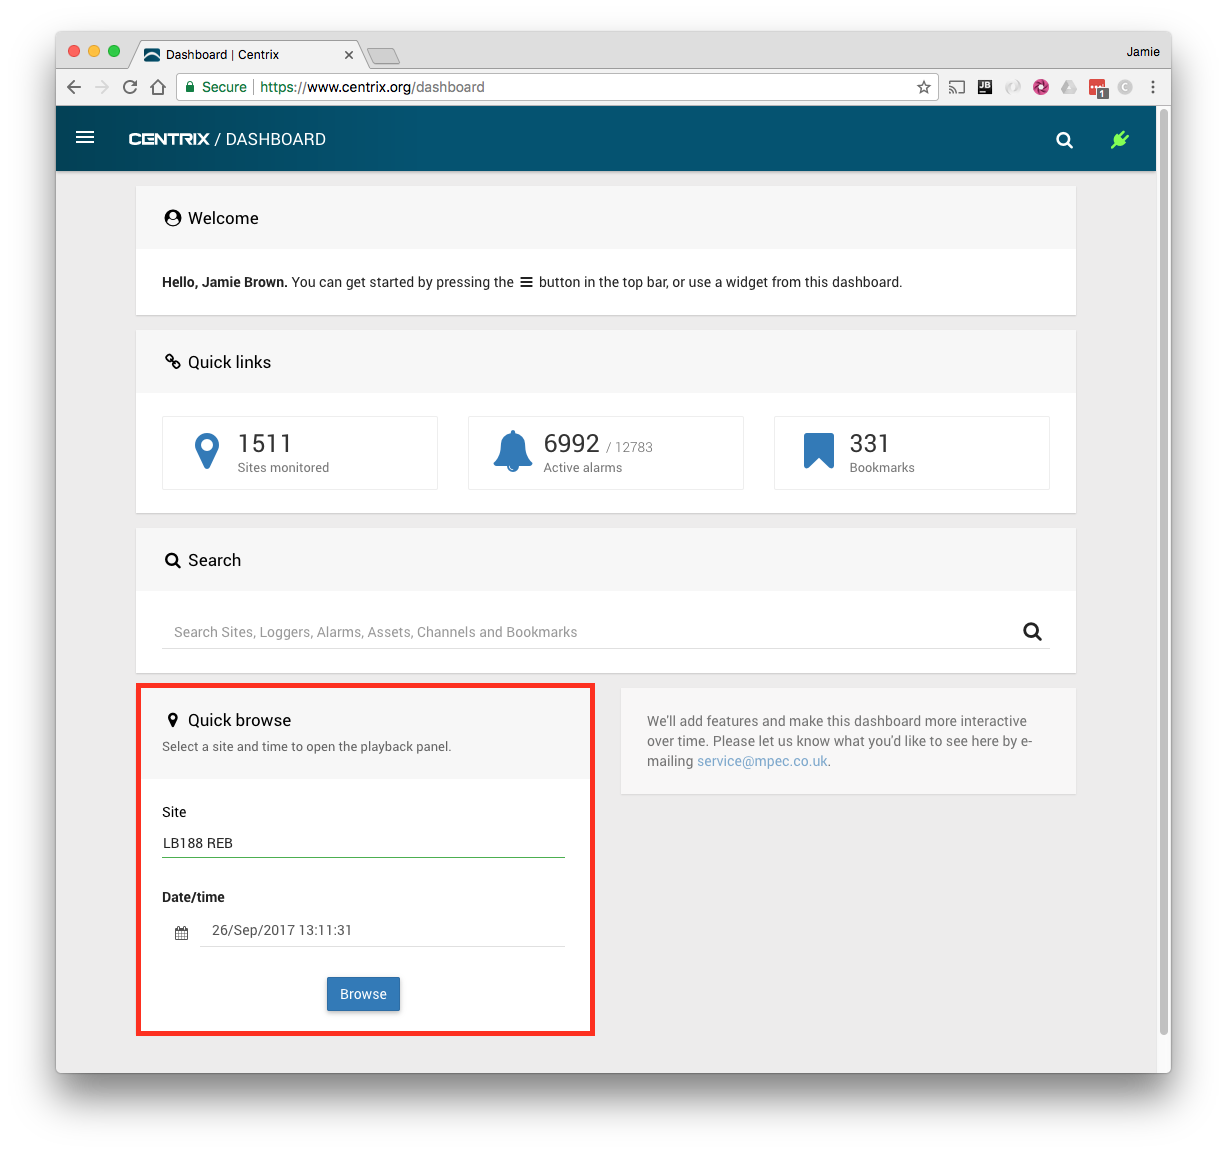
Open the Playback panel for the site that contains the asset you want to plot features for;
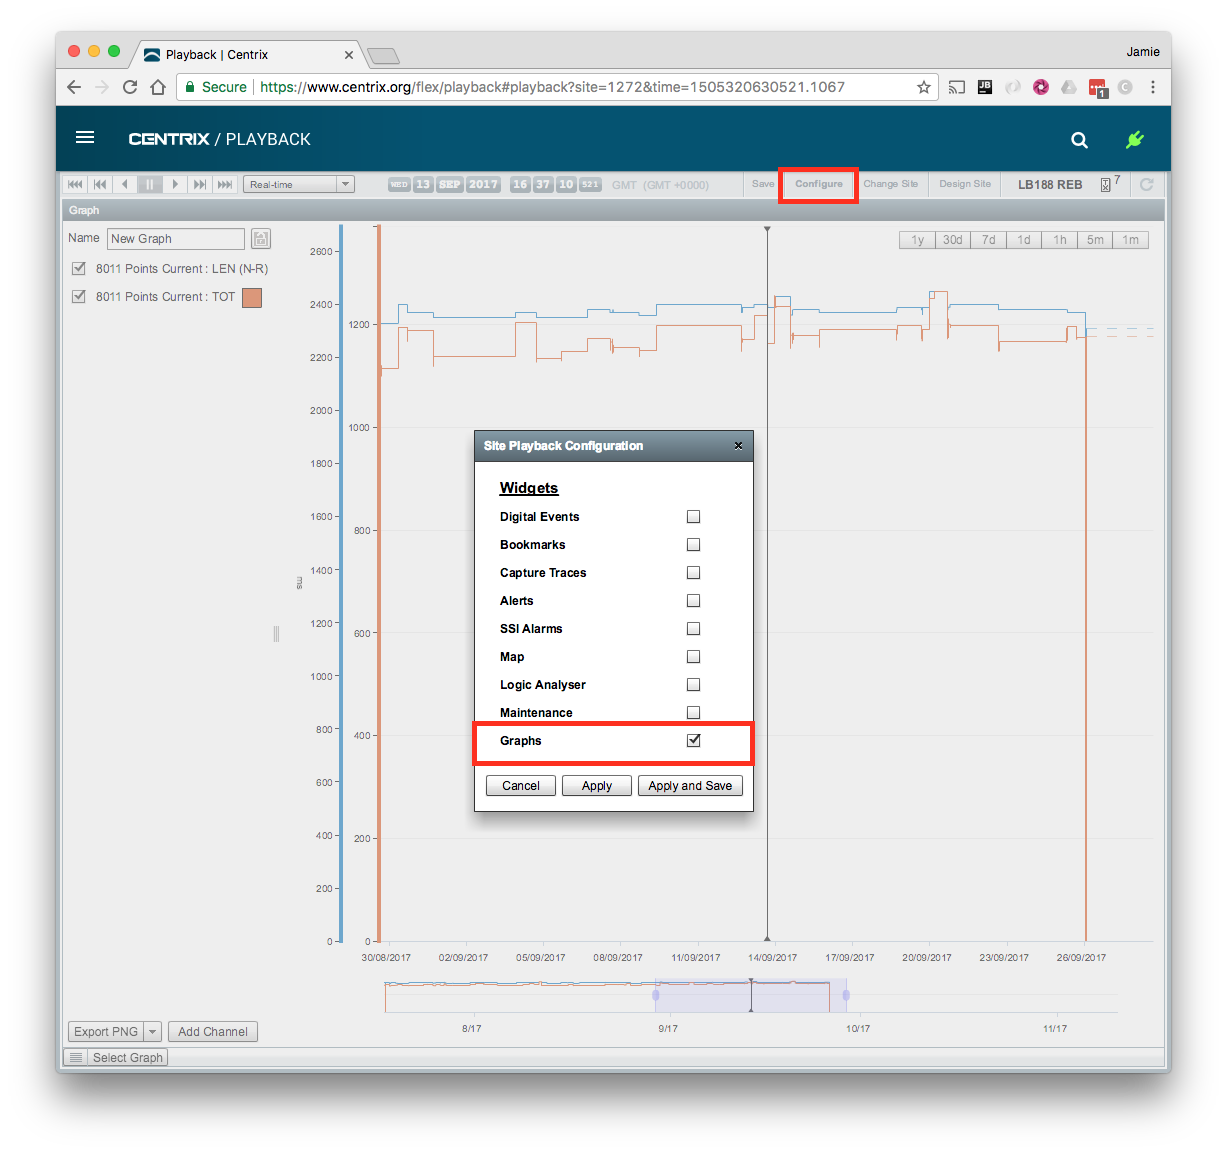
If not already enabled, add the Graphs widget to the playback panel. You may wish to turn other widgets off to maximise the view of the graph on the screen. Click Apply to apply the changes (Apply and Save will make the change permanent for this site).
Click Configure > Check Graphs > Click Apply
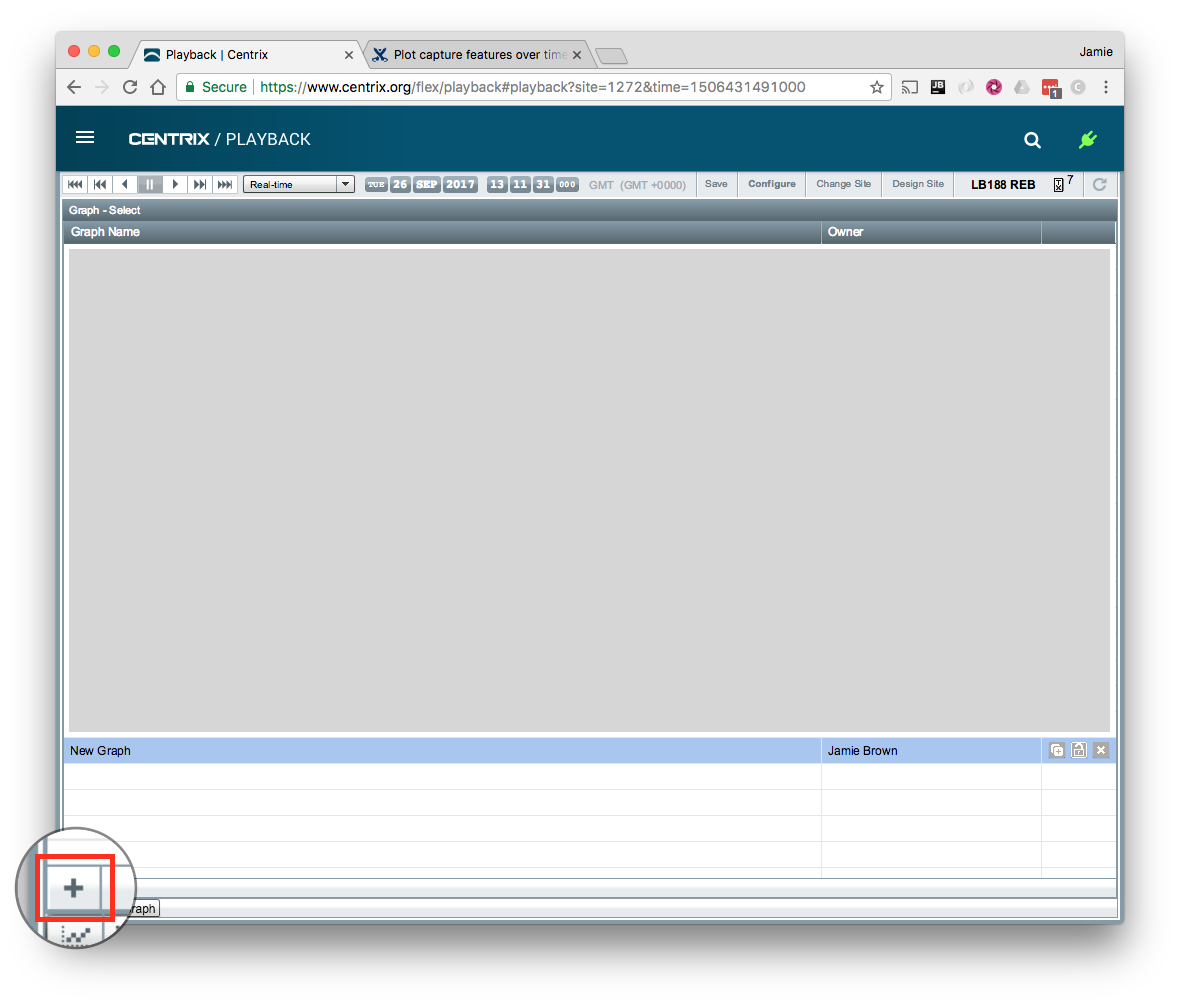
If a graph is loaded by default, then click Select Graph and then the Create Graph ![]() button in the lower left of the panel. If there is already a saved graph that has the desired output configured, you can just open that graph.
button in the lower left of the panel. If there is already a saved graph that has the desired output configured, you can just open that graph.
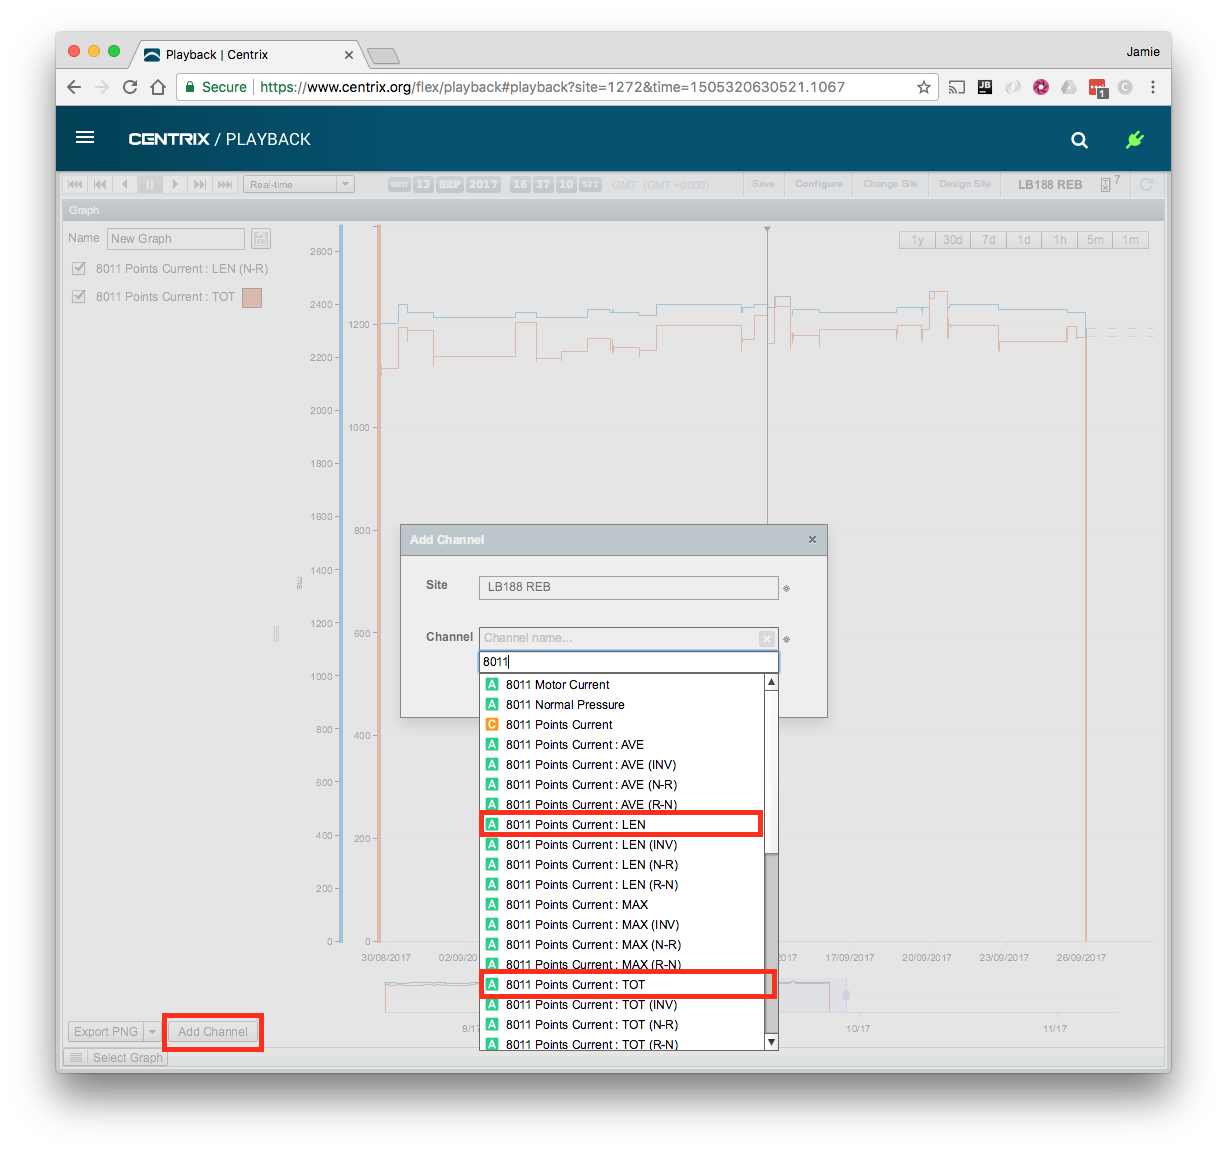
Click Add Channel and add the desired feature channels for the asset you want to analyse. Feature channels are begin with the same name as the capture channel. followed by the feature type (AVE, LEN, MAX, TOT). For each feature, there is a combined channel and also channels separated by swing direction (N-R, R-N and Invalid).
You can quickly expand the view to show a specific date range using the buttons in the top right of the graphs panel.
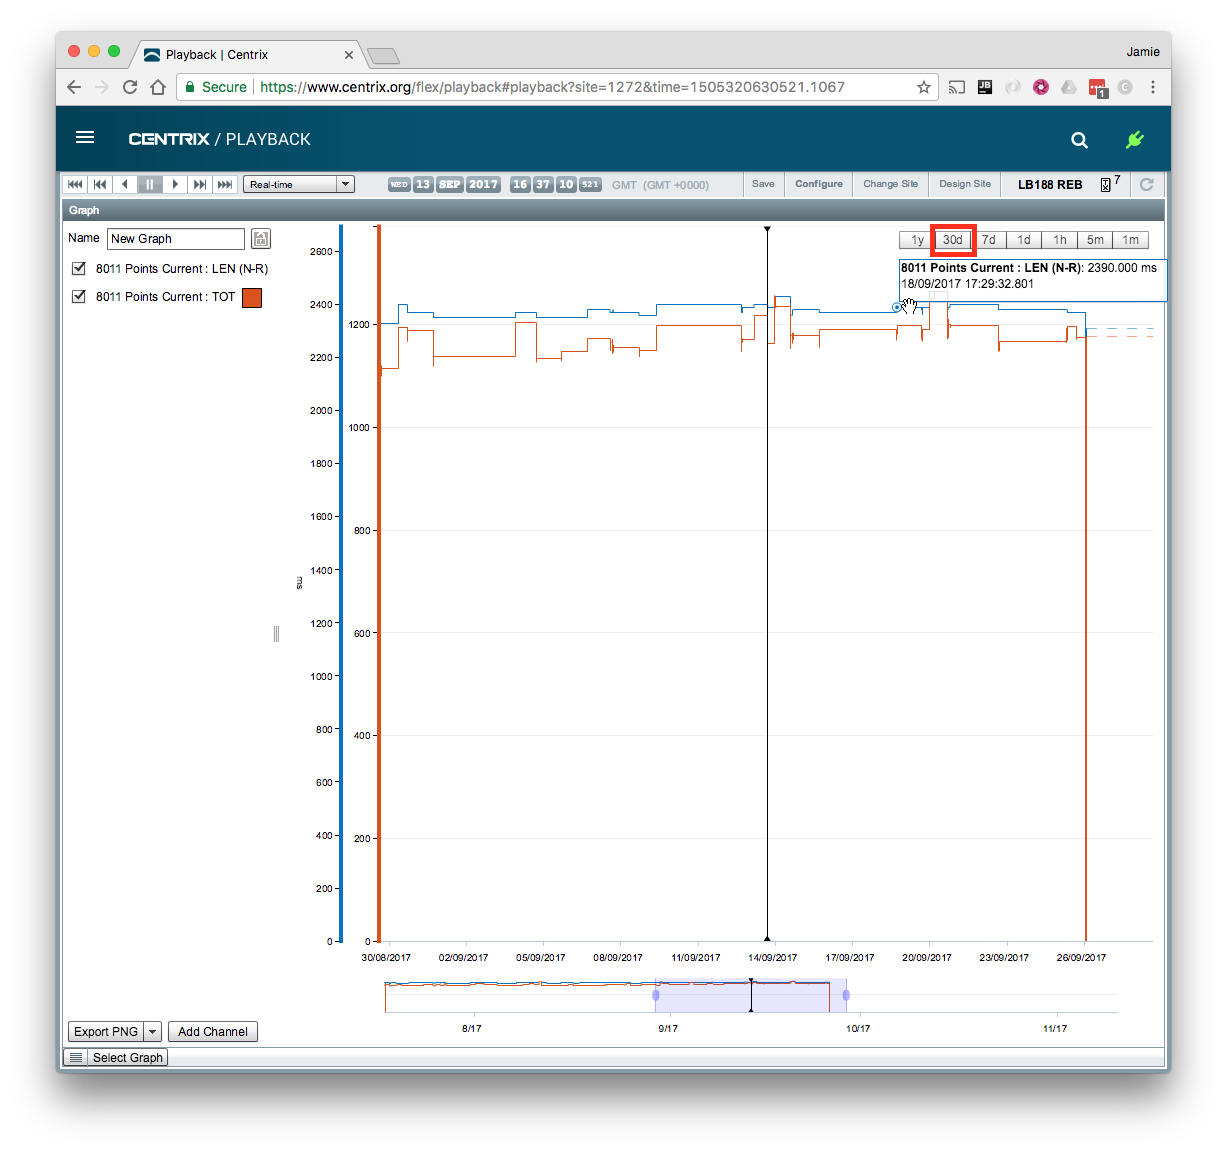
Tip: Give the graph a logical name (e.g. 8011 Points Features), so you can re-use it later.
Related articles