SA380TX-L Configuration & diagnostics software
- Martyn Emmett (Unlicensed)
- Mark Beeson (Deactivated)
Configuration and viewing of data is now carried out via the Web Configuration Tool which has older versions of “dPanel”, which was MPEC’s diagnostics and configuration tool designed specifically for the TX-L.
Instead of the windows application being used to configure and view data from the TX-L, a different application is used. When ran, this application offers connection to the TX-L over USB, Ethernet or GPRS.
After pressing connect, the web browser is automatically opened and directed to the web configuration tool page.
Installing “SA380TX-L dPanel”
There are two ways of obtaining MPEC dPanel:
1) Download the software from the MPEC web site (www.centrix.org/downloads)
2) Arrange automated installation with your IT department
Admin rights are required to perform installation.
A 'portable' version of dPanel is available in the same download as the installer. This version has identical operation to the 'installer' version, however it does not require installation onto your computer and therefore admin rights do not required.
Run “setup.exe” to begin installation.
When prompted with the following screen you may change the default install path.
If your normal Windows user account is not the administrators account, then ensure that “Everyone” is selected in this screen.
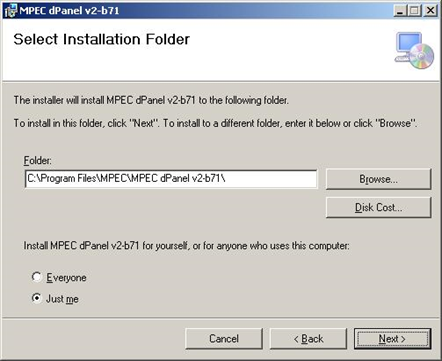
When installation is complete, just select “close”.
The “dPanel” software will now appear in your “Start” menu inside an MPEC folder.
Troubleshooting
dPanel requires a recent version of Microsoft’s .NET framework.
Windows should detect and download the required software should your PC be out of date, however, due to the complexity of the Windows operating system this download and subsequent installation can sometimes fail.
The .NET framework can be downloaded manually at the following web site:
http://www.microsoft.com/net/download/
Installing the SA380TX-L USB driver
When you first connect a TX-L to your PC the Windows “New Hardware Wizard” should automatically install the TX-L driver. If it does not, please follow these steps.
1) Power up the TX-L and connect the TX-L to the PC on a spare USB port with the cable provided.
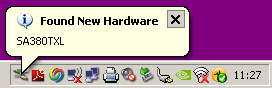
Windows will auto-detect the TX-L and launch the “found new hardware” wizard.
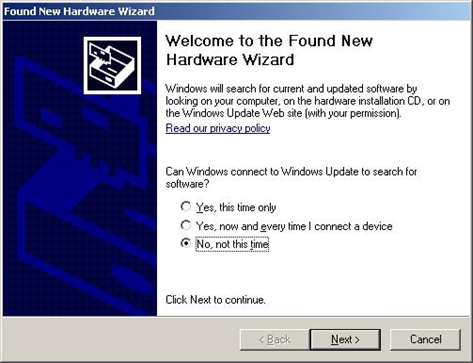
2) Select “No, not this time” when asked if you would like to use Windows Update to search for the driver; then click “Next”…
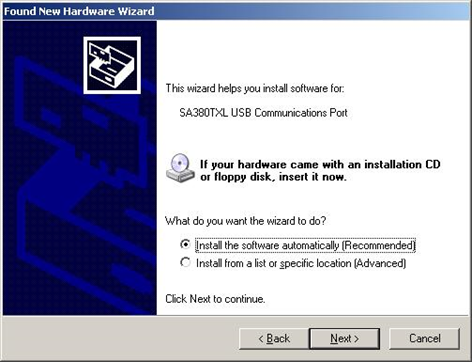
3) On the next screen select “Install the software automatically (Recommended)”; then click “Next”…
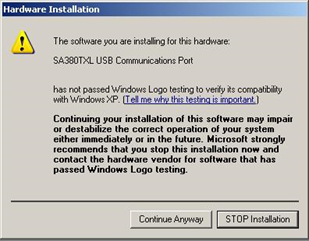
4) If prompted with this screen click “Continue Anyway”. This software poses no threat to your computer.
5) The installation will now complete. Click “Finish” when presented with the final dialog. Your SA380TX-L is now ready to use.
Connecting to the SA380TX-L
USB Connection
For local diagnostics, plug the TX-L into your PC using a standard USB cable and select “SA380TXL USB Communications Port” in the drop-down box. Click the “Connect” button next to the drop down box to establish a connection to the data logger.
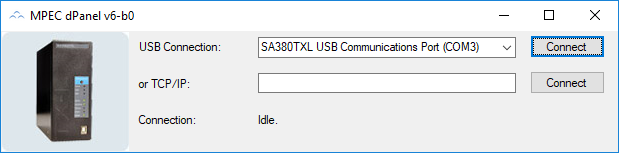
Clicking "Connect" will launch your preferred web browser, where the web configuration tool will be automatically loaded.
TCP Connection
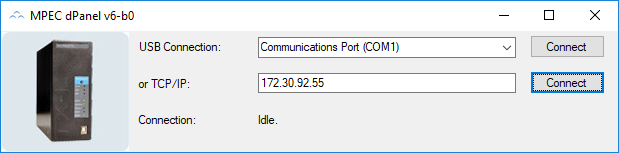
dPanel supports remote diagnostics over your chosen network, be it GSM/GPRS or Ethernet. When using dPanel on GPRS networks, please bear in mind that dPanel will behave slowly due to the low bandwidth of such data links.
To interact with a remote data logger, your TX-L must be assigned a fixed IP address, and you must know what that IP address is.
Contact your local IT support if you are unsure of your data loggers IP address.
To connect to a remote TX-L, enter the IP address of your data logger in the TCP/IP text field and click the adjacent "Connect" button.
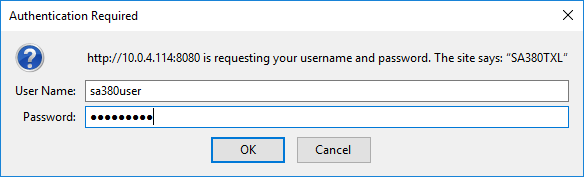
Clicking “Connect” will lauch your preferred web browser and then prompt you to enter a user name and password before permitting connection. Enter the credentials below then press “OK”.
Username: sa380user
Password: sa380user
Upon successful connection the web browser will automatically open the web configuration tool page.
The serial number of the data logger you are connected to is displayed in the top right corner of the page, in the "Unit" section, so you know you are connected to the correct TX-L.
Real-time data
These screens give an indication of the present state of all the inputs to the data logger. It is best used to check for correct installation or to quickly verify the status of a piece of equipment. For detailed data output, use the “historic” data functions of dPanel.
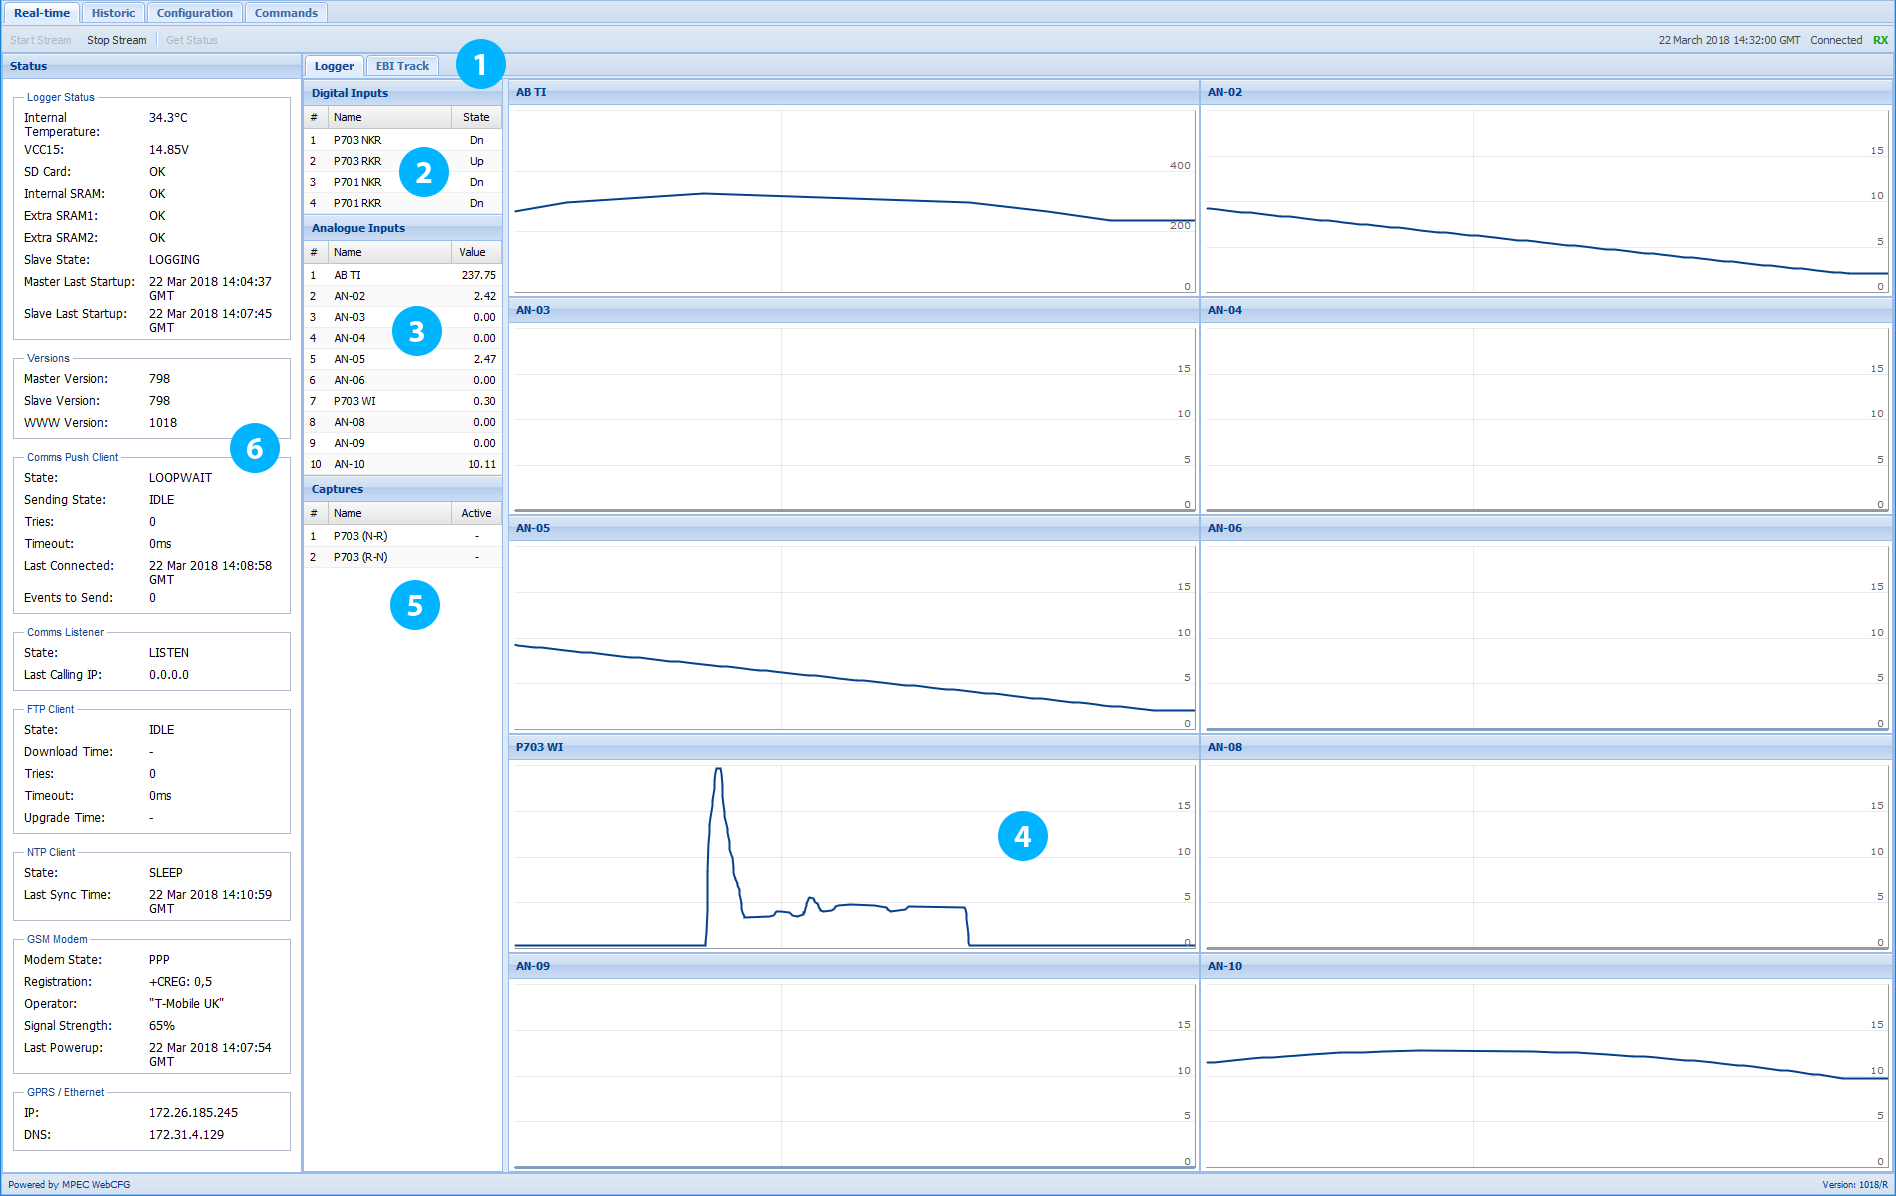
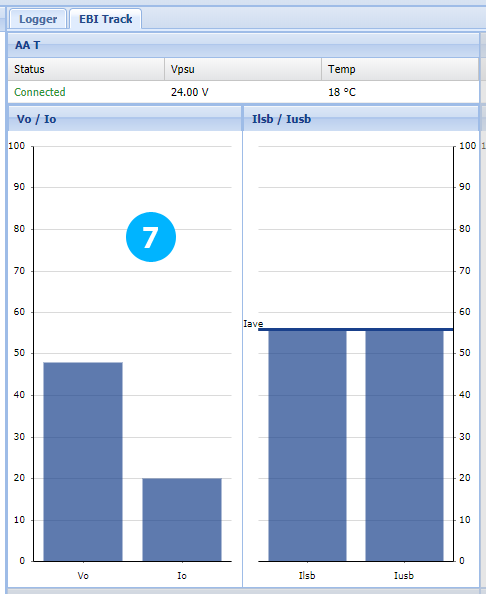
- Select either Real-Time Analogue & Digital or Real-Time EbiTrack display.
- Real-Time state of Digital Inputs (Up or Down).
- Real-Time Analogue values.
- Real-Time Analogue output. (For indication only – Use historical data view for precision monitoring.)
- Shows if a “Triggered Capture” waveform is being recorded at present.
- Logger Diagnostics Data.
- Real-Time EbiTrack Output.
Historic data
The historic data tab lets you explore the detailed data history of all input channels present on the TX-L.
Acquire-on-Change
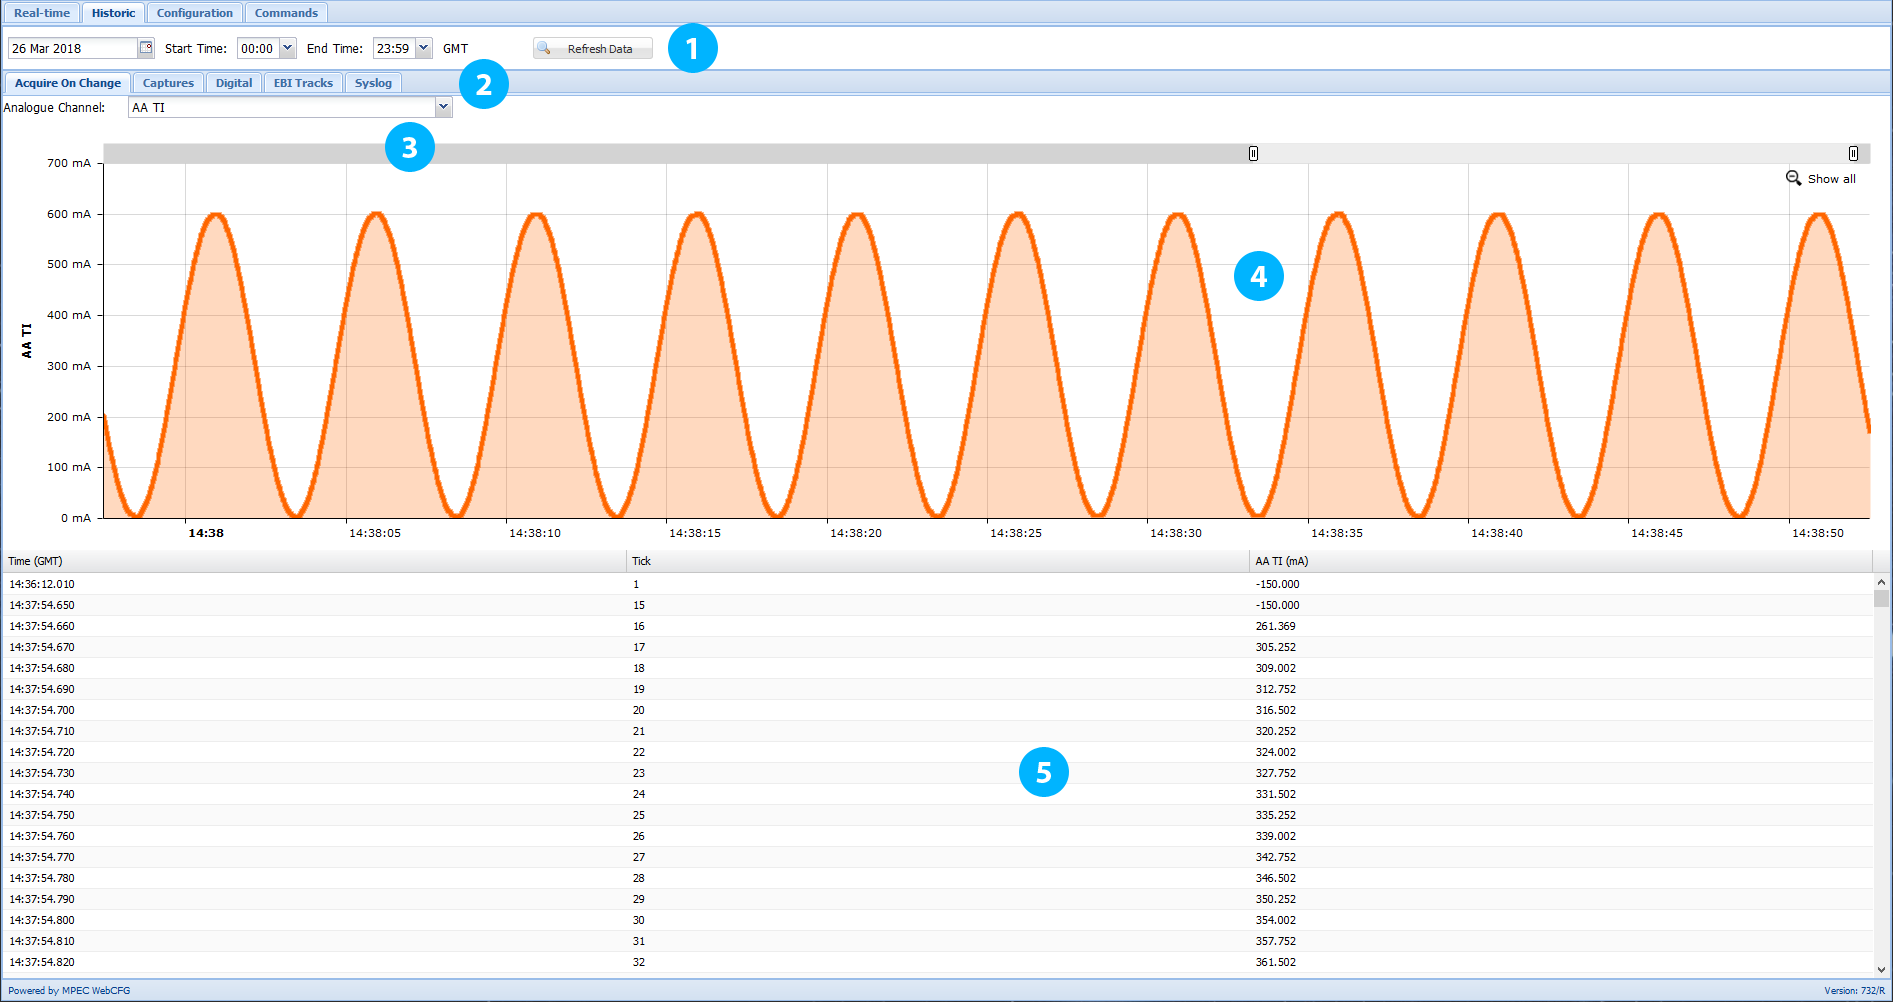
- You can retrieve up to 24 hours’ worth of data at a time. Select the desired date and time ranges here followed by a click on “refresh” to update the data display.
- Data views are available for Acquire-on-Change, Triggered Capture, Digital and EbiTrack inputs. The “Syslog” tab displays the TX-L’s system log.
- Acquire-on-Change data is displayed one channel at a time. Use these drop-down boxes to select which channel you wish to view.
- Graphical representation of the data. You may select a portion of the graph to zoom in on data of interest. Clicking a point on the graph will automatically scroll the data table to your selected point in time.
- Data is displayed in tabulated form detailing the exact timing of the event, the absolute sequence number of the event (or “tick”) and the value of the measurement. You can highlight by clicking on the first row of data you wish to select and then shift + clicking on the last row. By pressing ctrl + c on the selected data, a text window opens allowing you to copy and paste this data into 3rd party software (Excel, Notepad etc.) to export the data.
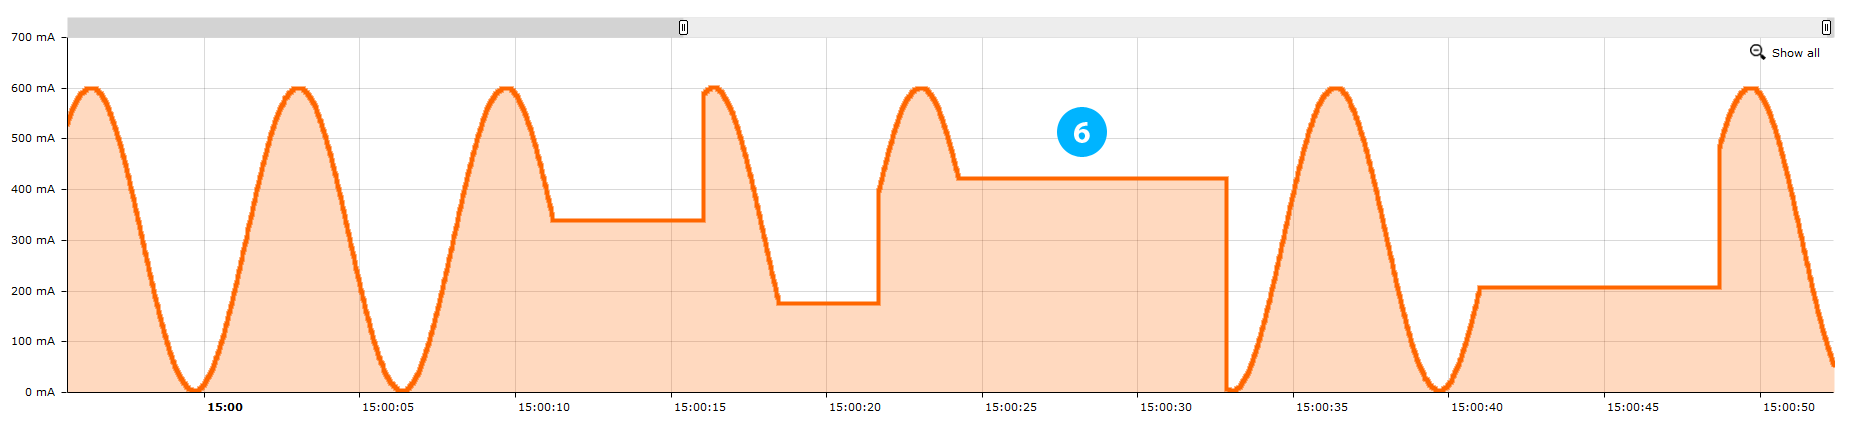
- When a triggered capture event takes place, the logger is unable to also record acquire-on-change data at the same time on the same channel; due to the limited write speed of the TX-L memory. Data is not lost, as the triggered capture will always contain more information than the acquire-on-change waveform.
While a triggered capture is recording the acquire-on-change data will show a flat spot where the apparent missing data should be. This data will be availble in the "Captures" tab.
Triggered Captures
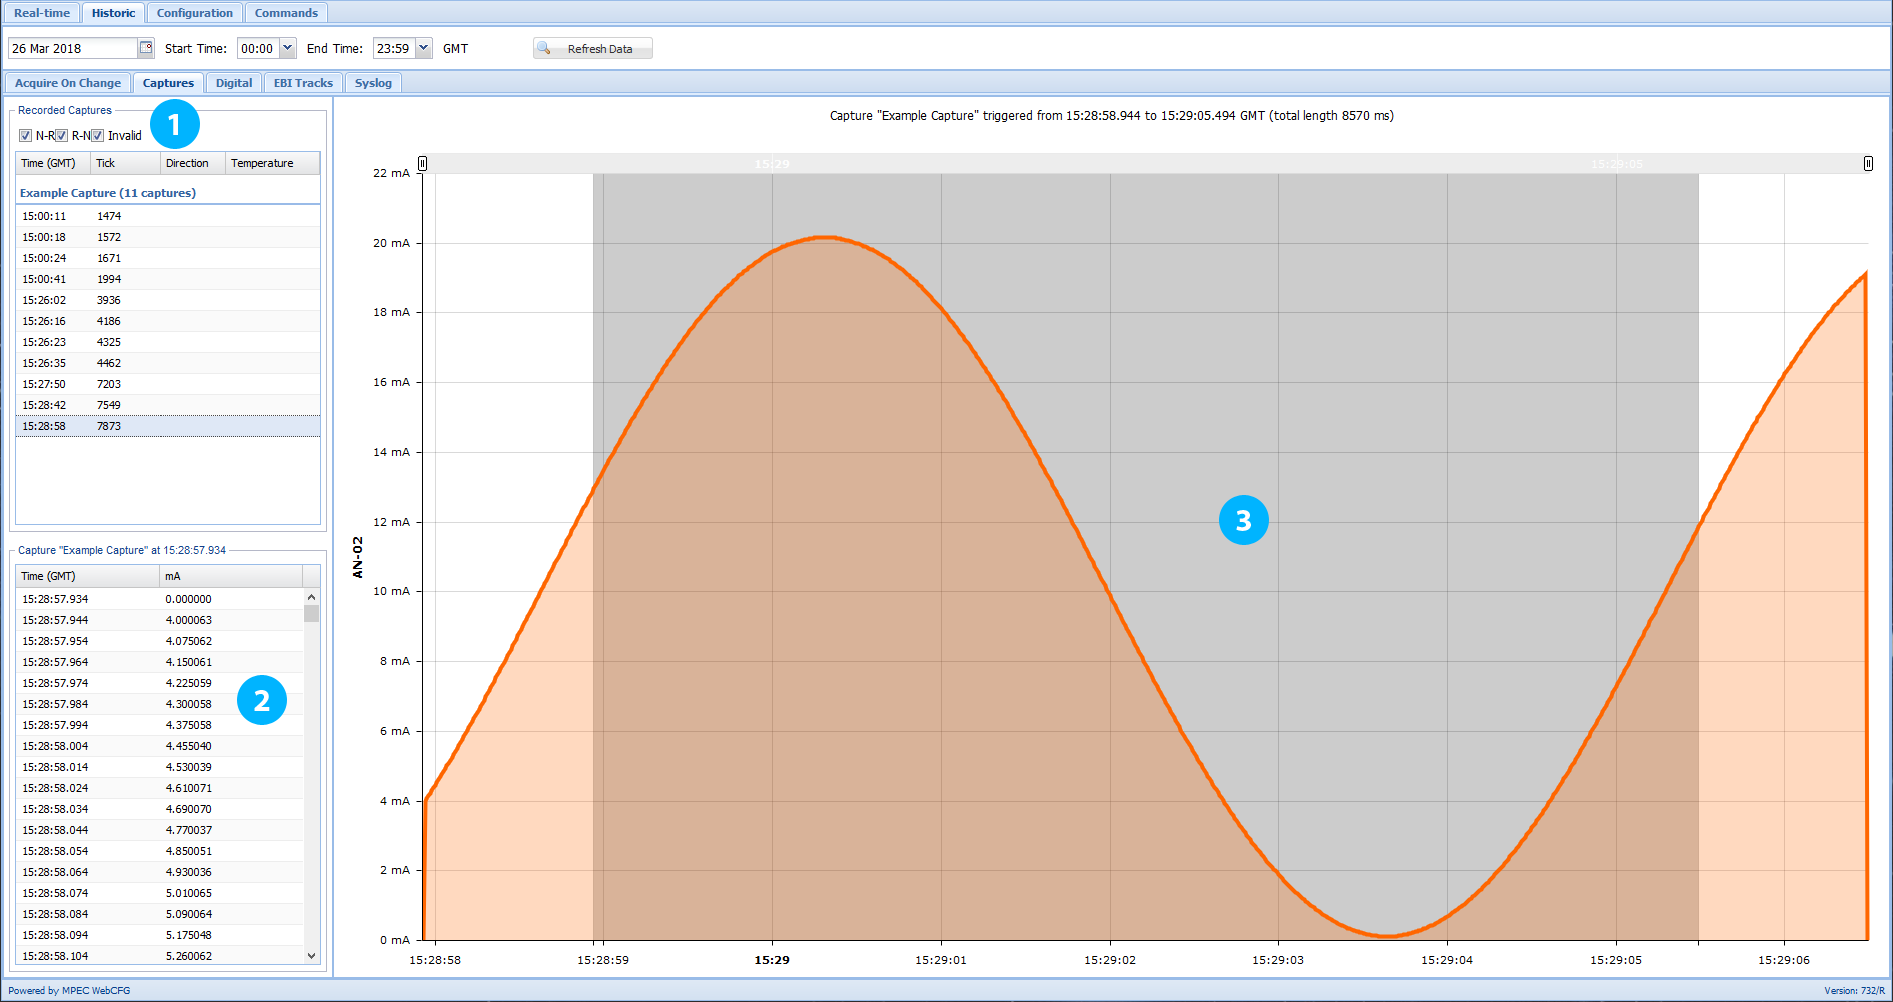
- A list of the individual triggered capture waveforms are listed in this table. You may filter waveforms based on thier direction using the check boxes. The time-stamp reflects the timing of the start trigger.
Double click on a waveform to load it into the capture display area. - A tabulated read-out of the triggered capture waveform is displayed in this table. The time-stamp reflects the time of the first sample. Copy and paste this data into 3rd party software (Excel, Notepad etc.) to export the data using the same highlighting method as for the acquire-on-change and pressing ctrl + c to open the text window.
- The selected triggered capture waveform is displayed in graphical form. The light blue region highlights the trigger window.
Digital
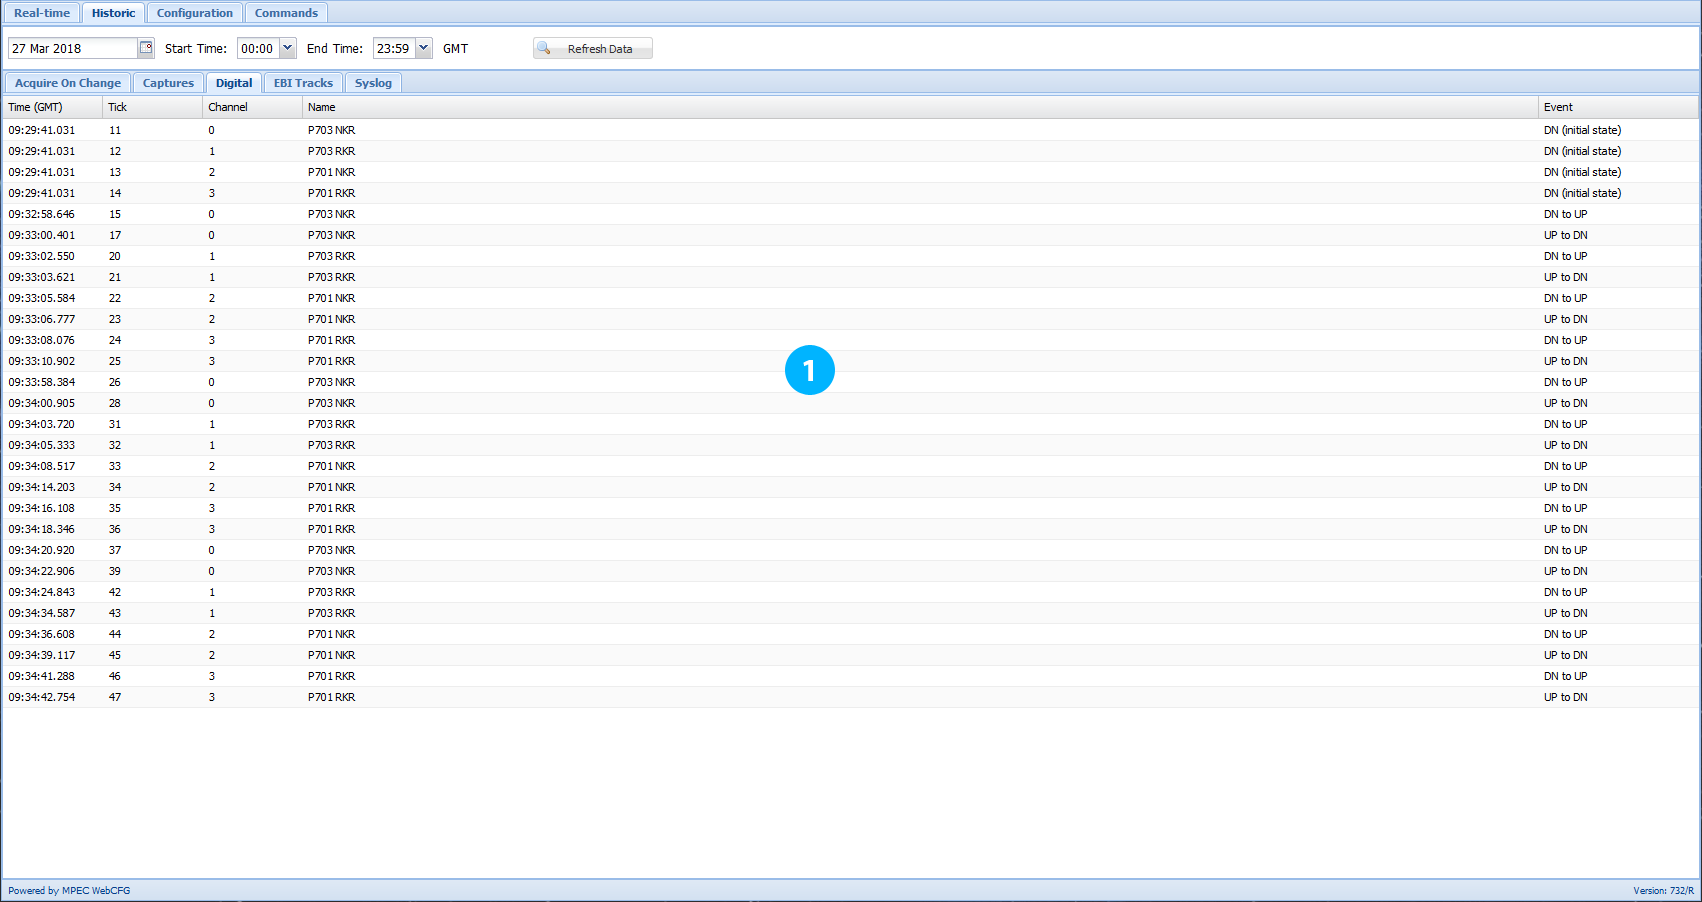
- Digital data from all channels is listed in tabular form. You can click on the column headings to sort by differing criteria. Copy and paste this data into 3rd party software (Excel, Notepad etc.) to export the data using the same highlighting method as for the acquire-on-change and pressing ctrl + c to open the text window.
EbiTrack®
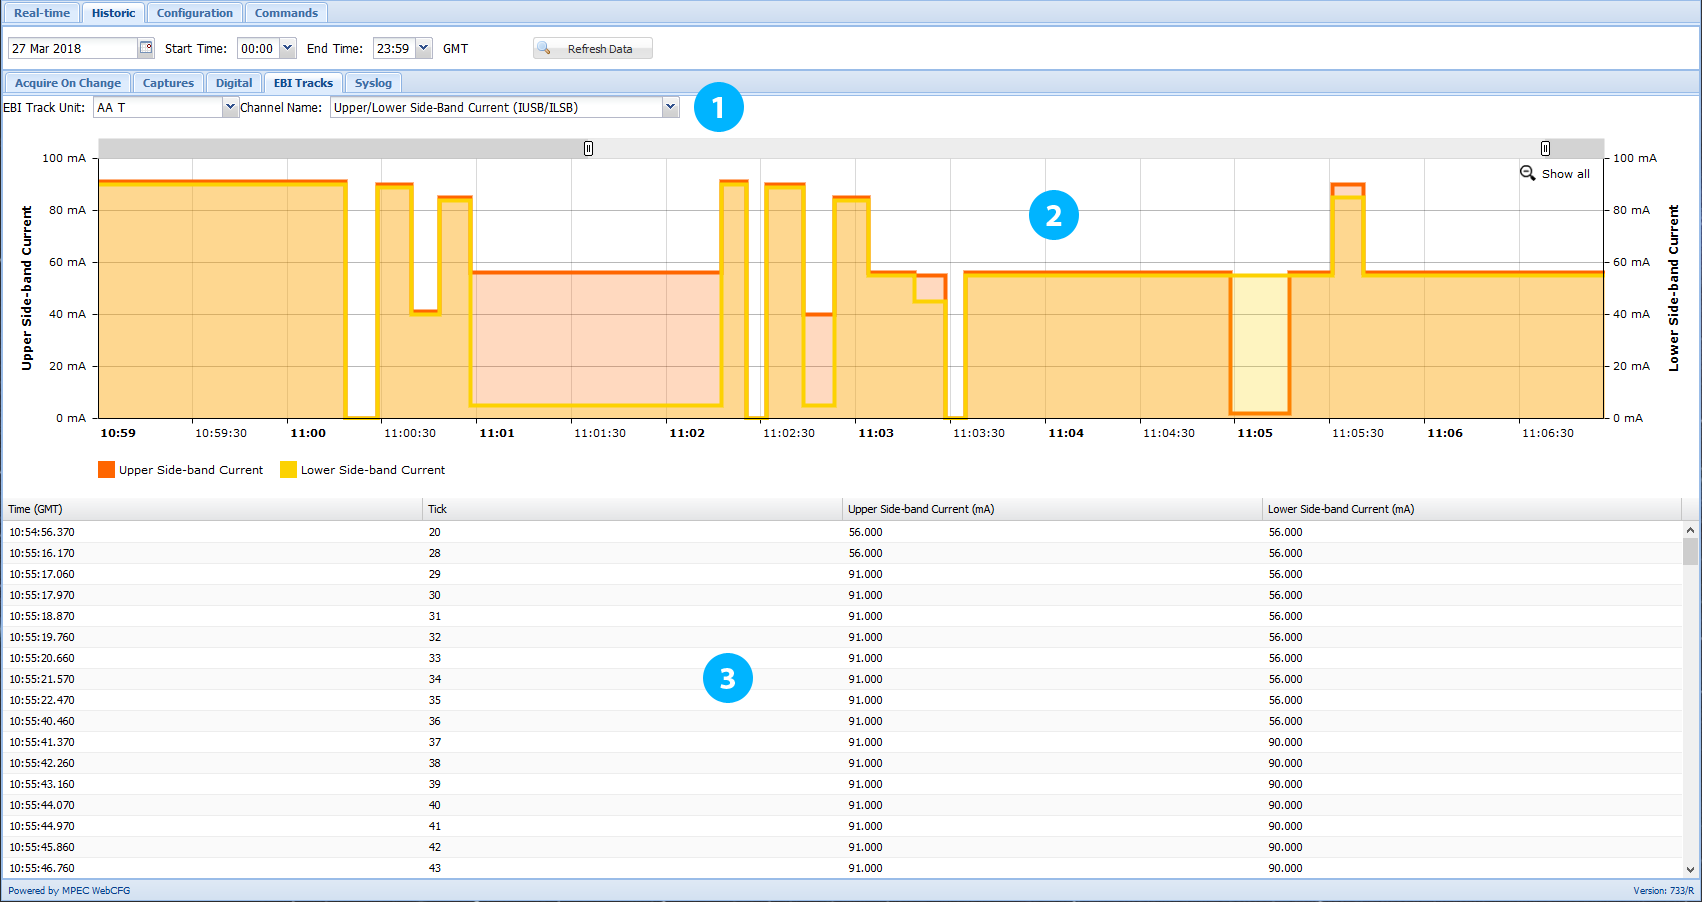
- Select the EbiTrack for which you wish to view historic data using the left hend drop-down menu. As numerous channels are monitored on EbiTrack digital units, you must also select the channel(s) you wish to view using the right hand drop-down menu. Please note that not all channels will be available on all EbiTrack models.
- Where appropriate, a graphical representation of the data will be visable in this area. Some channels display two data series, some one, and some – none at all.
- A tabulated read-out of the selected EbiTrack channel(s) is displayed in this table. Copy and paste this data into 3rd party software (Excel, Notepad etc.) to export the data using the same highlighting method as for the acquire-on-change and pressing ctrl + c to open the text window.
Syslog
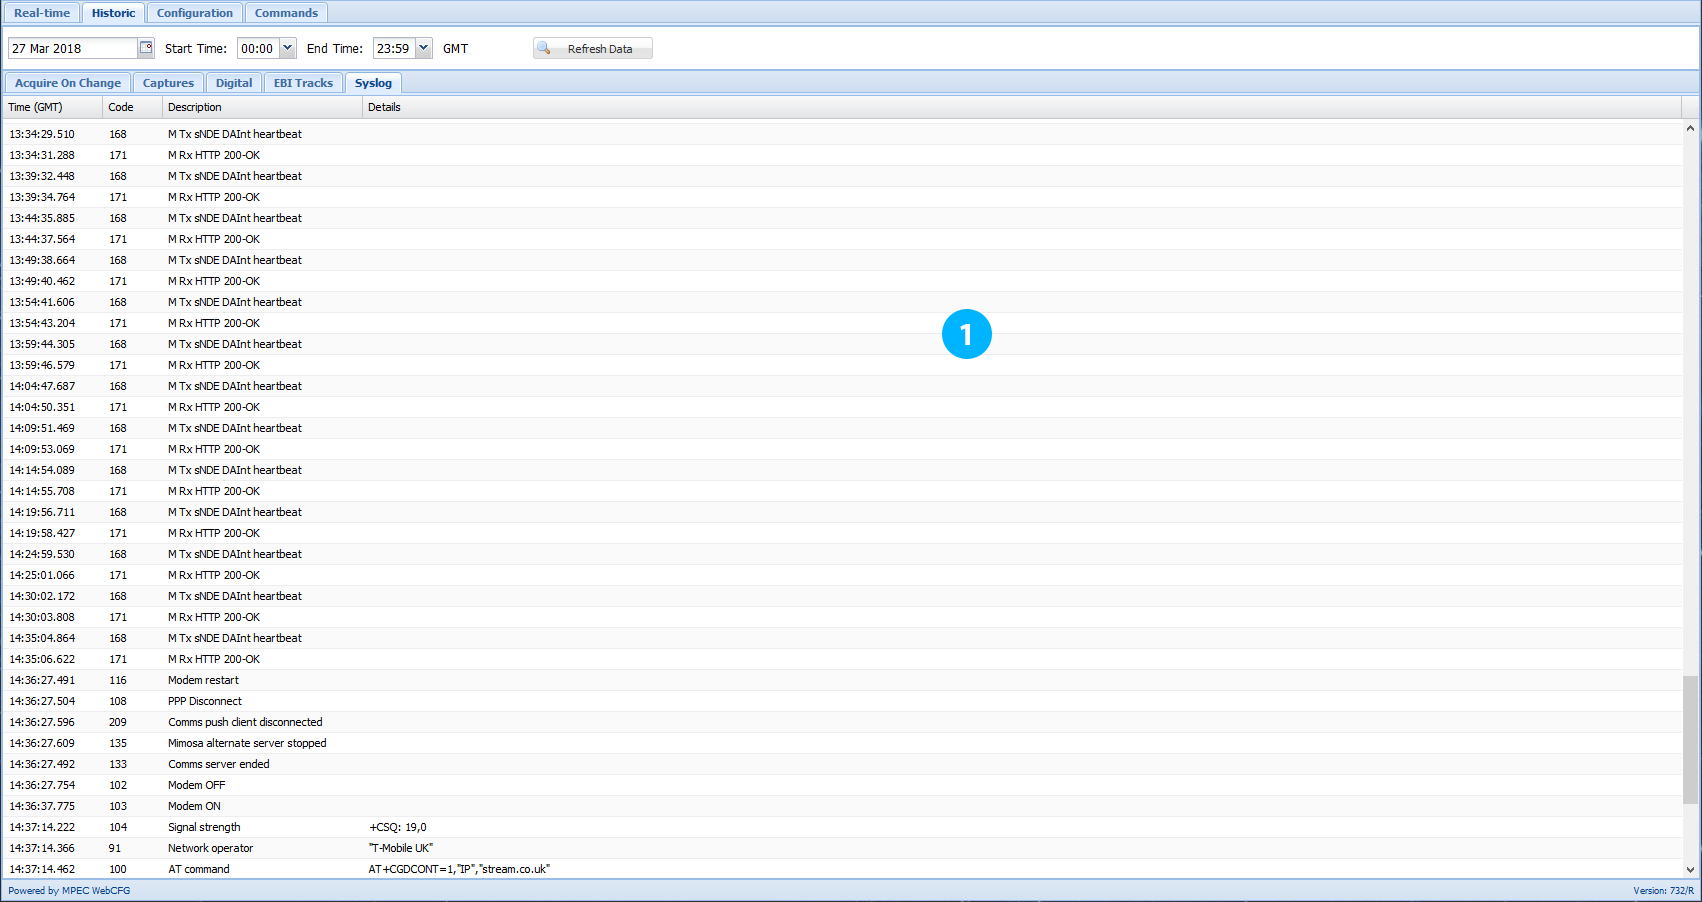
- The “Syslog” displays the diagnostic system log of the datalogger itself. This can be a usefull aid in diagnosing configuration and communiaction problems as well as detecting logger fualt conditions.
You can click on the column headings to sort by differing criteria.
Copy and paste this data into 3rd party software (Excel, Notepad etc.) to export the data.
Commands
A selection of useful commands for troubleshooting the TX-L. Use with caution – There is no “Undo”.
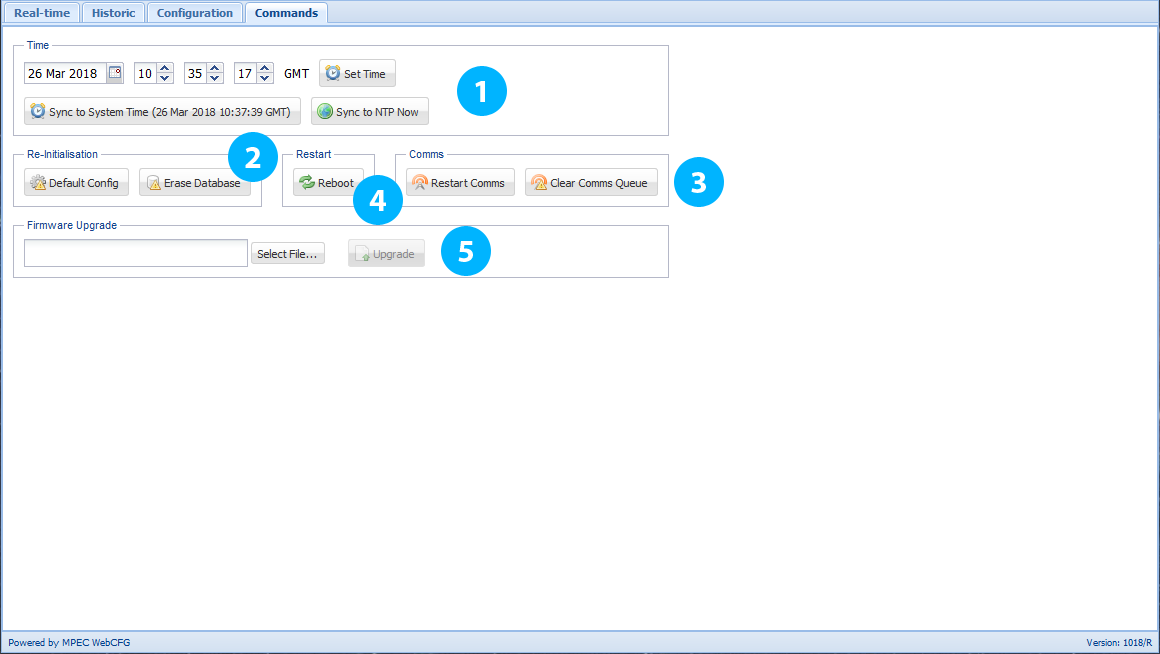
Time
Set Time - Allows you to set the logger time to any arbitrary time or date.
Sync to System Time - Set the TX-L time using your computers clock.
Sync to NTP Now - Force the TX-L to attempt synchronisation with a remote timeserver.
The Central data server sets the location of the timeserver; hence the logger must be connected to a central server system for this command to take effect.
2. Re-Initialisation
Default Config - Returns the TX-L configuration to its factory setting.
Erase Database - The will re-format the internal memory and will erase all data from the database forever.
3. Comms
Restart Comms - Forces the modem to immediately power-cycle and attempt reconnection with the GSM service provider and the central data server.
Clear Comms Queue - Clears any backlog of data that is pending sending to the central server system.
It does not erase this data from the database.
4. Reboot
Restarts the datalogger without a power-cycle.
5. Firmware Upgrade
Select File - Opens a file dialog to enable you to select a valid SA380TX-L firmware file.
When a valid file is selected the firmware version found in the file is displayed alongside the “active” version presently running on the TX-L.
This is to help the user determine that the correct file has been selected.
Upgrade - This commences firmware upgrade.
You may upgrade or downgrade the logger and even “over-install” the present firmware version.
The TX-L will reboot and drop its USB connection when firmware upgrade is complete. You must manually reconnect to the TX-L when the logger has completed its boot sequence.