Centrix Training Notes Nov 2016
- Jamie (Deactivated)
Training dates | 07 Nov 2016 - 09 Nov 2016 |
|---|---|
Delivered by | |
Description |
|
Contents
Active alerts
Managing your active alerts is the most important workflow to add into your schedule and/or processes. You can make use of e-mail alert notifications to receive instantaneous notifications when alert conditions are triggered, and/or you can use the Alerts screen in Centrix to see all the currently active (triggered) alerts and interrogate them.
Standard alert features
Centrix supports a number of preset alerts for various known rail faults/conditions. However, each alert shares the following standard profile;
| Alert name | A unique name for the alert, this will appear in the e-mail subject of any notifications. |
|---|---|
List of e-mail addresses that should receive e-mail notifications. Tip: Use labels to group e-mail addresses into logical groups, rather than using the e-mail field. Tip: Even when using labels for alerts, it is useful to use this when 'trialling' a new alert that you don't want e-mailing to other team members. | |
| Subscribed? | E-mail notifications will only be sent if this is ticked . |
| Suppression period | Use this to stop Centrix sending notifications for repeated alerts. Repeated alerts within the configured period will not trigger e-mail notifications, but will still appear in the alert history in Centrix. |
| Priority | Use this as desired to allow you to make a decision on prioritising active alerts. Tip: Use High/Critical for alerts on critical assets. Tip: You can setup multiple alerts for track circuits/points with High/Low thresholds. |
| Labels | Labels are used to group alerts into their associated teams. They can also be used for informational purposes. Labels can have e-mail addresses attached to them which will define who should receive e-mail notifications for the alert they are attached to. |
Alert listing
The alert listing (access through the Alerts menu link) shows all configured alerts within your user group.
For managing active alerts, you should select the Active Only filter at the top of the listing.
To view only the alerts for your team, filter the listing by Label using the Filter by Label filter at the top of the listing. You can select more than one label if desired.
Tip: If you have a lot of active alerts and not currently in a position to clear out older ones, sort the listing by Last Triggered (descending) to see the most recent alerts first. Click on the table column header to change the sort.
Each alert will have 1 of 3 possible statuses;
 | Clear | Alert has not triggered since it was last cleared or created |
 | Active | Alert has triggered since it was last cleared or created |
 | Active - Returned Normal | Alert has triggered since it was last cleared or created, but it has since returned back outside the threshold conditions This feature only applies to the Points alarm type. |
Start your investigation
Double click on any alert to see the history of alert raises (triggers). Here, the Message will provide you with details about why the alert triggered.
Click the  button in the Actions column to open the graphical replay panel at the point in time the alert triggered.
See the section on Graphical replay for further details.
You can save a Bookmark for any alert raise by clicking the  button in the Actions column. This is useful if you want to quickly return to the fault in the future, or you want to share it with a colleague. More on Bookmarks later.
Clearing alerts
Once you are done dealing with an alert, you should clear it so it no longer appears in the listing of active alerts.
You can clear a single alert by clicking the  button in the Actions column of the alerts listing.
You can clear one or more alerts using the Bulk Clear action found in the bulk actions drop down at the bottom of the listing. First select all the alerts you want to clear, then click this action.
Graphical replay ("Playback")
The graphical replay panel is the heart of the Centrix system and provides a configurable panel for viewing various types of data and Centrix features on a single screen.
There are a few methods to access the graphical replay panel, depending on your starting point;
From the dashboard
When your first enter Centrix, you are presented with a simple screen that allows you to select a Site and a Date/Time to view data from.
From the sites listing
On the Sites listing you can double click on any site to open the replay panel. The panel will open at the current date and time.
From an alert raise
When viewing the raises of an alert, you can click the button to open the replay panel at the date/time the alert triggered.
From a bookmark
You can open the replay panel at the date and time of a saved bookmark by clicking the button on the bookmarks listing.
Replaying data
The top bar of the replay panel contains some playback controls that allow you to control the automated playback of event data;
 | |||||||
| Jump back 1 day | Jump back 1 hour | Play backwards* | Pause replay | Play* | Jump forward 1 hour | Jump forward 2 hours | Select the play mode |
* Play (forwards or backwards) will automatically replay the data in the mode selected in the drop down (real-time, real-time*10 or event step)
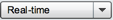
Play modes
| Real-time | Plays the events through in real-time as they occurred |
|---|---|
| Real-time * 10 | Plays the events through at 10x speed as they occurred |
| Event step | Plays the events through one by one at a fixed interval |
Current date/time
The current date/time is shown in the centre of the top bar. When the data is playing, you will see the time ticking forwards/backwards depending on the selected play mode.
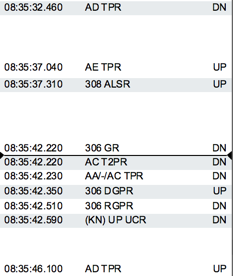
Each panel has a black bar in the centre which indicates the current date/time in the data set. The item before the line is the last item that occurred before the current date/time, the item after the line is the next item that will occur once the date/time reaches the time of that item.
Example;
Current date/time:
![]()
Digital events panel:
Manually stepping through events
You can use the scrollbar on any of the event panels to scroll through the data;
Click the up/down arrows to move one event at a time.
Click within the scrollbar to quickly move up/down the events.
Click and drag the scroller to move to a specific position in the event listing.
Scroll with your mouse wheel to move through the events.
You can also use the arrow keys and page up/page down functions on your keyboard to move through events. Make sure you click within the box first to select it.
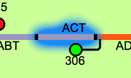
Map
The map provides a facility to visualise the raw data in a human understandable way. Centrix provides a number of widely used railway assets that can be attached to relay functions and displayed on the map based on relay logic.
Any channel monitored in Centrix can be displayed on the map, even where there isn't a specific railway asset type for it. You can display relay functions as on/off or up/dn indicators which various colour configurations. Analogue data can be visualised as a numeric value or as a gauge.
The current status of the map indicators will be based on the current date/time selected. If the current date/time is now, or in the future, then the map should show the current live status of all assets on the site (minus any lag between the data logger and Centrix).
If you want to use the replay panel as a "live display" of the site, you should select a date/time in the future, then hit the Play button. This will ensure the current time is ahead of all events, so the most recent events will always be represented on the map as they are received from the data logger. This could be used in an operations environment as a subsidiary system.
Hover you mouse cursor over any item on the map to display the functions that are attached to it, and their current status.
Widgets and features
This section describes each widget panel on the replay panel and what features they provide.
Adding/removing widget panels
Widgets can be added and removed from the replay panel by clicking the Configure button in the top right of the panel. Tick or untick widgets to add/remove, then click Apply. Clicking Apply and save will save the configuration for future visits to that site.
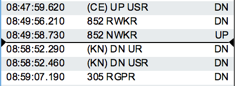
Digital Events
The digital events widget shows all the relay function events received from the data logger, displayed as;
| Time (including milliseconds) | Function | State (boolean)* |
|---|---|---|
| 08:33:42.030 | AK TPR | UP |
*UP = Up | Picked | 1 | True | On
*DN = Down | Dropped | 0 | False | Off
Filtering channels
By default, the listing will show events from all the functions available on the site. You can filter by a specific set of channels by clicking the  button in the bottom of the widget.
You can click and drag around the channels you want to filter on the map.
Or, you can manually select/de-select the channels in the listing.
Click Apply Filter to apply the filter.
Show events with time context
By default, the events are displayed in a simple listing, without any context of time between various sets of events without looking at the time of the events.
You can enable time spaced mode on the event listing by clicking the  button at the bottom of the widget. Gaps will now be shown between events, relative to the amount of time there was between them. This allows you to easily see which events occurred around the same time, or where there was a gap between events.
Locate a function on the map
If you want to find a function on the map from an event, select the event in the listing and click the  button. The map will centre on the object that represents that function and will highlight it for a short period of time.
This is particularly useful for larger sites, or on sites you are not familiar with.
Bookmarks
The bookmarks listing shows the bookmarks that have been created on a site in a time series, similar to the digital event listing.
You can navigate to the date/time of a bookmark by scrolling through the listing, just like you would for the digital event listing.
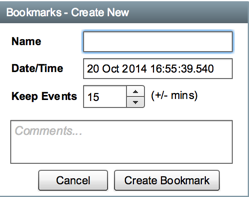
New bookmarks can be created by clicking the  button at the bottom of the widget. The current playback date/time will be used for the bookmark date/time, though you can change this manually if desired.
![]()
Alerts
This alerts widget displays a time series of all alert raises for the site. You can scroll through them to jump to instances of an alert raise.
The alert widget is a useful widget to apply and save on a site.
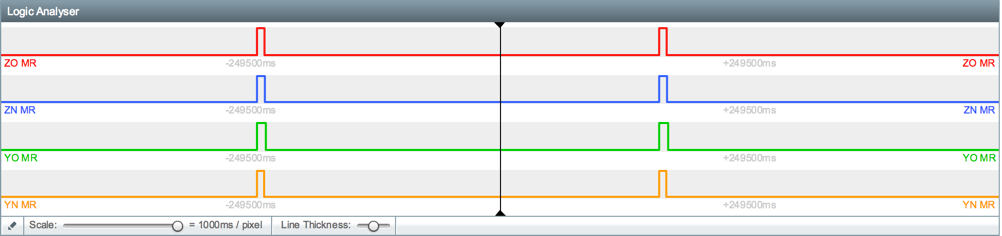
Logic Analyser
The logic analyser widget provides a way to view the digital logic on a time series, allowing you to compare the pick/drop times of a set of relays.
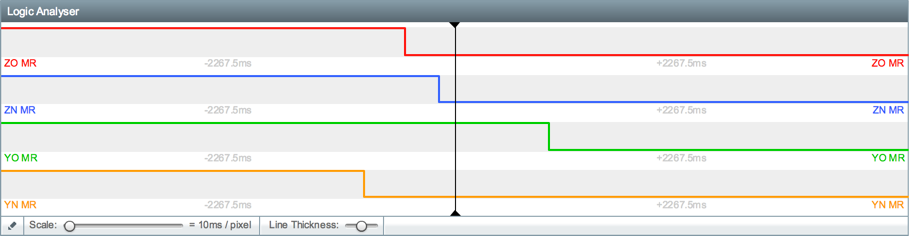
The current time is shown by the vertical black bar (like the horizontal bar on the event list, bookmarks and alerts list).
You can amend the functions that are shown on the analyser by clicking the  button at the bottom of the panel. Select channels in the available or active listings and click the <-- and --> buttons to add/remove channels.
Change the displayed time window by adjusting the Scale using the slider at the bottom of the panel.
Maintenance Windows
Maintenance windows are used to schedule maintenance (either one-off or regular) periods. They are used to suppress any alerts that may occur during maintenance, and to ensure that data collected during maintenance is not used as the inout to any automatic alarm threshold training (more on that later).
If any alerts firing during a schedule maintenance period, they will be suppressed in the system with the reason "maintenance", so you can still see them in the alert history, but e-mail notifications won't be sent.
The widget will show all the configured maintenance windows for the site; past, present and future.
Create a maintenance window
Click the button at the bottom of the panel.
Enter the starting date/time for the maintenance, and select how long the maintenance should last for.
You can put the whole site into maintenance mode by selecting the Suppress all channels option.
Or, you can select individual channels to put into maintenance by selecting them in the Available channels listing and clicking the  button.
You can also select channels on the map by drawing a box around the assets you want to put into maintenance mode, then click the Add map selection button.
If the maintenance is one-off, then simply enter a reason (optional) and click Save.
If the maintenance is regular (e.g. every week, every day), then click the Repeat checkbox and select the interval of the repeat (e.g. 1 day for every day, 7 days for once per week).
Create a repeating nightly maintenance window to automatically suppress permanent-way maintenance generated alerts during non-operational hours.
Bookmarks
Bookmarks provide a method of saving and labelling a point in time for a site. A common use case may be to correlate a reported incident with the associated data in Centrix.
For convenience, Centrix provides the following three methods for creating bookmarks;
From the bookmarks listing
Select Bookmarks from the main menu and click the  button at the bottom of the listing. You will need to provide a name for the bookmark, and select a site to attach it to. By default, it will select the current/date time as the bookmarked time, but you can change this to your desired time.
Enter comments to store more detailed information about the bookmark - useful if you want to share some information for colleagues.
Click Save Changes.
From the playback panel
This method is useful when you're in the graphical replay panel and have located an incident or event that you wish to bookmark.
Make sure the Bookmarks widget is enabled by clicking Configure, tick Bookmarks and click Apply.
In the bookmarks widget panel, click the button. The current playback date/time will be set as the bookmark time, but you can manually adjust this if desired. Enter the bookmark name and comments then hit Save.
From the alert raise listing
If you want to create a bookmark for the date/time of a Centrix raised alert, you can do this from the Alert Raises listing in the Alerts screen.
Double click the alert in the alerts listing to open the raise history. On the raise you want to bookmark, click the  button. This will take you to the Create Bookmark panel, with the date/time pre-filled as the time the alert was raised.
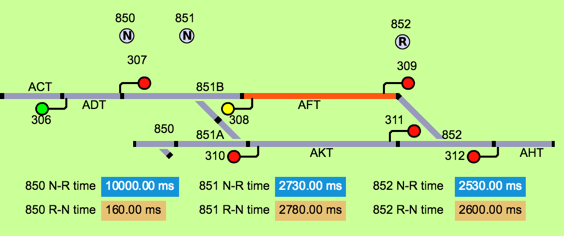
Virtual channels
Centrix provides the ability to create virtual channels based on simple boolean logic to combine multiple functions into a single digital output. Centrix also provides a timer function to time between two functions which will provide an analogue (time duration) output value each time the condition is met.
The details for creating virtual channels is well documented here; Creating Virtual Channels.
Useful examples;
Combine all lamp checking relays into a single function for simpler alarming.
Lamps Out = not ([dip:214 ECPR] and [dip:215 ECPR] and [dip:216 ECPR])
Time between points detection relays to calculate swing times.
800 N-R Time = time_between([dip:800 NWKR]DN, [dip:800 RWKR]UP, 10 secs)
Time between level crossing barrier relays to calculate barrier raise and lower times.
YN Raise Time = time_between([dip:(YN) MR ZPR]UP, [dip:(YN) MR ZPR]DN, 20 secs)
- Time between level crossing barrier close to barrier open to calculate road closure times.
- Time between level crossing strike-in to track circuit occupation to calculate warning times.
- Time between track circuit occupied to unoccupied at station platforms to calculate dwell times.
- Time between successive track circuit occupations to calculate train speed.
Reporting
Centrix provides a suite of reports that have multiple uses. They are accessed through the Reports main menu.
Report types
| State transition counts |
|
|---|---|
| Raw digital events |
|
| Analogue histogram |
|
| Sequence timing |
|
| Points swing count |
|
| Points alarm thresholds |
|
Examples
Below are some example operational questions that the reports can answer, but there are many more;
How many times do barriers operate at a given level crossing?
| Report | State Transition Counts |
|---|---|
| Conditions |
|
| Output | 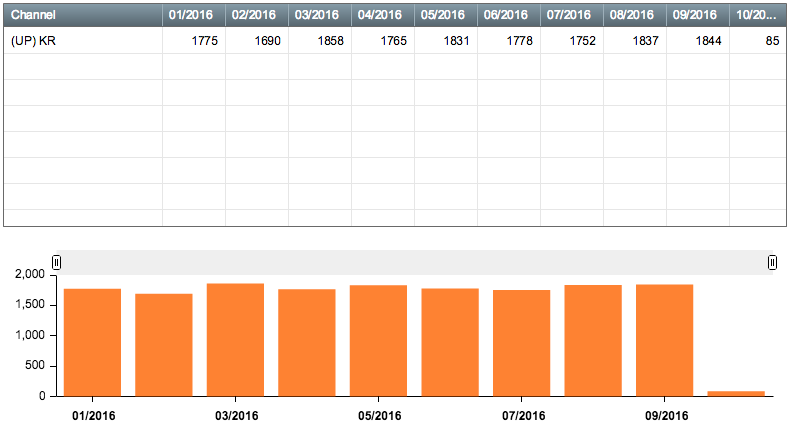 |
| Analysis |
|
What is the average arrival time at a given AHB crossing? What the deviation from that average?
| Report | Analogue Histogram |
|---|---|
| Conditions |
|
| Output | 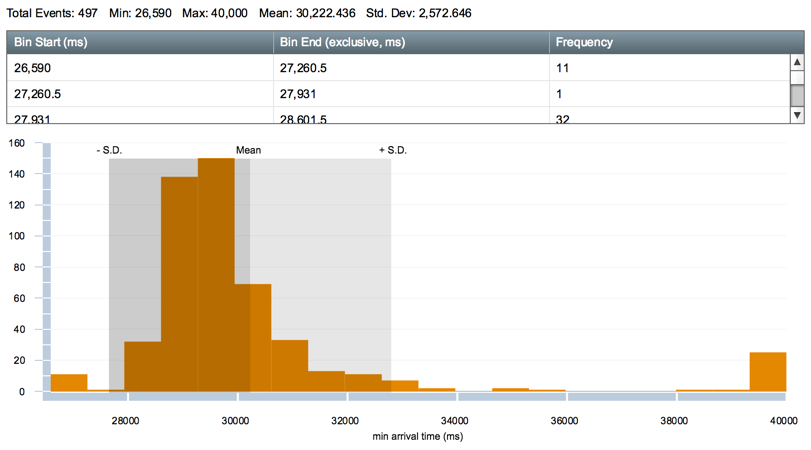 |
| Analysis |
|
What is the road closure time at a given crossing?
| Report | Sequence Timing |
|---|---|
| Conditions |
|
| Output | 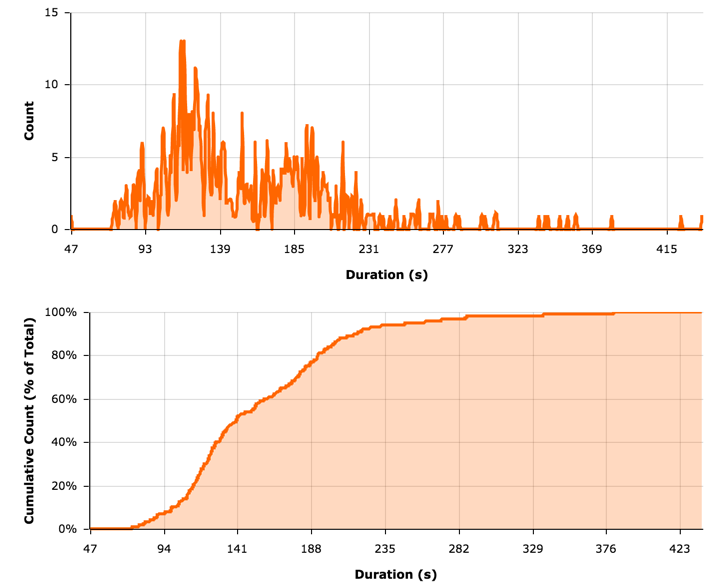 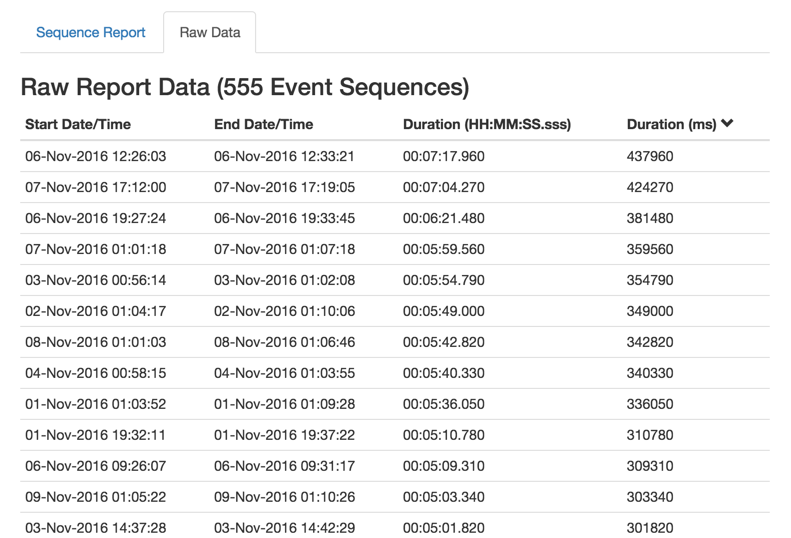 |
| Analysis |
|
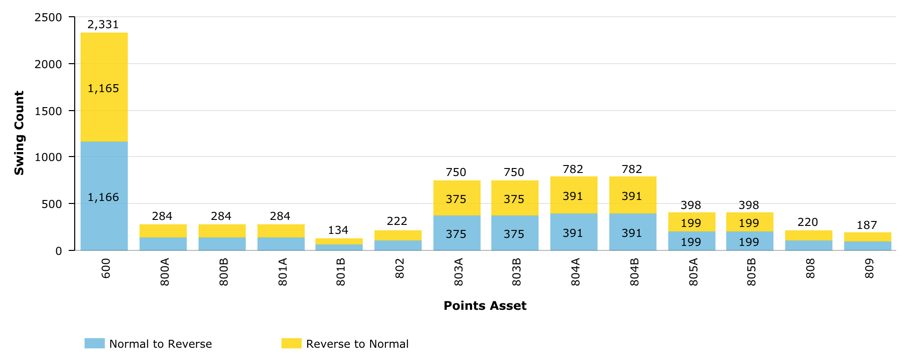
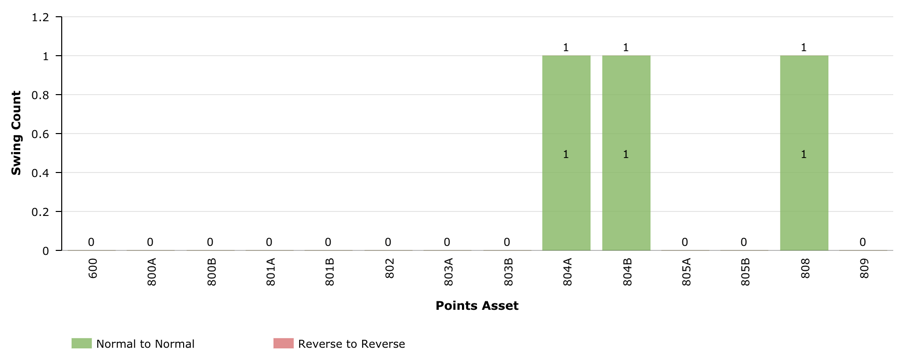
What is the usage (number of operations) of all the points assets for a given site?
| Report | Points Swing Count |
|---|---|
| Conditions |
|
| Output |
|
| Analysis |
|
Points RCM
Centrix provides remote condition monitoring facilities specifically designed for points machines. To monitor points machines, you will need to make use of either the SA380TX or SA380TX-L data loggers which provide analogue inputs.
Once configured, the data logger will send Captures to Centrix each time a points movement is detected. This data is bundled into a single high-resolution waveform at a fixed interval, usually 10 milliseconds.
Background
The general profile of the current draw from a points machine, looks like this;
(y-axis is current draw in amps, x-axis is duration in milliseconds)
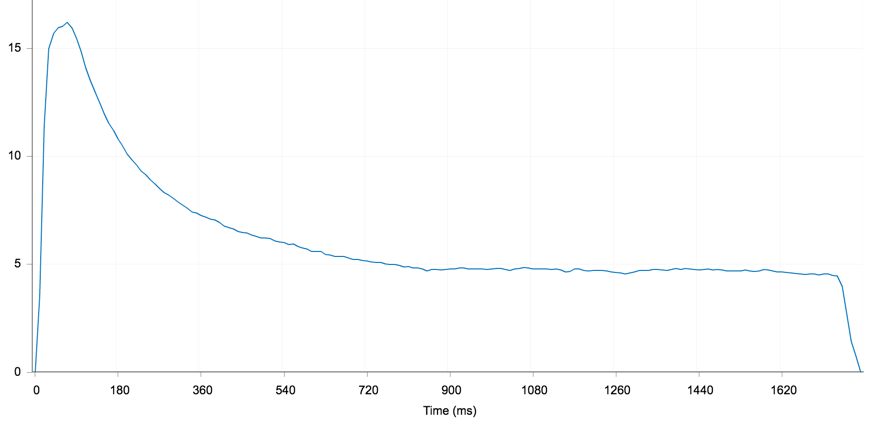
When the profile moves away from the baseline, it can indicate that maintenance is required and/or a fault is developing.
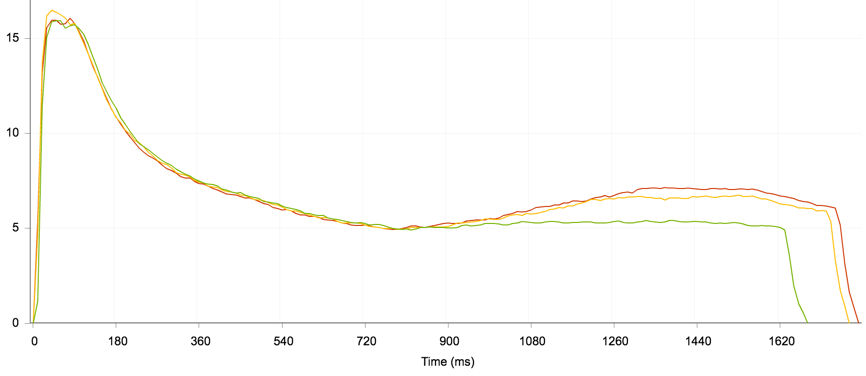
Certain aspects of the profile can indicate specific fault conditions. Whilst Centrix doesn't currently have a facility to provide any insight into the type of fault, by developing a catalogue of known fault traces and their relevant traces, engineers can use that to inform maintenance.
Inspecting captured traces
Centrix provides a simple facility for viewing the traces and comparing them on a graph like above. This is accessed through the Captures menu link.
First select a site with points RCM, then select the points asset you want to inspect data for.
Centrix will show a list of all the most recent captures for the selected asset, showing; date/time of the capture, direction of the movement and duration of the movement.
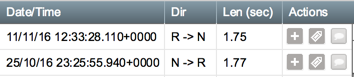
Double click on any capture in the list to view the profile on a graph. Repeat this for multiple captures to compare.
You can add captures from different assets or sites if desired, just select a different asset and double click on the captures you want to add. The graph in the right hand panel will keep all the selected traces until you clear it or reload the page.
You can export the graph as an image (jpeg or png) using the Actions drop down at the top right. Useful if you want to send it by e-mail, or save a copy offline.
Setting baselines
To support the analysis of a potential fault trace, it is useful to be able to compare any selected trace against a known "good" trace, or baseline.
In the capture listing you can tag a trace as a baseline by clicking the  button in the Actions column. Centrix provides two baseline types; maintenance baseline and major baseline. You can use either, as desired.
You can find baseline traces by select the tag in the tag filter above the capture listing.
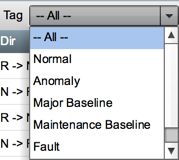
Tagging faults
Similar to setting baselines, you can also apply a Fault tag to known fault traces. This will help towards creating a catalog of known faults and what caused them. You can add comments to any trace to provide additional information about the fault (or baseline) by clicking on the  button in the Actions column.
You can find fault traces by selecting the tag in the filter list as described above for baselines.
Configuring alerts
Centrix has an alert type specifically designed for monitoring points machine captures. It provides the ability to create thresholds on the following features of a capture trace:
| Average | Average current draw taken from all the samples in the trace |
|---|---|
| Duration | Duration of the trace (i.e. swing time) to the millisecond |
| Maximum | Maximum current draw (this will be skewed by the in-rush for motor current traces, more on this later) |
| Total | Total current draw, calculated as a sum of all data points in the trace (there is a data point every 10ms) |
Whole trace thresholds
When setting up a threshold for points traces, we recommend only configuring thresholds for Average and Duration.
Maximum is only going to detect changes in the in-rush, which does not generally give indication of any common fault types. Total is likely to cause false alerts, or duplicate alerts that would always be picked up by the duration and/or average thresholds anyway.
Episodes
In many cases, you want to set a threshold for a certain region within the trace, rather than the whole trace. This is particularly true for alerting on points machine current traces, where you want to threshold on "maximum current draw" but need to exclude the in-rush.
Centrix performs a matching algorithm on every trace that is processed to best fit the configured episode(s) to the trace, and uses that to work out the region that should be checked against the alarm thresholds.
When setting up thresholds for the above episode, we recommend only configuring a threshold for Maximum.
Manual threshold configuration
If you have specific threshold values you want to use for an alert, you can create/edit them manually using the Points alert type in the Alerts page.
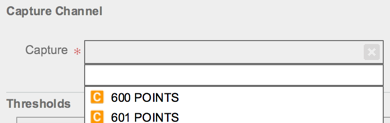
Click the drop down in the lower left of the screen to create a new alert and select Points for the alert type.
Fill in the general alert configuration on the left hand side.
Select the channel (asset name) you want to configure thresholds for.
Then, using the Add button under Thresholds you can add thresholds for each swing direction (N-R and R-N).
- Select the direction the threshold should apply to, or select --Any-- to use the same thresholds in both directions.
- Leave Episode empty to apply the threshold(s) to the whole trace, or select an episode to apply the threshold(s) only to the selected episode.
- Enter the lower and upper boundaries for the features you want to create thresholds for (see our recommendations).
- Click Save
If you follow our recommended thresholds for points RCM, you should have 4 thresholds as follows;
- N -> R, no episode; duration upper, average upper
- R -> N, no episode; duration upper, average upper
- N -> R, in-rush excluded episode; max upper
- R -> N, in-rush excluded episode; max upper
You could create 2 (or more) points alarms for each asset; one with lower (more sensitive) thresholds with a Low priority and one with higher (less sensitive) thresholds with a High priority.
Our points alarm recommendation:
For each switch end and direction; create an Average and Duration upper threshold using the whole trace and create a Maximum upper threshold using the in-rush excluded episode.
Points alarm wizard
Setting threshold levels requires some analysis of each asset to understand where to set those levels. This could be a lengthy task, which would ideally be repeated whenever assets are maintained, and also at major seasonal changes. For this reason, we have created the Points alarm wizard to carry out a lot of this work for you.
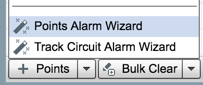
Open the Points Alarm Wizard through the Alerts page by clicking the Points Alarm Wizard on the create new drop down in the lower left of the page.
Selecting training data
Select the Site and Channel (points asset) you want to configure thresholds for.
The wizard uses past data to "train" the alarm thresholds. You should select a region of good data where the asset was performing normally, this would ideally be a period after maintenance.
 button to find baseline traces to use as the start date.
If possible, the training data date range should include more than 200 throws.
Leave the episode empty to train the alert on the whole trace. This is currently the only recommended usage of the points alarm wizard.
The wizard will automatically exclude any data collected during configured maintenance periods. This is one of the reasons it is particularly useful to create maintenance windows for any known maintenance. Any data captured during maintenance will skew the training, potentially resulting in poor threshold generation.
Click Train.
Statistics
The wizard will display some statistics based on the training data you have selected. This can be a useful tool for quickly viewing the health lines of an asset.
If the trend lines are fairly flat, the dataset is consistent and probably a good data set. If the lines contain outliers, or are trending upwards then the data contains some faults/maintenance or is already trending towards potential failure.
Sensitivity
The sensitivity of the thresholds is configured by selecting a tolerable false alarm rate. To increase the sensitivity of the alarm, increase the number of false alarms you will tolerate, or lower the period. To decrease the sensitivity either increase the period or decrease the number of false alarms.
Thresholds
The wizard shows each feature on a histogram, per direction. This shows the range and frequency of values for each feature; duration, average current, maximum current and total current. It also fits a lognormal distribution curve to the histogram, it is this curve that is used to calculate the thresholds for each feature.
By default, the wizard will apply Upper boundary thresholds for all 4 features. You can disable/enable the thresholds by ticking/un-ticking the checkboxes underneath the charts in each feature/direction. Our recommendation would be to only apply the Duration and Average upper boundaries.
Alert details
The Configure alert section at the bottom of the page allows you to configure the general alert conditions that will be applied.
If there is already a points alert configured for the selected asset, it will provide the Replace Alert option allowing you to update the existing thresholds. Alternatively, you can select --Create New-- to create an additional alert on the asset. You may want to use the create new option if you are trialling new thresholds, or if you want to set up a more/less sensitive set of thresholds on the same asset.
Click Save Alert to save the new/updated thresholds.
Manual tweaking
The points alarm wizard will create a Points alarm type just like in the manual method. This means you can edit the created alert manually and tweak any of the configured thresholds, or add additional thresholds.
Track circuit RCM
Centrix provides a facility for detecting faults in track circuits where you are monitoring track circuit current on a SA380TX or SA380TX-L data logger.
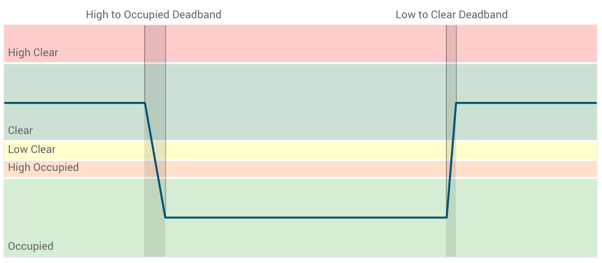
The monitoring (alerting) is based on the following profile (expectations) of a track circuit occupation.
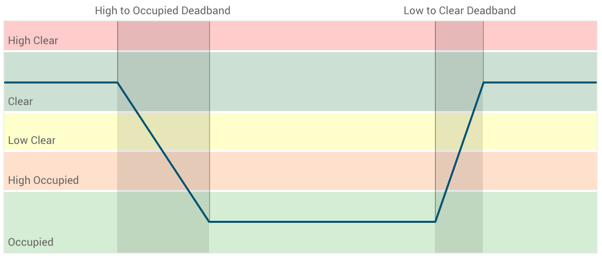
The track circuit alarm will fire on the following conditions;
- Track circuit takes too long to transition from Clear to Occupied ("High to Occupied Deadband").
- Track circuit takes too long to transition from Occupied to Clear ("Low to Clear Deadband").
This will capture conditions where the track circuit relay is shunted or clear, but the current is outside of "normal" range (i.e. Low Clear / High Occupied).
Manual configuration
Much like the points alarm alarm, track circuit alarms can be configured both manually and via a wizard.
You can manually create a track circuit alarm by selecting the Track circuit alert type in the create new alert drop down in the lower left.
To manually configure an alert, you will need to calculate the above profile values for the given asset;
- High clear current (milliamps)
- Low clear current (milliamps)
- High occupied current (milliamps)
- Low to clear deadband (seconds)
- High to occupied deadband (seconds)
Track circuit alarm wizard
Centrix can automatically configure the above profile using historical data for an asset. The track circuit alarm wizard is accessed from the Alerts screen by selecting Track circult alarm wizard from the create new alert drop down.
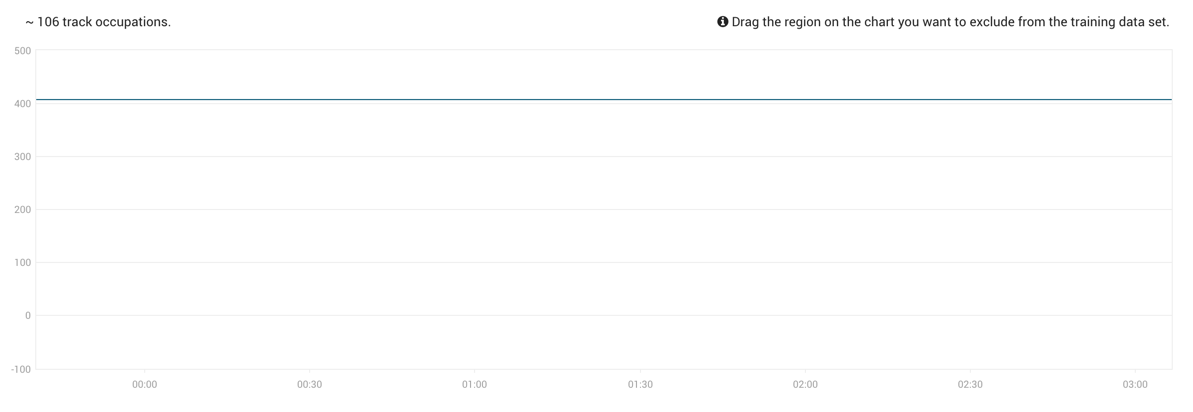
Training data set
Select the Site and Channel for the track circuit asset you want to configure the alert for.
Provide a date range that should be used to train the alert from. This should be a period where the track circuit was in good working order. A few weeks should provide sufficient training data.
By default, Centrix will automatically exclude any data that occurred during configured maintenance periods.
The training data will be displayed so you can check there are no periods of bad data. Periods of maintenance will be highlighted on the map in yellow.
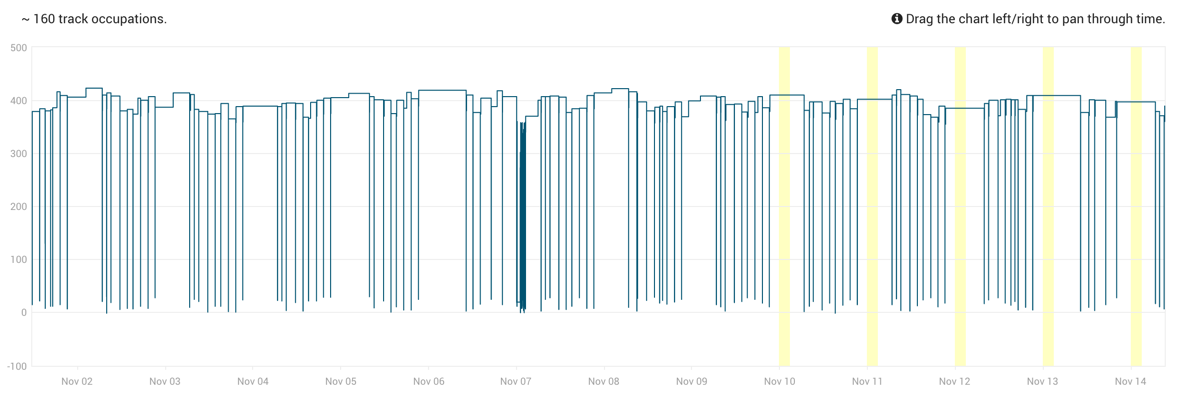
You can pan the data by selecting the  option and then click and drag the graph left/right to pan through the data.
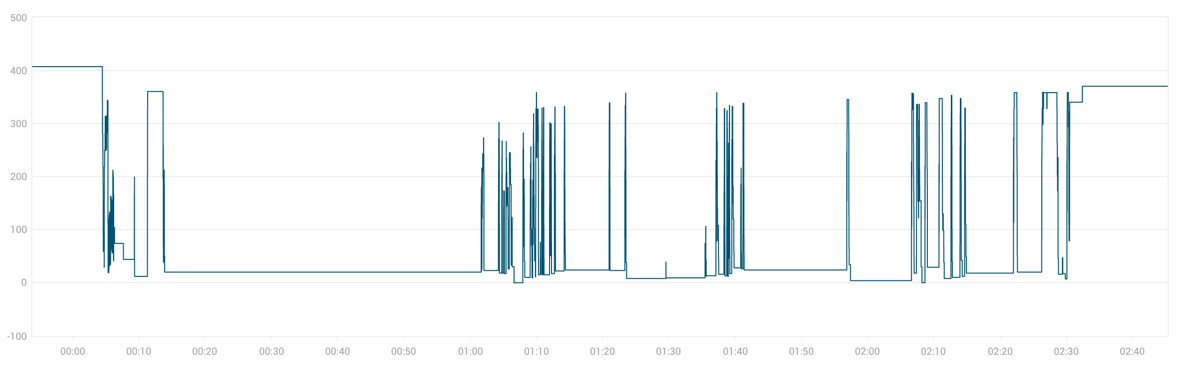
You can zoom in/out the data by selecting the  options. Click and drag to zoom in, click the zoom out to reset the view.
If you find an area of bad data, select the  option, then click and drag over the period of bad data. This data will then be excluded from the training data set.
| Before cut | After cut |
|---|---|
 |  |
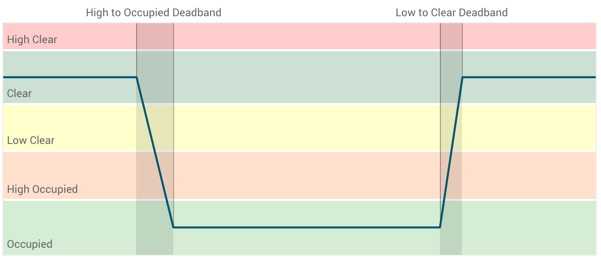
Sensitivity
The sensitivity of the alert is configured using the "current" and "time" sensitivity sliders.
Current sensitivity will increase/decrease the Clear and Occupied regions in the profile.
Time sensitivity will increase/decrease the dead-band periods for transitioning between clear and occupied.
| Current sensitivity | |
| High | Low |
|---|---|
 |  |
| Time sensitivity | |
| High | Low |
|---|---|
 | 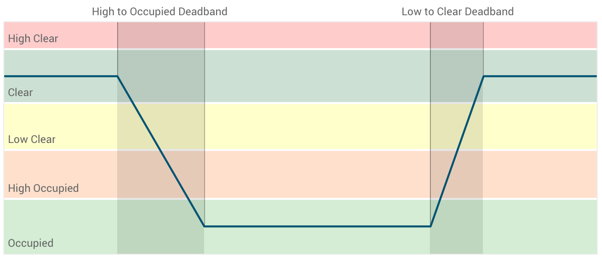 |
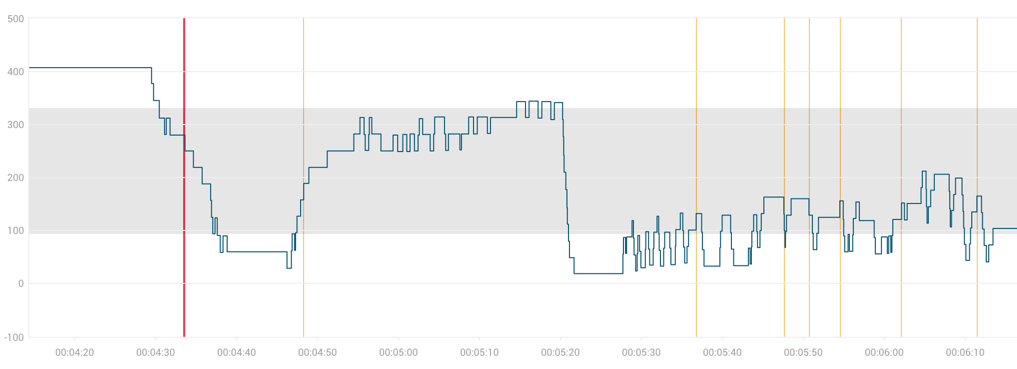
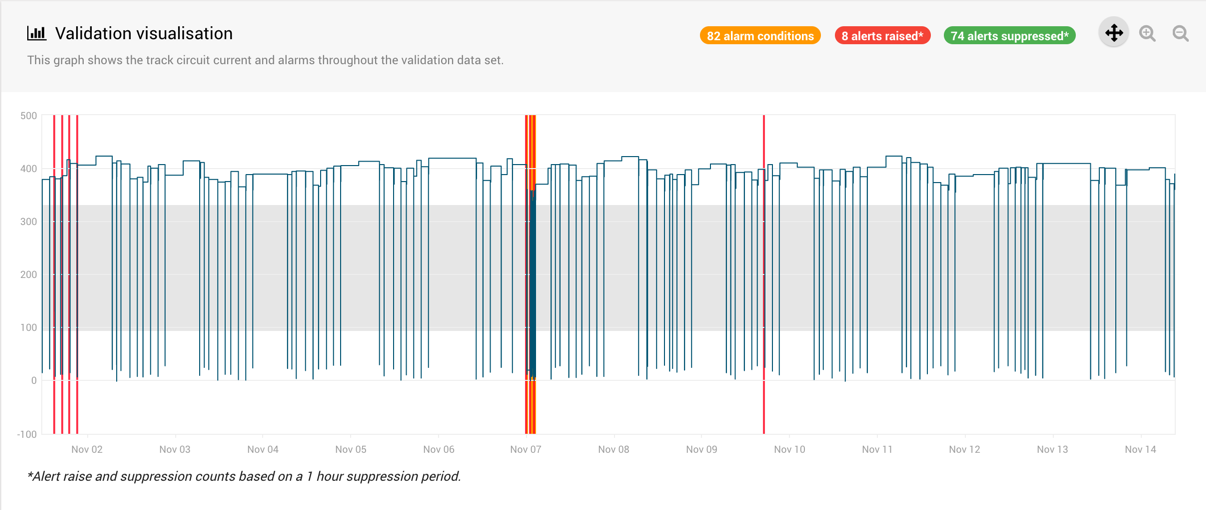
Validation
Once you have configured the sensitivity, you can validate the thresholds on a different period of data to retrospectively see where alerts would have fired based on the given profile.
Vertical red lines indicate where alerts would have fired.
Vertical orange lines indicate where suppressed alerts would have fired (based on a 1-hour suppression period).
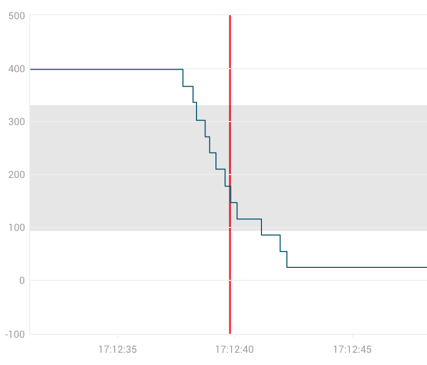
The grey region is the area between low clear and high occupied.
Deadband exceeded transitioning between clear and occupied.
Maintenance