...
Once generated, the re-generate report button can be pressed at any time to make sure the data is up to date.
Hydraulic points display graphs for hydraulic pressure and electric motor current, while electric points only display graphs for electric motor current.
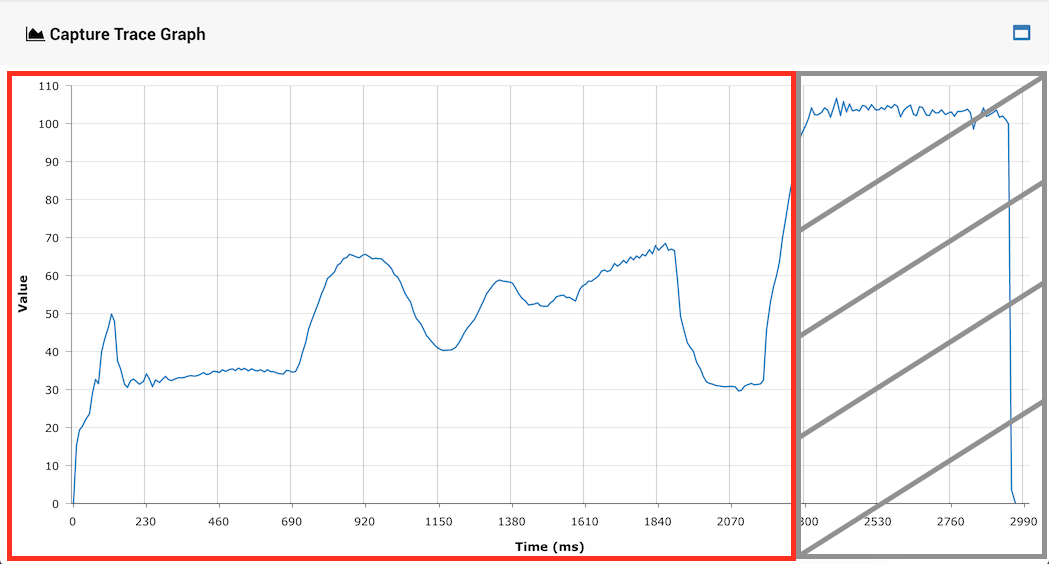
For hydraulic pressure, data on on swing time, average pressure (excluding clamp lock movement) and and peak pressure (excluding clamp lock movement) is shown.
The clamp lock movement region of a typical trace is shown below under the grey region. The red-boxed region is what would be used to calculate the average and peak pressure.
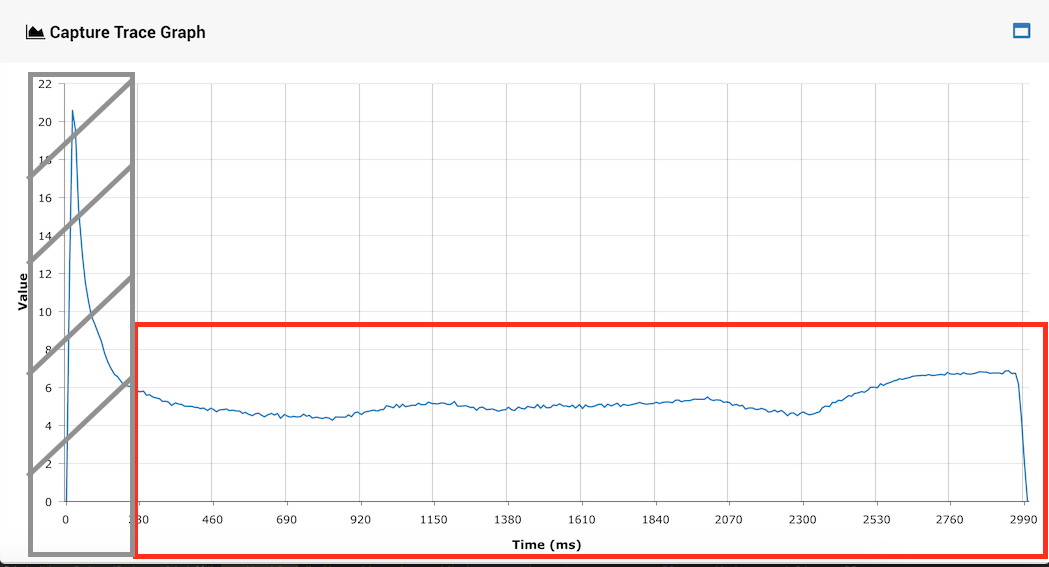
For electric current, data on swing time, average current (excluding the inrush current) and peak current (excluding the inrush current) is shown.
The inrush current region of a typical trace is shown below under the grey region. The red-boxed region is what would be used to calculate the average and peak current.
 For details on the exclusion of the clamp lock movement region, see the Points Trace Splitting System page.
Every point on a graph is a daily averaged value.
...