| Training dates | 07 Nov 2016 - 09 Nov 2016 |
|---|---|
| Delivered by | Jamie (Deactivated) <jamie.brown@mpec.co.uk> |
| Description |
|
Contents
Active alerts
Managing your active alerts is the most important workflow to add into your schedule and/or processes. You can make use of e-mail alert notifications to receive instantaneous notifications when alert conditions are triggered, and/or you can use the Alerts screen in Centrix to see all the currently active (triggered) alerts and interrogate them.
Standard alert features
Centrix supports a number of preset alerts for various known rail faults/conditions. However, each alert shares the following standard profile;
| Alert name | A unique name for the alert, this will appear in the e-mail subject of any notifications. |
|---|---|
List of e-mail addresses that should receive e-mail notifications. Tip: Use labels to group e-mail addresses into logical groups, rather than using the e-mail field. Tip: Even when using labels for alerts, it is useful to use this when 'trialling' a new alert that you don't want e-mailing to other team members. | |
| Subscribed? | E-mail notifications will only be sent if this is ticked . |
| Suppression period | Use this to stop Centrix sending notifications for repeated alerts. Repeated alerts within the configured period will not trigger e-mail notifications, but will still appear in the alert history in Centrix. |
| Priority | Use this as desired to allow you to make a decision on prioritising active alerts. Tip: Use High/Critical for alerts on critical assets. Tip: You can setup multiple alerts for track circuits/points with High/Low thresholds. |
| Labels | Labels are used to group alerts into their associated teams. They can also be used for informational purposes. Labels can have e-mail addresses attached to them which will define who should receive e-mail notifications for the alert they are attached to. |
Alert listing
The alert listing (access through the Alerts menu link) shows all configured alerts within your user group.
For managing active alerts, you should select the Active Only filter at the top of the listing.
To view only the alerts for your team, filter the listing by Label using the Filter by Label filter at the top of the listing. You can select more than one label if desired.
Tip: If you have a lot of active alerts and not currently in a position to clear out older ones, sort the listing by Last Triggered (descending) to see the most recent alerts first. Click on the table column header to change the sort.
Each alert will have 1 of 3 possible statuses;
| Clear | Alert has not triggered since it was last cleared or created | |
| Active | Alert has triggered since it was last cleared or created | |
| Active - Returned Normal | Alert has triggered since it was last cleared or created, but it has since returned back outside the threshold conditions This feature only applies to the Points alarm type. |
Start your investigation
Double click on any alert to see the history of alert raises (triggers). Here, the Message will provide you with details about why the alert triggered.
Click the button in the Actions column to open the graphical replay panel at the point in time the alert triggered.
See the section on Graphical replay for further details.
You can save a Bookmark for any alert raise by clicking the button in the Actions column. This is useful if you want to quickly return to the fault in the future, or you want to share it with a colleague. More on Bookmarks later.
Clearing alerts
Once you are done dealing with an alert, you should clear it so it no longer appears in the listing of active alerts.
You can clear a single alert by clicking the button in the Actions column of the alerts listing.
You can clear one or more alerts using the Bulk Clear action found in the bulk actions drop down at the bottom of the listing. First select all the alerts you want to clear, then click this action.
Graphical replay ("Playback")
The graphical replay panel is the heart of the Centrix system and provides a configurable panel for viewing various types of data and Centrix features on a single screen.
There are a few methods to access the graphical replay panel, depending on your starting point;
From the dashboard
When your first enter Centrix, you are presented with a simple screen that allows you to select a Site and a Date/Time to view data from.
From the sites listing
On the Sites listing you can double click on any site to open the replay panel. The panel will open at the current date and time.
From an alert raise
When viewing the raises of an alert, you can click the button to open the replay panel at the date/time the alert triggered.
From a bookmark
You can open the replay panel at the date and time of a saved bookmark by clicking the button on the bookmarks listing.
Replaying data
The top bar of the replay panel contains some playback controls that allow you to control the automated playback of event data;
| Jump back 1 day | Jump back 1 hour | Play backwards* | Pause replay | Play* | Jump forward 1 hour | Jump forward 2 hours | Select the play mode |
* Play (forwards or backwards) will automatically replay the data in the mode selected in the drop down (real-time, real-time*10 or event step)
Play modes
| Real-time | Plays the events through in real-time as they occurred |
|---|---|
| Real-time * 10 | Plays the events through at 10x speed as they occurred |
| Event step | Plays the events through one by one at a fixed interval |
Current date/time
The current date/time is shown in the centre of the top bar. When the data is playing, you will see the time ticking forwards/backwards depending on the selected play mode.
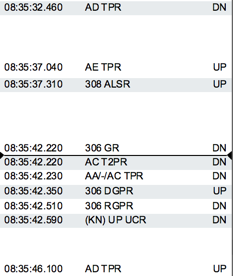
Each panel has a black bar in the centre which indicates the current date/time in the data set. The item before the line is the last item that occurred before the current date/time, the item after the line is the next item that will occur once the date/time reaches the time of that item.
Example;
Current date/time:
Digital events panel:
Manually stepping through events
You can use the scrollbar on any of the event panels to scroll through the data;
Click the up/down arrows to move one event at a time.
Click within the scrollbar to quickly move up/down the events.
Click and drag the scroller to move to a specific position in the event listing.
Scroll with your mouse wheel to move through the events.
You can also use the arrow keys and page up/page down functions on your keyboard to move through events. Make sure you click within the box first to select it.
Map
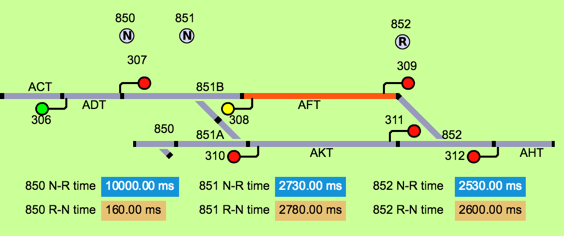
The map provides a facility to visualise the raw data in a human understandable way. Centrix provides a number of widely used railway assets that can be attached to relay functions and displayed on the map based on relay logic.
Any channel monitored in Centrix can be displayed on the map, even where there isn't a specific railway asset type for it. You can display relay functions as on/off or up/dn indicators which various colour configurations. Analogue data can be visualised as a numeric value or as a gauge.
The current status of the map indicators will be based on the current date/time selected. If the current date/time is now, or in the future, then the map should show the current live status of all assets on the site (minus any lag between the data logger and Centrix).
If you want to use the replay panel as a "live display" of the site, you should select a date/time in the future, then hit the Play button. This will ensure the current time is ahead of all events, so the most recent events will always be represented on the map as they are received from the data logger. This could be used in an operations environment as a subsidiary system.
Hover you mouse cursor over any item on the map to display the functions that are attached to it, and their current status.
Widgets and features
This section describes each widget panel on the replay panel and what features they provide.
Adding/removing widget panels
Widgets can be added and removed from the replay panel by clicking the Configure button in the top right of the panel. Tick or untick widgets to add/remove, then click Apply. Clicking Apply and save will save the configuration for future visits to that site.
Digital Events
The digital events widget shows all the relay function events received from the data logger, displayed as;
| Time (including milliseconds) | Function | State (boolean)* |
|---|---|---|
| 08:33:42.030 | AK TPR | UP |
*UP = Up | Picked | 1 | True | On
*DN = Down | Dropped | 0 | False | Off
Filtering channels
By default, the listing will show events from all the functions available on the site. You can filter by a specific set of channels by clicking the button in the bottom of the widget.
You can click and drag around the channels you want to filter on the map.
Or, you can manually select/de-select the channels in the listing.
Click Apply Filter to apply the filter.
Show events with time context
By default, the events are displayed in a simple listing, without any context of time between various sets of events without looking at the time of the events.
You can enable time spaced mode on the event listing by clicking the button at the bottom of the widget. Gaps will now be shown between events, relative to the amount of time there was between them. This allows you to easily see which events occurred around the same time, or where there was a gap between events.
Locate a function on the map
If you want to find a function on the map from an event, select the event in the listing and click the button. The map will centre on the object that represents that function and will highlight it for a short period of time.
This is particularly useful for larger sites, or on sites you are not familiar with.
Bookmarks
The bookmarks listing shows the bookmarks that have been created on a site in a time series, similar to the digital event listing.
You can navigate to the date/time of a bookmark by scrolling through the listing, just like you would for the digital event listing.
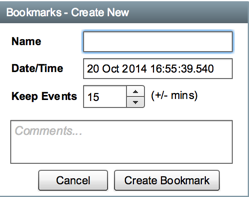
New bookmarks can be created by clicking the button at the bottom of the widget. The current playback date/time will be used for the bookmark date/time, though you can change this manually if desired.
Alerts
This alerts widget displays a time series of all alert raises for the site. You can scroll through them to jump to instances of an alert raise.
The alert widget is a useful widget to apply and save on a site.
Logic Analyser
The logic analyser widget provides a way to view the digital logic on a time series, allowing you to compare the pick/drop times of a set of relays.
The current time is shown by the vertical black bar (like the horizontal bar on the event list, bookmarks and alerts list).
You can amend the functions that are shown on the analyser by clicking the button at the bottom of the panel. Select channels in the available or active listings and click the <-- and --> buttons to add/remove channels.
Change the displayed time window by adjusting the Scale using the slider at the bottom of the panel.
Maintenance Windows
Maintenance windows are used to schedule maintenance (either one-off or regular) periods. They are used to suppress any alerts that may occur during maintenance, and to ensure that data collected during maintenance is not used as the inout to any automatic alarm threshold training (more on that later).
If any alerts firing during a schedule maintenance period, they will be suppressed in the system with the reason "maintenance", so you can still see them in the alert history, but e-mail notifications won't be sent.
The widget will show all the configured maintenance windows for the site; past, present and future.
Create a maintenance window
Click the button at the bottom of the panel.
Enter the starting date/time for the maintenance, and select how long the maintenance should last for.
You can put the whole site into maintenance mode by selecting the Suppress all channels option.
Or, you can select individual channels to put into maintenance by selecting them in the Available channels listing and clicking the button.
You can also select channels on the map by drawing a box around the assets you want to put into maintenance mode, then click the Add map selection button.
If the maintenance is one-off, then simply enter a reason (optional) and click Save.
If the maintenance is regular (e.g. every week, every day), then click the Repeat checkbox and select the interval of the repeat (e.g. 1 day for every day, 7 days for once per week).
Create a repeating nightly maintenance window to automatically suppress permanent-way maintenance generated alerts during non-operational hours.
Bookmarks
Bookmarks provide a method of saving and labelling a point in time for a site. A common use case may be to correlate a reported incident with the associated data in Centrix.
For convenience, Centrix provides the following three methods for creating bookmarks;
From the bookmarks listing
Select Bookmarks from the main menu and click the button at the bottom of the listing. You will need to provide a name for the bookmark, and select a site to attach it to. By default, it will select the current/date time as the bookmarked time, but you can change this to your desired time.
Enter comments to store more detailed information about the bookmark - useful if you want to share some information for colleagues.
Click Save Changes.
From the playback panel
This method is useful when you're in the graphical replay panel and have located an incident or event that you wish to bookmark.
Make sure the Bookmarks widget is enabled by clicking Configure, tick Bookmarks and click Apply.
In the bookmarks widget panel, click the button. The current playback date/time will be set as the bookmark time, but you can manually adjust this if desired. Enter the bookmark name and comments then hit Save.
From the alert raise listing
If you want to create a bookmark for the date/time of a Centrix raised alert, you can do this from the Alert Raises listing in the Alerts screen.
Double click the alert in the alerts listing to open the raise history. On the raise you want to bookmark, click the button. This will take you to the Create Bookmark panel, with the date/time pre-filled as the time the alert was raised.


