...
The drill down is presented as a table of events that have occurred over the given date range for the channels associated with the asset. This includes NKR, RKR and TR operations.
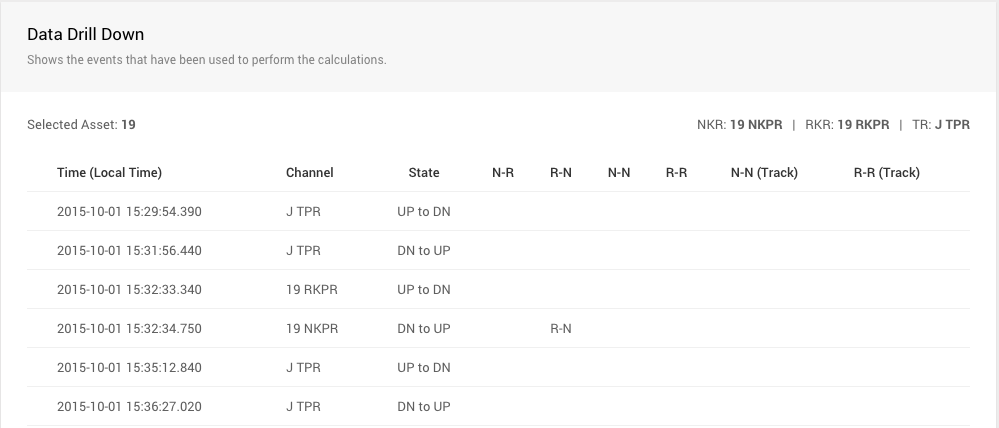
The table is ordered by time (ascending) with one row representing one relay event. The columns are defined as follows;
| Time | Date and time of the event (in your local timezone) as supplied from the data logger |
|---|---|
| Channel | Channel (relay) the event occurred on (NKR, RKR or TR) |
| State | Transition represented by the event (UP to DN or DN to UP) |
| N-R | Displays "N-R" if the event was counted as a valid normal to reverse movement |
| R-N | Displays "R-N" if the event was counted as a valid reverse to normal movement |
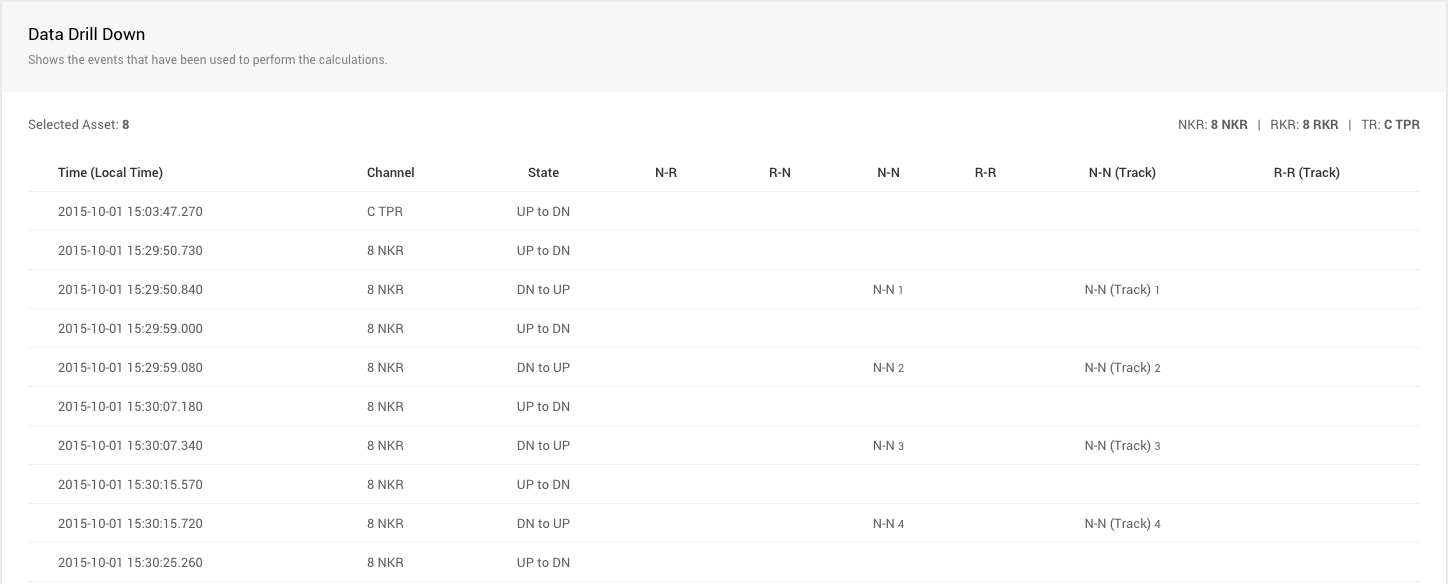
| N-N | Displays "N-N" if the event was counted as an invalid normal to normal movement (with or without track occupation) |
| R-R | Displays "R-R" if the event was counted as an invalid reverse to reverse movement (with or without track occupation) |
| N-N (Track) | Displays "N-N (Track)" if the event was counted as an invalid normal to normal movement (with track occupation) |
| R-R (Track) | Displays "R-R (Track)" if the event was counted as an invalid reverse to reverse movement (with track occupation) |
The table also shows a running value for each of the counters (N-R, R-N, N-N, R-R etc), so next to each occurrence of these movements an incrementing value will be displayed.
Logic table
This table shows how the report determines specific conditions for counts.
...