...
- Login into Centrix
.png?version=1&modificationDate=1500912370000&cacheVersion=1&api=v2&width=600)
- Click the Reporting tab on the main menu and select NR/SIN/137
.png?version=1&modificationDate=1500914177000&cacheVersion=1&api=v2&width=600)
- The list of current NR/SIN/137 reports should appear
%20(5).png?version=1&modificationDate=1500914480000&cacheVersion=1&api=v2&width=600)
- Click ' Create New report' Report at the top of the page
Creating a New Report
%20(6).png?version=2&modificationDate=1500914691000&cacheVersion=1&api=v2&width=600)
To create a new report, fill in the input values (explained below) and click the Create Report button to generate a new report.
...
| Note | ||
|---|---|---|
| ||
When selecting a custom date range, the time will be automatically set to midnight (00:00) on the start day and 23:59 on the end day. |
...
Once you have specified the report parameters and clicked the Create Report button, you should be redirected back to the list. There, there should be a new report entry at the top of the list, with a loading indicator spinner and a yellow indicator.

%20(8).png?version=2&modificationDate=1500996829000&cacheVersion=1&api=v2&width=767)
When the report has finished processing the indicator should change to green.

%20(9).png?version=2&modificationDate=1500996833000&cacheVersion=1&api=v2&width=768)
Download a Report
To download the NR/SIN/137 Excel Spreadsheet for a report, click the report, then click the Download SIN/137 buttonthe blue Download button.

%20(11).png?version=3&modificationDate=1500997332000&cacheVersion=1&api=v2)
You should then be prompted to download the report.
...
It is also possible to view the raw data that was used to generated an Excel Spreadsheet report, click on the report, then press the the green View button. Raw data can also be downloaded by pressing the Download .csv button.

%20(11).png?version=3&modificationDate=1500997332000&cacheVersion=1&api=v2&width=768)
You will be taken to another screen, towards on the top of the page you'll see data categorised into the time bins (20 to 100 and >100).

Towards the bottom of the page you can a pair of graphs displaying the current distribution of time sequences for each bin. Each bin represents a particular sequence length in seconds, and the count is the number of sequences that have this length. These bins are automatically selected to fully contain all the available data. If you wish to reduce the number of bins this can be achieved by editing the minimum and maximum bin values below the graphs and pressing the View button.
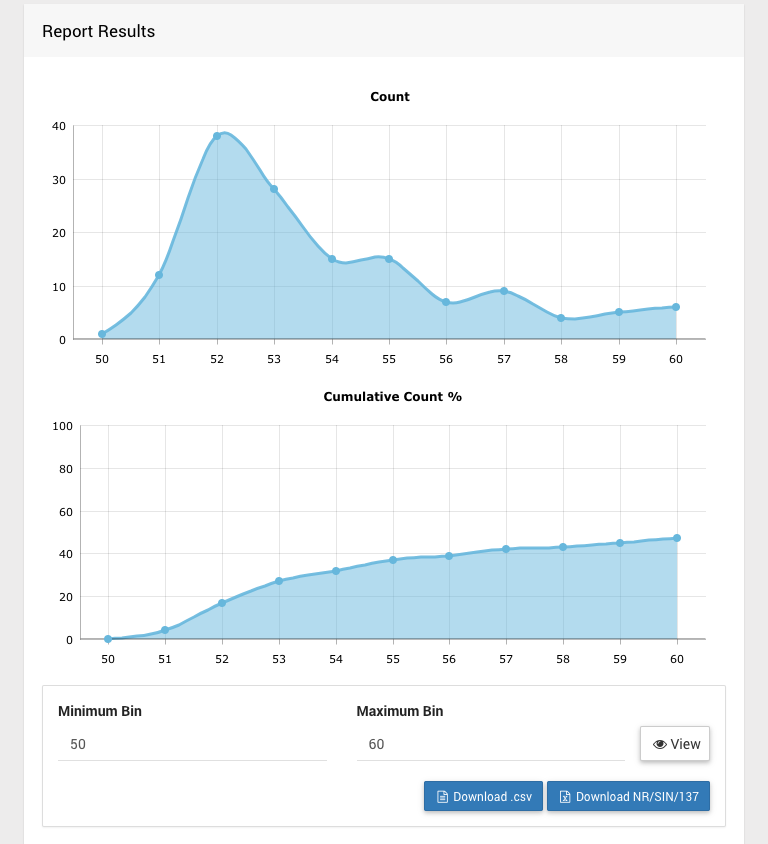
The data used to generate these graphs is displayed below in the Sequence Data table.
%20(14).png?version=1&modificationDate=1500998558000&cacheVersion=1&api=v2)
Press the Raw Data link to see the raw event data which was used to generated the binned values. The Download .csv button allows you to download this data.

%20(15).png?version=1&modificationDate=1500998568000&cacheVersion=1&api=v2)
Duplicate a Report
If you want to run a new report with the same settings as an existing report but change only the dates (for example), you can click any report, then click the the white Copy button.

This will copy the values from the selected report into the report generation form.

%20(13).png?version=1&modificationDate=1500997478000&cacheVersion=1&api=v2&width=768)
Delete a Report
To delete a generated report, click the Delete button on the report you wish to delete.

A confirmation dialog will prompt you to confirm the deletion.

%20(12).png?version=1&modificationDate=1500997443000&cacheVersion=1&api=v2&width=584)