NR/SIN/137
This report has been specifically designed to meet the requirements of NR/SIN/137.
The report will provide a list of Level Crossing Warning Times for a given sequence and provide statistics to show how many trains fall into which time.
Access the Report
To access this report;
- Login into Centrix
.png?version=1&modificationDate=1500912370000&cacheVersion=1&api=v2&width=600&height=366)
- Click the Reporting tab on the main menu and select NR/SIN/137
.png?version=1&modificationDate=1500914177000&cacheVersion=1&api=v2&width=600&height=614)
- The list of current NR/SIN/137 reports should appear
%20(5).png?version=1&modificationDate=1500914480000&cacheVersion=1&api=v2&width=600&height=385)
- Click Create New Report at the top of the page
Creating a New Report
%20(6).png?version=2&modificationDate=1500914691000&cacheVersion=1&api=v2&width=600&height=869)
To create a new report, fill in the input values (explained below) and click the Create Report button to generate a new report.
The report takes the following input parameters;
| Parameter | Description | Example |
|---|---|---|
| Site Name | The level crossing site to generate a report for, select from the drop-down list. | My LX |
| Report Title | The title of this specific report, this will populate the "Line" field in the Excel report. | Up Fast |
| Time Range | The date range to run the report over. Select 'custom' to manually set a start and end date. To set these values, click the 'start date' and 'end date' boxes to bring up a date picker. The start date must be before the end date. | |
| Channels | The unique sequence of events to extract the warning time. To add to the sequence, select the channel from the list, then click the + button. When you've added a channel to the sequence, you should select a State (either up or down). When you've added all the required channels, set the Start and End events using the radio buttons in the sequence list. The report will calculate the time between the Start and End event, this allows you to add sequence proving events before and after the start/end events without them affecting the sequence timing. There is a known limitation, any channels that are used in the sequence must have their states fully represented from the strike-in event through to the arrival event. This is especially important when using something such as a treadle as the strike-in, for example the following sequence will fail to generate any timings: 535b QNPR,DN,S 538 T1PR,DN,A By the time arrival event is fired, the train has already passed the treadle which caused the 535b QNPR channel to change state to UP. This extra event in between the strike-in and arrive causes the report generator to miss the sequence as the strike-in channel is essentially "disarmed" before the arrive event is encountered. To resolve this issue, simply ensure that all channels used in the level crossing sequence (535 QNPR and 538 T1PR in this example) have their states fully represented: 535b QNPR,DN,S 535b QNPR,UP,- 538 T1PR,DN,A The Event Replay feature in Centrix can help identifying the correct level crossing sequence. | |
| Design Time | The minimum warning time (in seconds) from LX design | 30 |
| Route, Line Name, ELR, Crossing Name, Crossing Type, Direction. | These fields should be entered and will be automatically entered into the NR/SIN/137 report upon download | |
| File name | The file name to be given to the generated report download. .xls will be added automatically so there is no need to enter it. |
Dates
When selecting a custom date range, the time will be automatically set to midnight (00:00) on the start day and 23:59 on the end day.
Once you have specified the report parameters and clicked the Create Report button, you should be redirected back to the list. There, there should be a new report entry at the top of the list, with a loading spinner and a yellow indicator.
%20(8).png?version=2&modificationDate=1500996829000&cacheVersion=1&api=v2&width=767&height=142)
When the report has finished processing the indicator should change to green.
%20(9).png?version=2&modificationDate=1500996833000&cacheVersion=1&api=v2&width=768&height=143)
Download a Report
To download the NR/SIN/137 Excel Spreadsheet for a report, click the report, then click the blue Download button.
%20(11).png?version=3&modificationDate=1500997332000&cacheVersion=1&api=v2)
You should then be prompted to download the report.
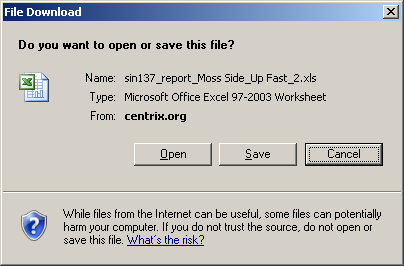
The filename for the report is based on it's parameters and has the following format: sin_137_report_{SITE NAME}_{TITLE}_{GENERATED ID}.xls
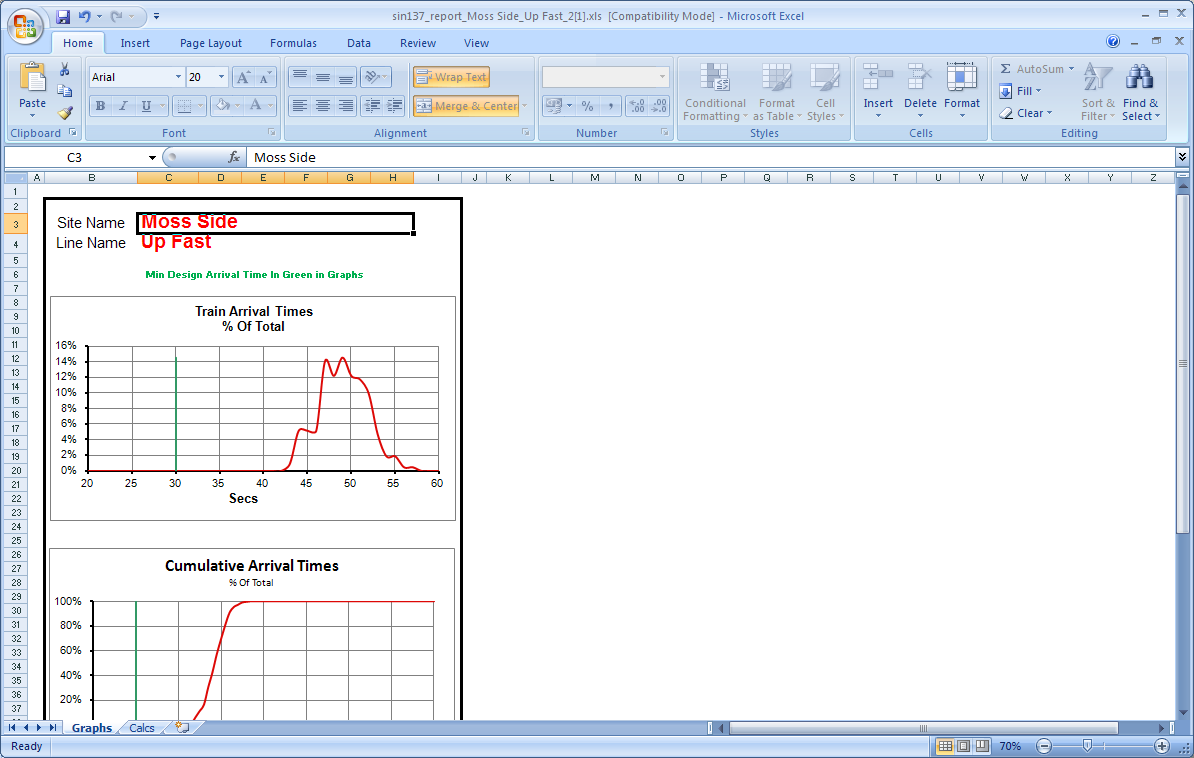
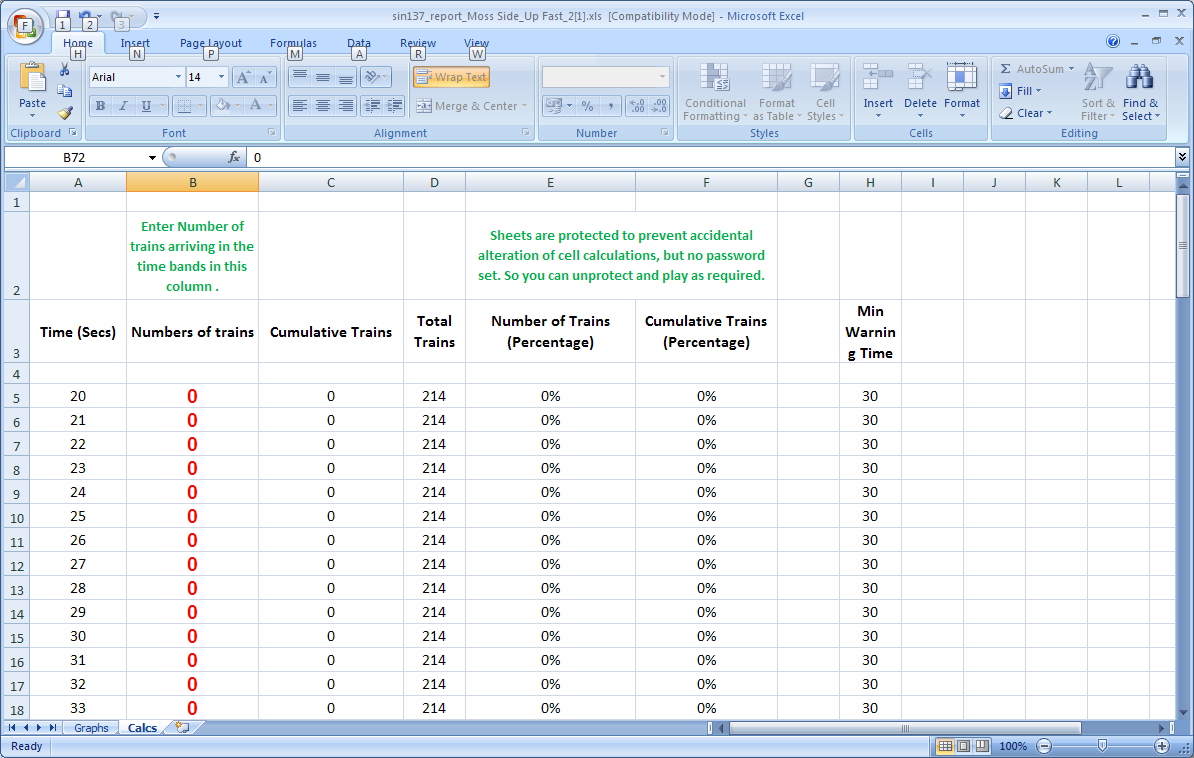
Open the downloaded xls report to view the graphs and calculations.
Viewing a Report's Raw Data
It is also possible to view the raw data that was used to generated an Excel Spreadsheet report, click on the report, then press the green View button.
%20(11).png?version=3&modificationDate=1500997332000&cacheVersion=1&api=v2&width=768&height=468)
You will be taken to another screen, on the page you'll see a pair of graphs displaying the current distribution of time sequences for each bin. Each bin represents a particular sequence length in seconds, and the count is the number of sequences that have this length. These bins are automatically selected to fully contain all the available data. If you wish to reduce the number of bins this can be achieved by editing the minimum and maximum bin values below the graphs and pressing the View button.
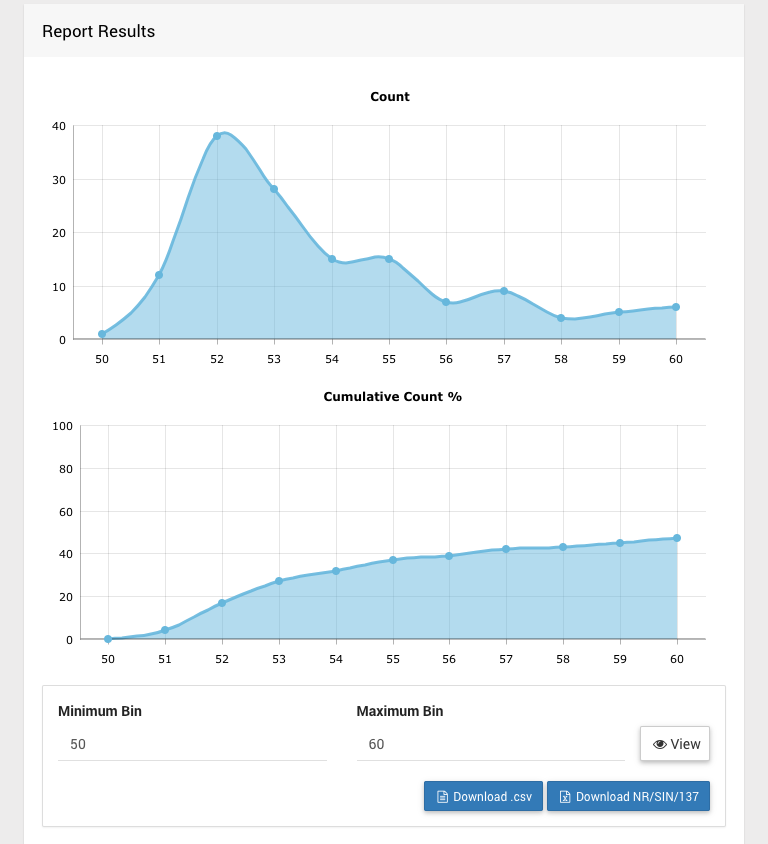
The data used to generate these graphs is displayed below in the Sequence Data table.
%20(14).png?version=1&modificationDate=1500998558000&cacheVersion=1&api=v2)
Press the Raw Data link to see the raw event data which was used to generated the binned values. The Download .csv button allows you to download this data.
%20(15).png?version=1&modificationDate=1500998568000&cacheVersion=1&api=v2)
Duplicate a Report
If you want to run a new report with the same settings as an existing report but change only the dates (for example), you can click any report, then click the white Copy button.
This will copy the values from the selected report into the report generation form.
%20(13).png?version=1&modificationDate=1500997478000&cacheVersion=1&api=v2&width=768&height=1379)
Delete a Report
To delete a generated report, click the Delete button on the report you wish to delete.
A confirmation dialog will prompt you to confirm the deletion.
%20(12).png?version=1&modificationDate=1500997443000&cacheVersion=1&api=v2&width=584&height=329)