...
For more information, see Captures.
Alerts
The alerts widget displays a list of alert raises. Clicking on the clock button next to the alert raise will open up a dialog which shows a list of historical alert raises for the selected alert.
...
- Scale - The first slider at the bottom of the logic analyser can be used to adjust the time scale on the x-axis. By dragging the slider to the right you can increase the amount of time represented by each pixel, this allows you to expand the timeframe visible in the logic analyser. The millisecond values either side of the centre line indicate the current size of the timeframe and change in relation to the position of the slider.
- Line Thickness - the second slider is used to adjust the thickness of the line drawn on the logic analyser, this may make it more visible.
| Anchor | ||||
|---|---|---|---|---|
|
Maintenance Windows
The maintenance window widget is used as a mechanism to suppress alerts during certain time windows. By default, there will be no maintenance windows setup on a site.
...
Press the plus button in the bottom left to create a new maintenance window.
The maintenance window form contains several fields:
...
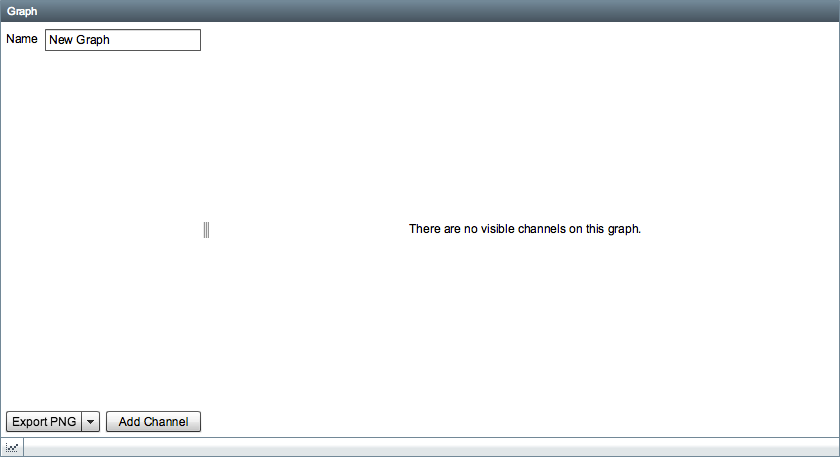
Type in a name for the new graph.
Adding a Graph Channel
After clicking the Add Channel button you will be presented with a dialog, by default the Interlocking field will be set to the current site but you can specify a different site if you want to add channels from another site for comparison.
...
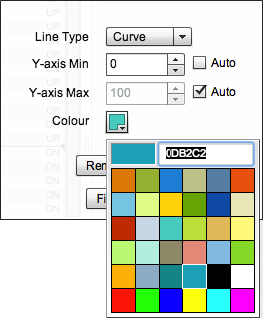
To change the line colour, click on the colour box and you will be presented with a colour picker. If you want to use a custom colour not available in the colour picker you can type a colour code in the field, the field uses the HTML/Hex colour format.


