...
You will see a confirmation dialog before the maintenance window is removed.
Graphs
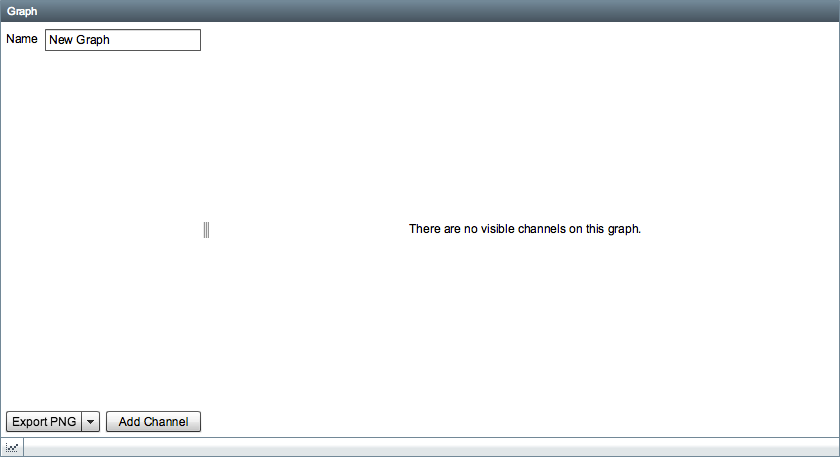
Adding a Graph Channel
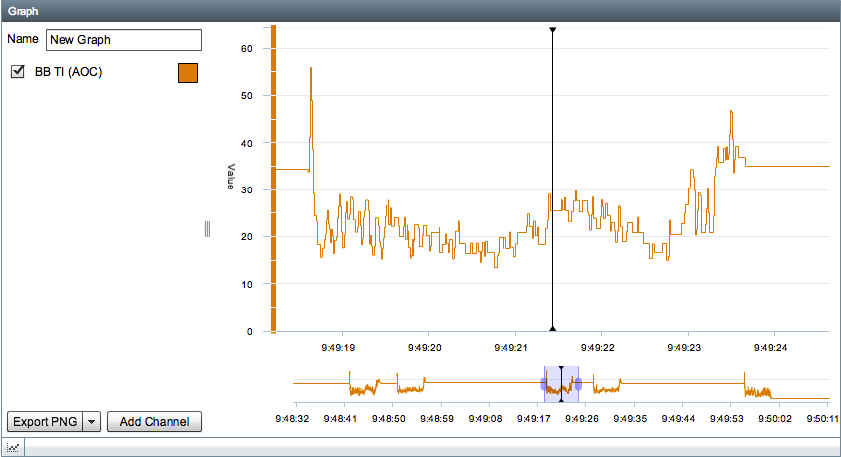
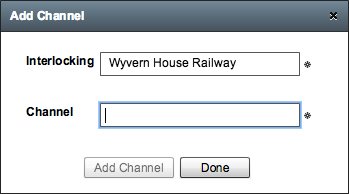
After clicking the Add Channel button you will be presented with a dialog, by default the Interlocking field will be set to the current site but you can specify a different site if you want to add channels from another site for comparison.
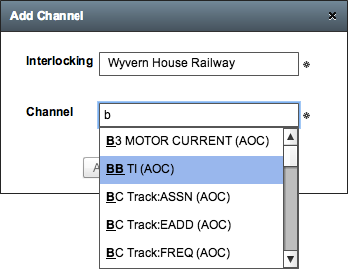
The Channel field contains a list of analog channels for the specified site, you can type in the field to filter the list of channels. Press the Add Channel button to add the channel to the graph, you should see the channel being added in the background, you can then specify another channel or press Done to dismiss the dialog and return to the graph.
Editing a Graph Channel
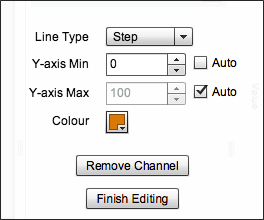
To edit a channel on the graph, click on it in the list on the left, this will open up an edit dialog with several options:
- Line Type - change how the line is displayed on the graph.
- Y-axis Min - sets the lower boundary for the scale on the Y axis. Use the Auto option to automatically determine the minimum based on the current data in view.
- Y-axis Max - sets the upper boundary for the scale on the Y axis. Use the Auto option to automatically determine the maximum based on the current data in view.
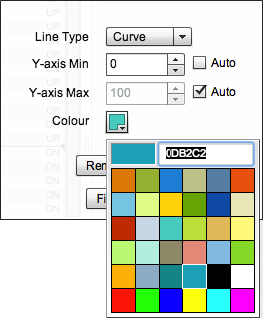
- Colour - change the line colour.
- Remove Channel - remove the channel from the graph.
- Finish Editing - save any changes.
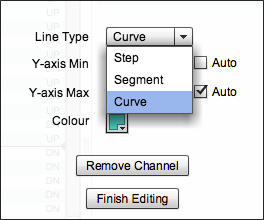
The line type can be changed to one of the following options:
- Step - this is the default option, it steps the line between each data point
- Segment - joins each data point with a line
- Curve - approximates a curve between each data point
Line type options:
To change the line colour, click on the colour box and you will be presented with a colour picker. If you want to use a custom colour not available in the colour picker you can type a colour code in the field, the field uses the HTML/Hex colour format.

