...
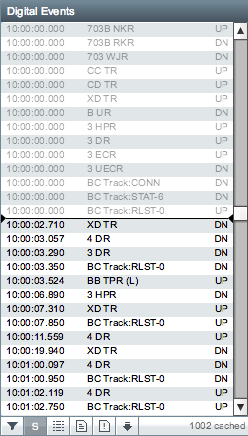
The toolbar below the list of digital events contains several buttons:
- Filter Channels
- Show Initial States
- Enable Time Spaced Mode
- View Original Hour (Events) File
- View Original System Log File
- Pull Latest Events From Logger
...
Initial state events are events which do not represent a transition (eg: UP to DOWN) but instead reflect the current state of a channel. There are various sources of initial state events but they are typically found on the hour on sites which have an SA380 logger associated with them. They are shown in the events list in grey to distinguish them from normal transition events. When the list cursor moves over a state event it will not typically trigger any changes on the map if it is visible because the state event should match the current state of the channel.
Enable Time Spaced Mode
View Original Hour (Events) File
Pressing the view original hour (events) file button will open up a new window in your web browser with the original hour file which the digital event data came from.
...
The original hour file is displayed as raw text in the browser and can be saved for offline viewing.
| Info |
|---|
The original hour files are only available for sites with an SA380 or SA380 TX logger which has been configured to download hour files. |
...
The original system log file is displayed as raw text in the browser and can be saved for offline viewing.
| Info |
|---|
The original system log files are only available for sites with an SA380 or SA380 TX logger which has been configured to download system log files. |
...
| Info |
|---|
This feature is only available on sites with an SA380 or SA380 TX logger which is configured to be dialled. |
Bookmarks
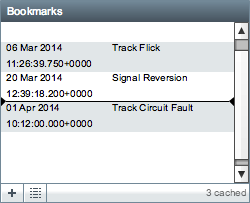
The bookmarks widget displays a lit of bookmarks
- Create Bookmark
- Enable Time Spaced Mode
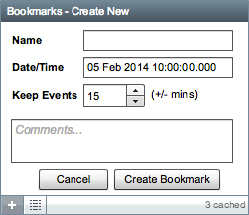
Create Bookmark
Capture Traces
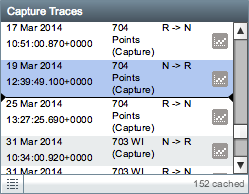
The capture traces widget displays a list of capture traces. Clicking on the graph button next to the capture trace will open up the Captures module and display the selected graph.
For more information, see Captures.
Alerts
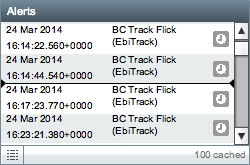
The alerts widget displays a list of alert raises. Clicking on the clock button next to the alert raise will open up a dialog which shows a list of historical alert raises for the selected alert.
For more information, see Alerts.
Map
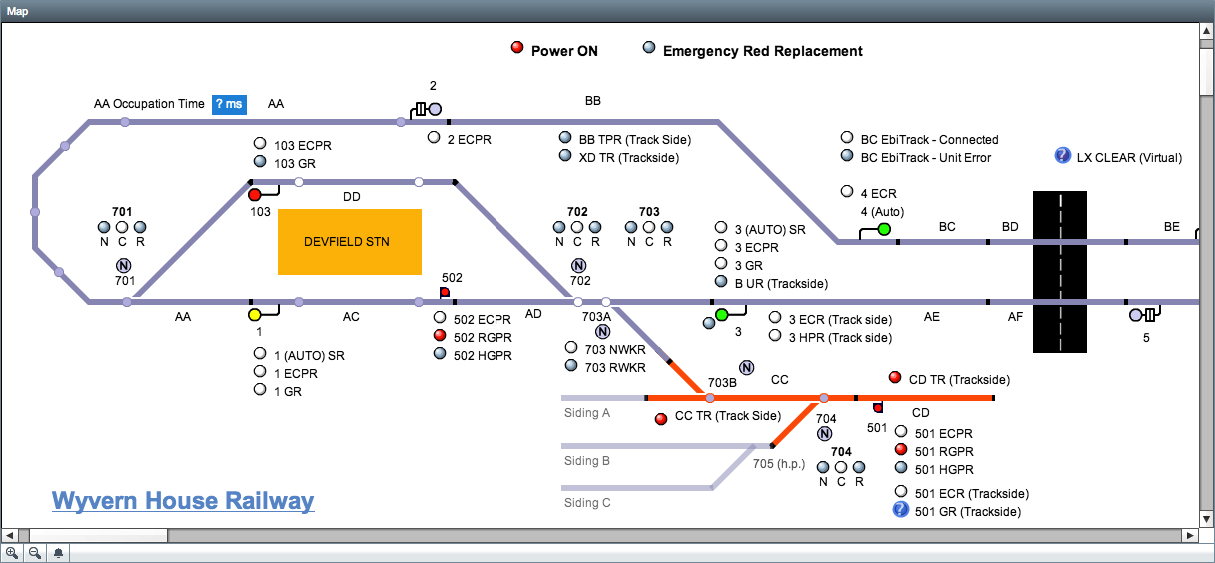
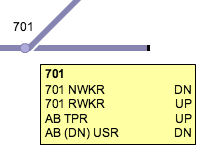
When you hover the mouse cursor over objects on the map you will see a tooltip box appear nearby. The tooltip contains the name of the object in bold text along with a list of channels associated with the object and their current state (UP, DN or ?).
...
