Audio Frequency (FS2500/FS2600) Track Circuit Applications
Overview
The VTi21 can be used to monitor FS2600 audio track circuits. The VTi21 is capable of monitoring two FS2600 track circuits in parallel. This data is made available on the RS485 bus connected to a suitable Mpec master logger (typically an SA380TX). In some applications where a suitable Mpec logger is not available, the 4-20mA output may be used to provide track occupation RCM on channel 1.
Installation
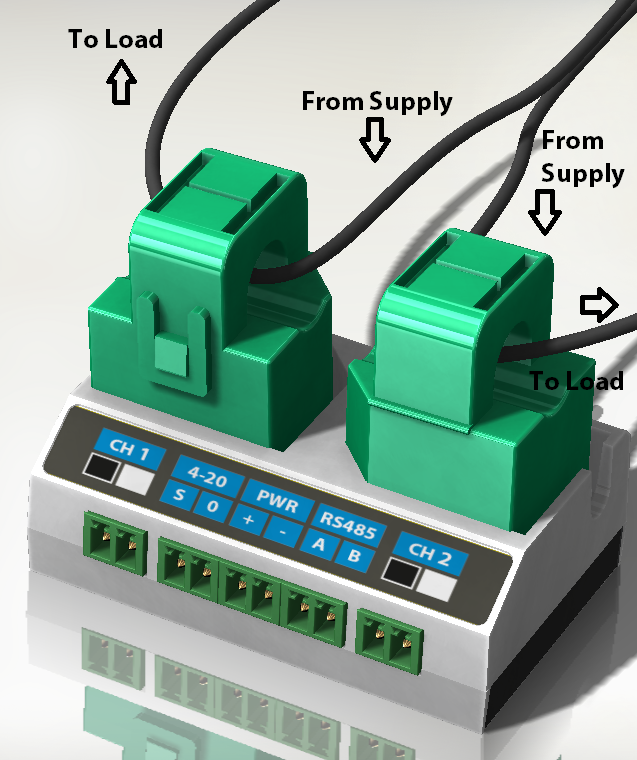
To monitor two FS2600 track circuits, the receiver feed must be fed through the split core CT on the relevant channel. The direction of current flow is not significant in the CTs.
Outputs
The following data is available from the sensor. Each value is calculated at a rate of 1 measurement every 417ms, and can be recorded by the data logger according to standard acquire on change rules. The 4-20mA output is only available for channel 1.
| Quantity | Typical Range | Units | 4-20mA | RS485 |
|---|---|---|---|---|
| FS2600 Primary Frequency | 388.8 to 508.8 | Hz | ||
| FS2600 Center frequency current | 0 to 1000mA | mA | ||
| Lower Side band current | 0 to 1000mA | mA | ||
| Upper Side band current | 0 to 1000mA | mA | ||
| Total RMS Current | 0 to 1000mA | mA | ||
| In Band Current (in 300..600Hz band) | 0 to 1000mA | mA | ||
| Full FFT Magnitudes | 4.8 to 1228.8 | Hz | ||
| Predominant frequency detected | 4.8 to 1228.8 | Hz | ||
| Input Channel Gain | 1 to 32 |
How Does it work
The FS2600 consists of a transmitter and a receiver which are connected to the rail set in the UK as illustrated below:

The transmitter generates a Frequency Shift Keyed (FSK) signal which is fed to the rails at one end of a track circuit. This output consists of a lower frequency and an upper frequency which is modulated at 15.6Hz. The receiver is connected to the rails at the far end of the track section and determines that the signal it receives is of the correct form, by performing Fourier analysis of the signal. It will look at parameters derived from this analysis (frequency components & energy level) to determine whether the line is clear. The output from this analysis will cause the relay to be energized as appropriate. Fourier analysis will convert an analogue signal from the time domain to the frequency domain. The following illustrates the time domain signal:

and, the frequency domain signal:

This data is taken from an FS2600 connected on the Laboratory bench, and shows peaks at the center frequency, in this case 403.2Hz, and the first order side bands (387.6 and 418.8Hz).
The FS2600 comes in ten variants with primary frequencies of:
| 388.8 | 403.2 | 417.6 | 432 | 441.6 | 456 | 470.4 | 484.8 | 494.4 | 508.8 |
For ease of both installation and configuration, the VTi21 will determine which is the most prevalent center frequency from the above possibilities and latch onto it for future processing.
The VTi21 performs a similar analysis to generate the values required for RCM. The VTi21 runs the following steps:
- Low pass filter (passband 0 to 615Hz)
- Data is sampled at 2457.6Hz.
- FFT
- Hanning Window
- 1024 point FFT (giving 2.4Hz resolution)
- Signal RMS calculation
- Determination of the primary FS2600 frequency
- Current calculations for Upper side band, Lower Side band and center frequency.