Asset View / Asset Health Playback
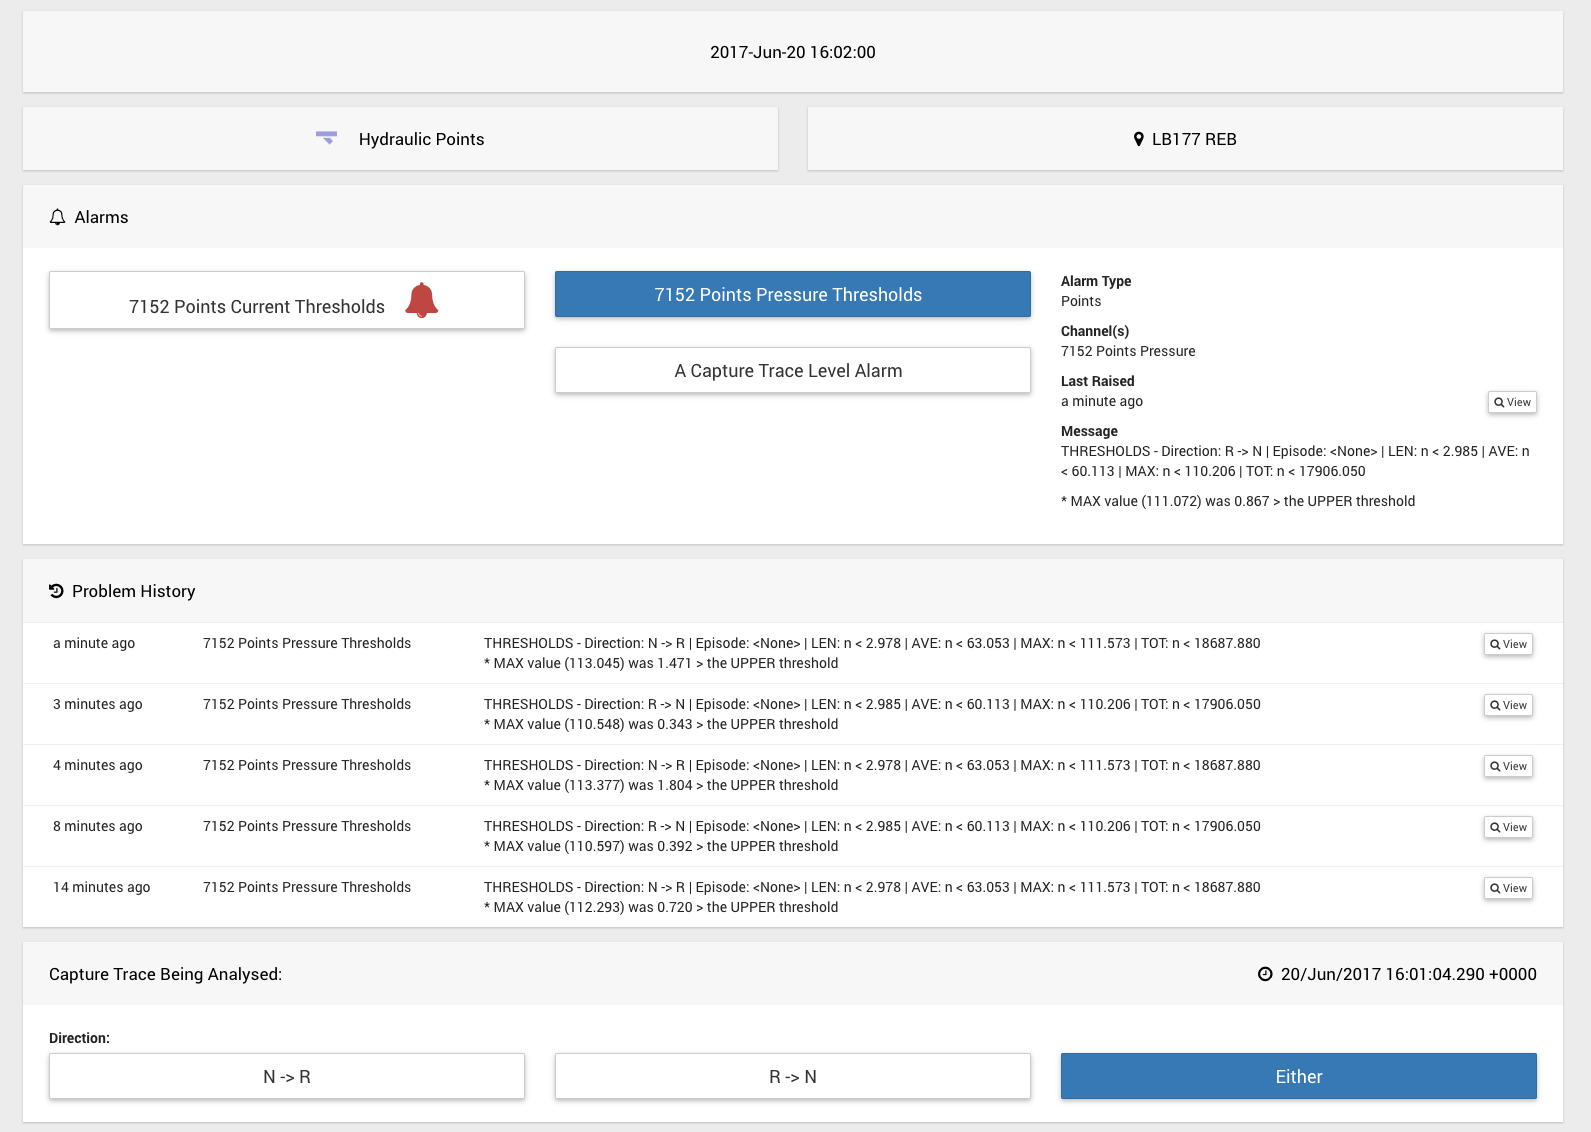
This page displays some key asset details including alarms associated with that asset.
The site can be clicked on to navigate to the site page.
The time at the top of the page can be clicked on to change the selected time that other aspects of this page will be relative to.
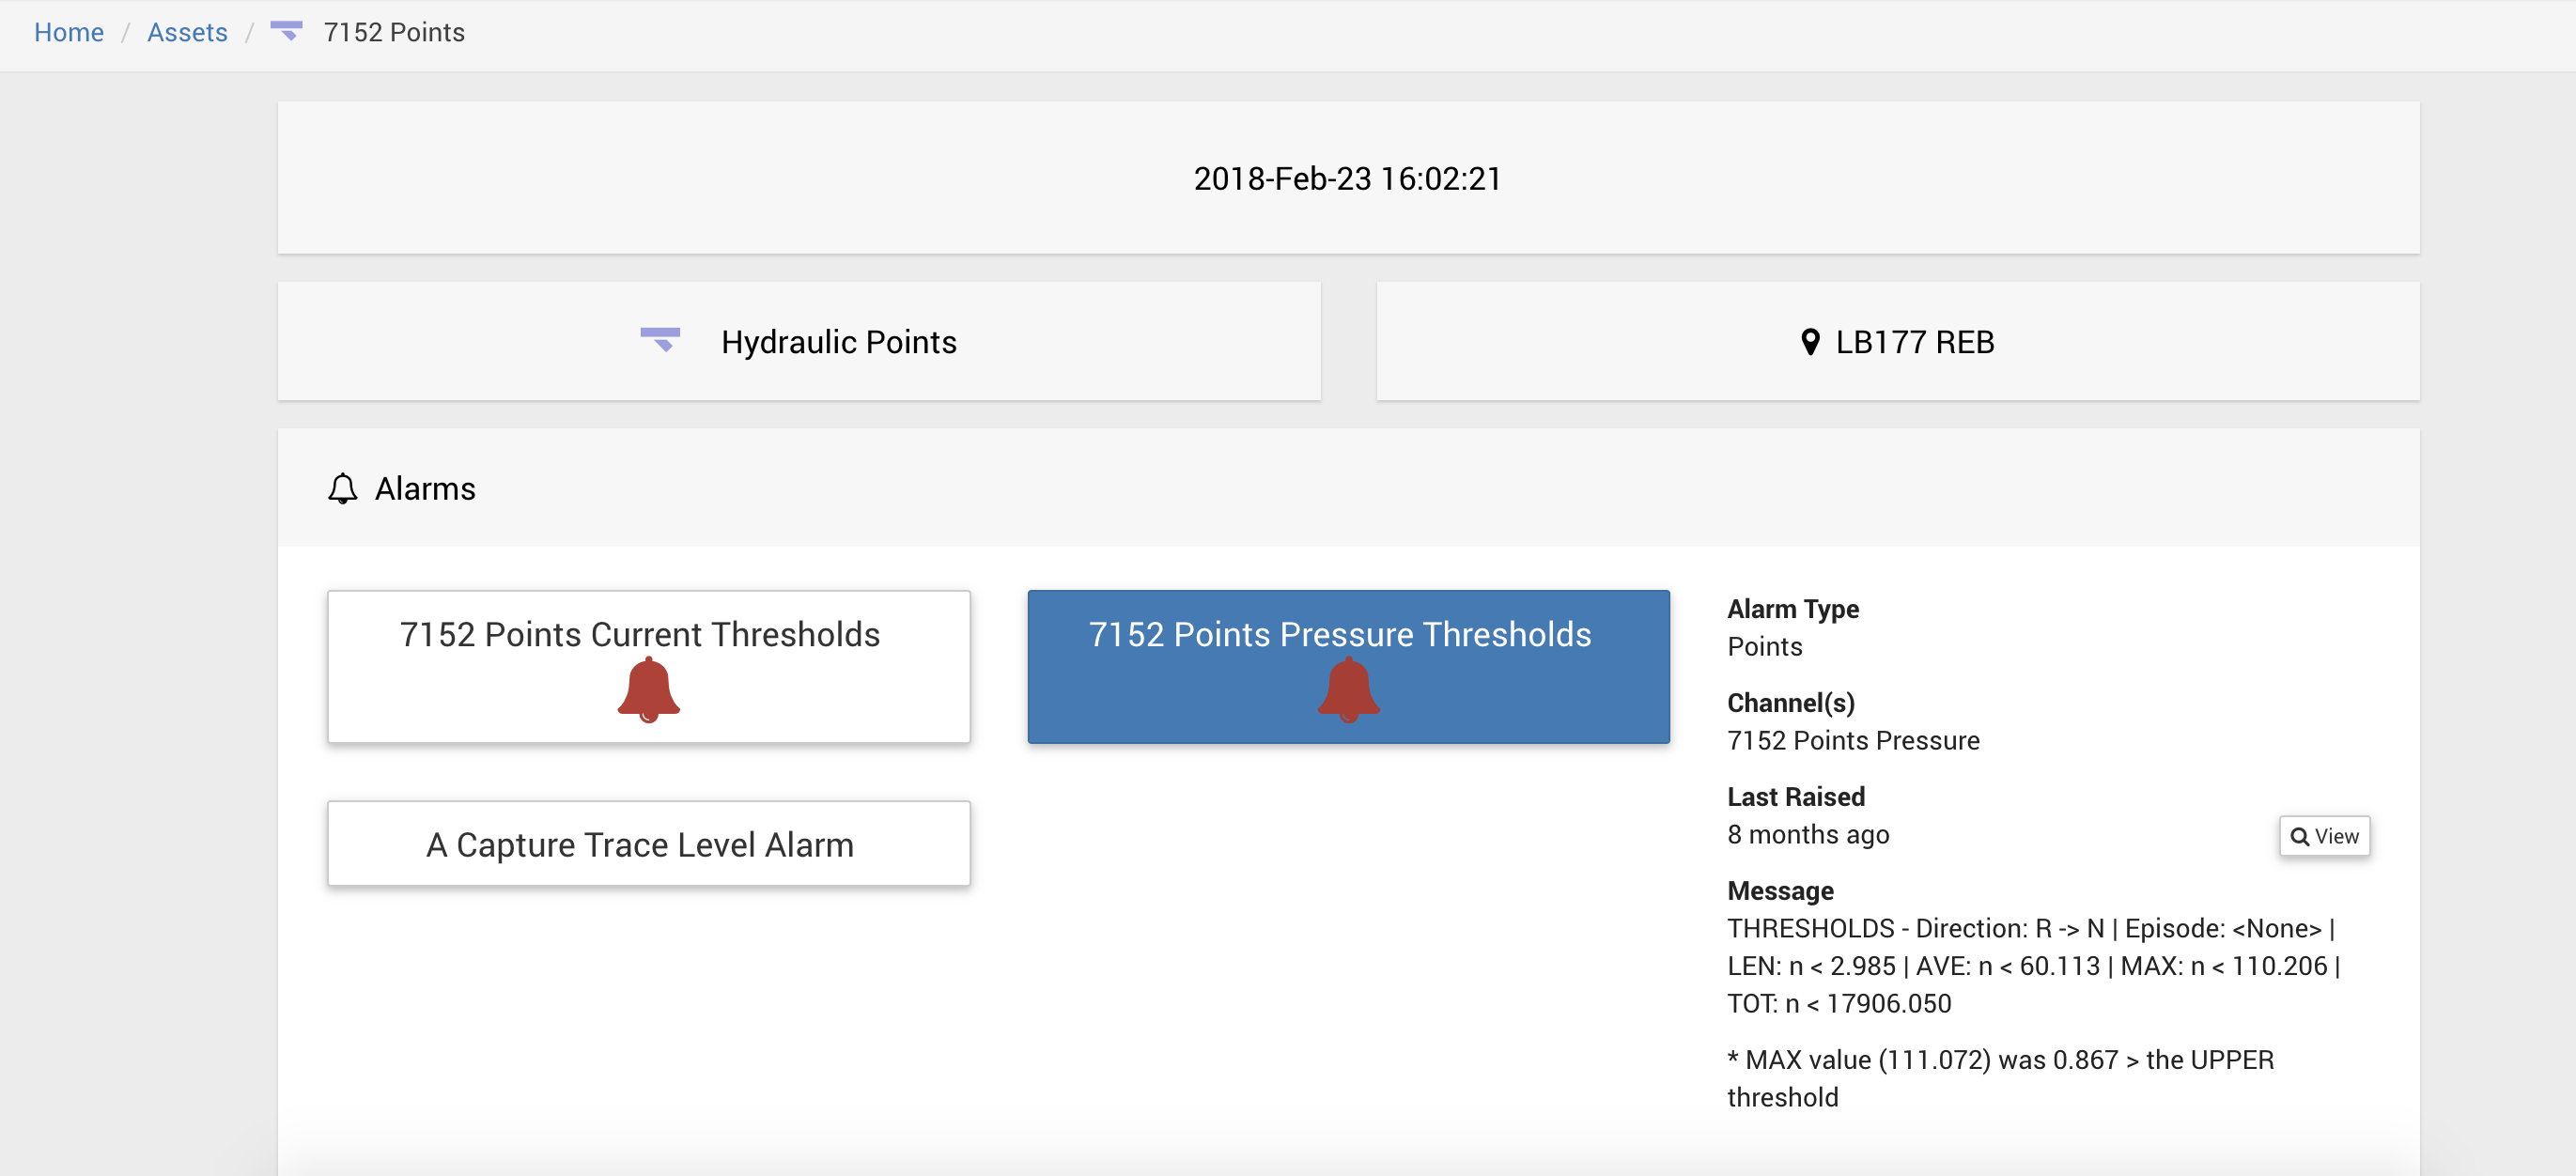
Alarms that are currently active show a flashing red bell icon.
If an asset has multiple alarms associated with it and one or more of those alarms is currently active, then that asset will be automatically selected.
Selecting an alarm shows more details to the right including the time that the alarm was last raised and the alarm raise message if that alarm is currently active.
If the selected alarm has been raised previous to the selected time at the top of the page, then you can click the view button to navigate to the alarm raise page for that raise.
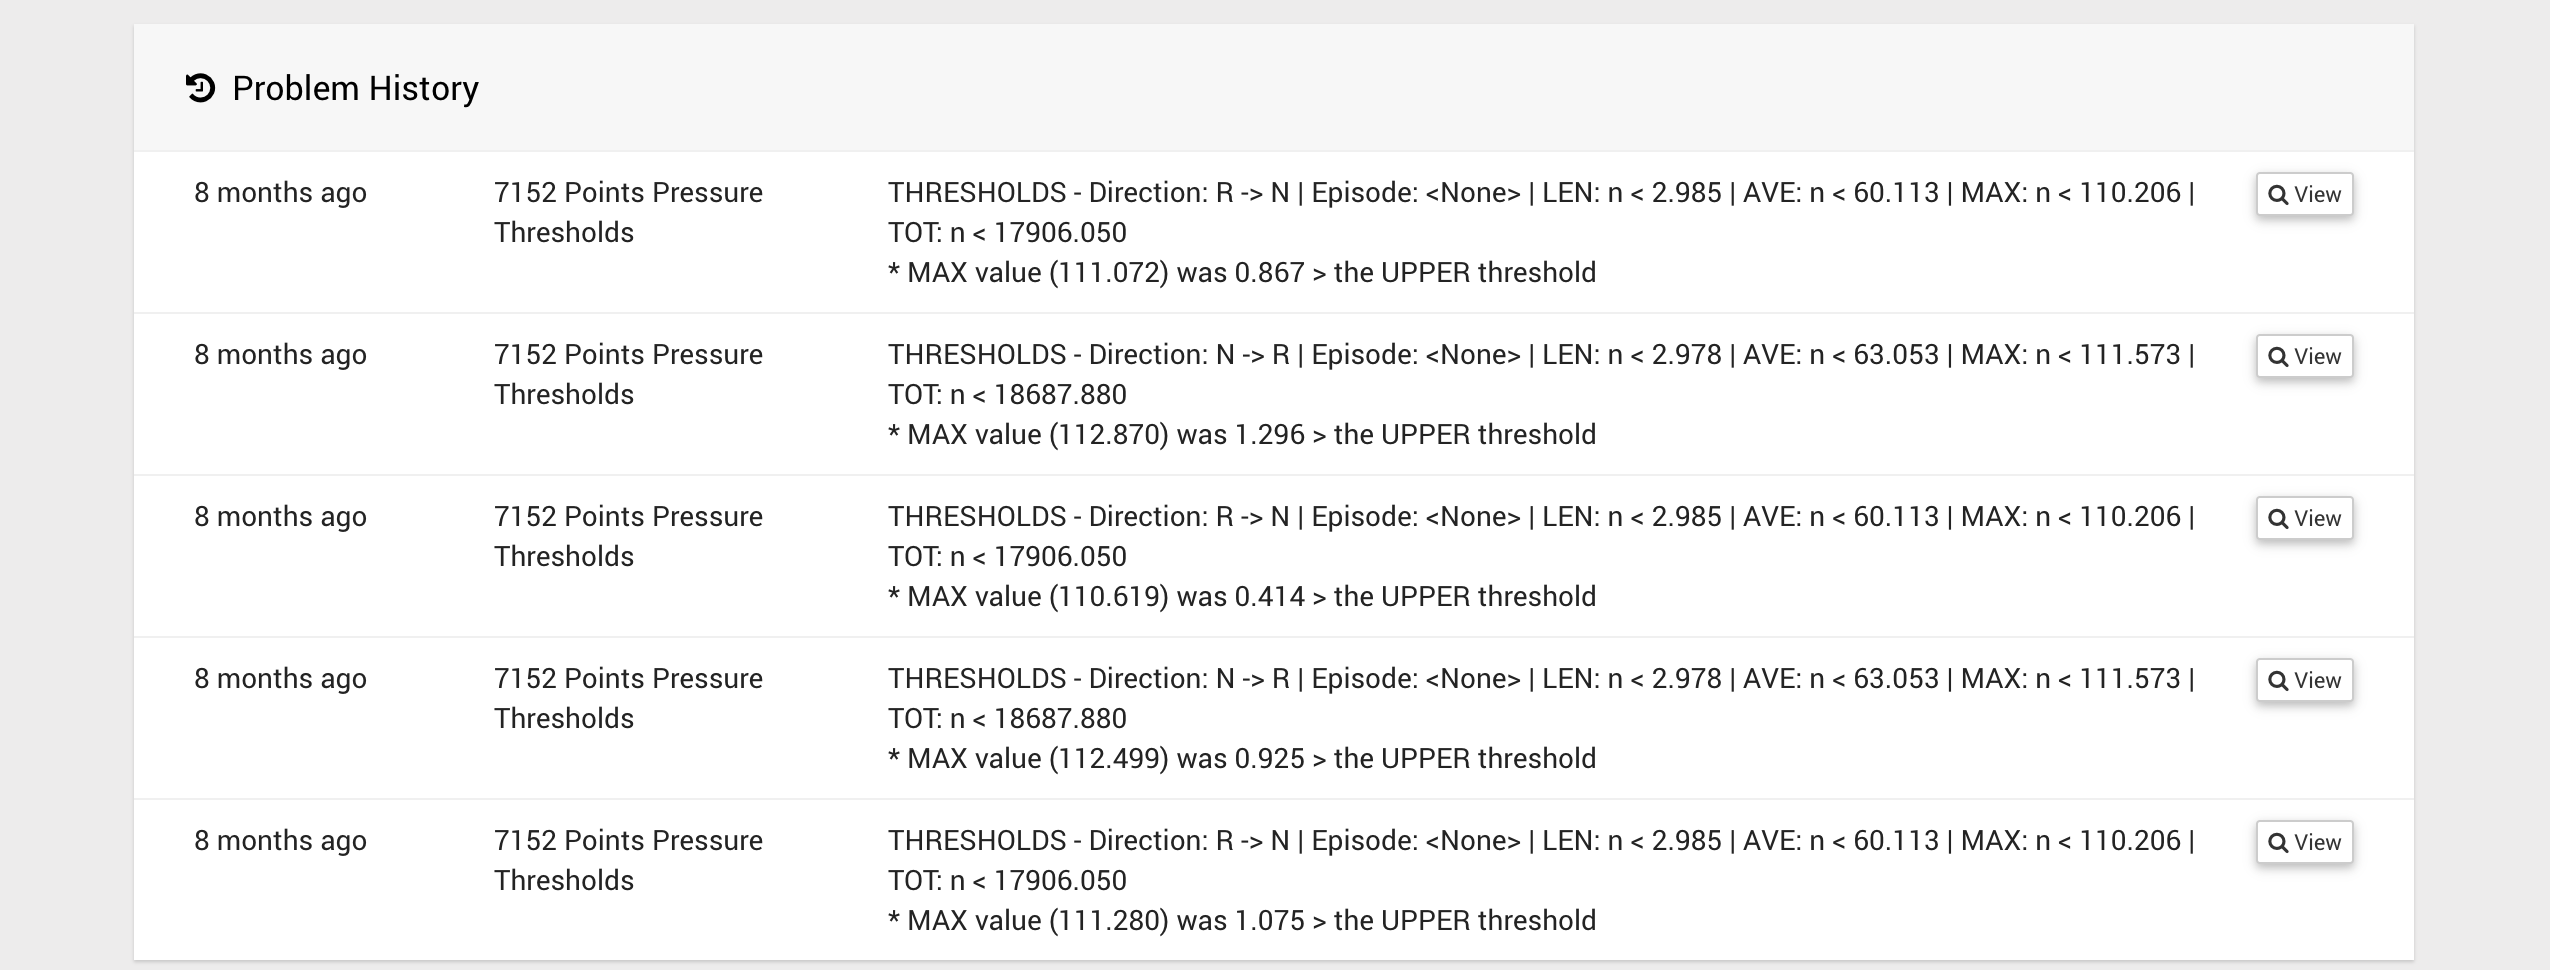
Below the alarms section for that asset is the problem history for that asset. This shows the most recent alarm raises for that asset, which can be from any alarm associated with that asset.
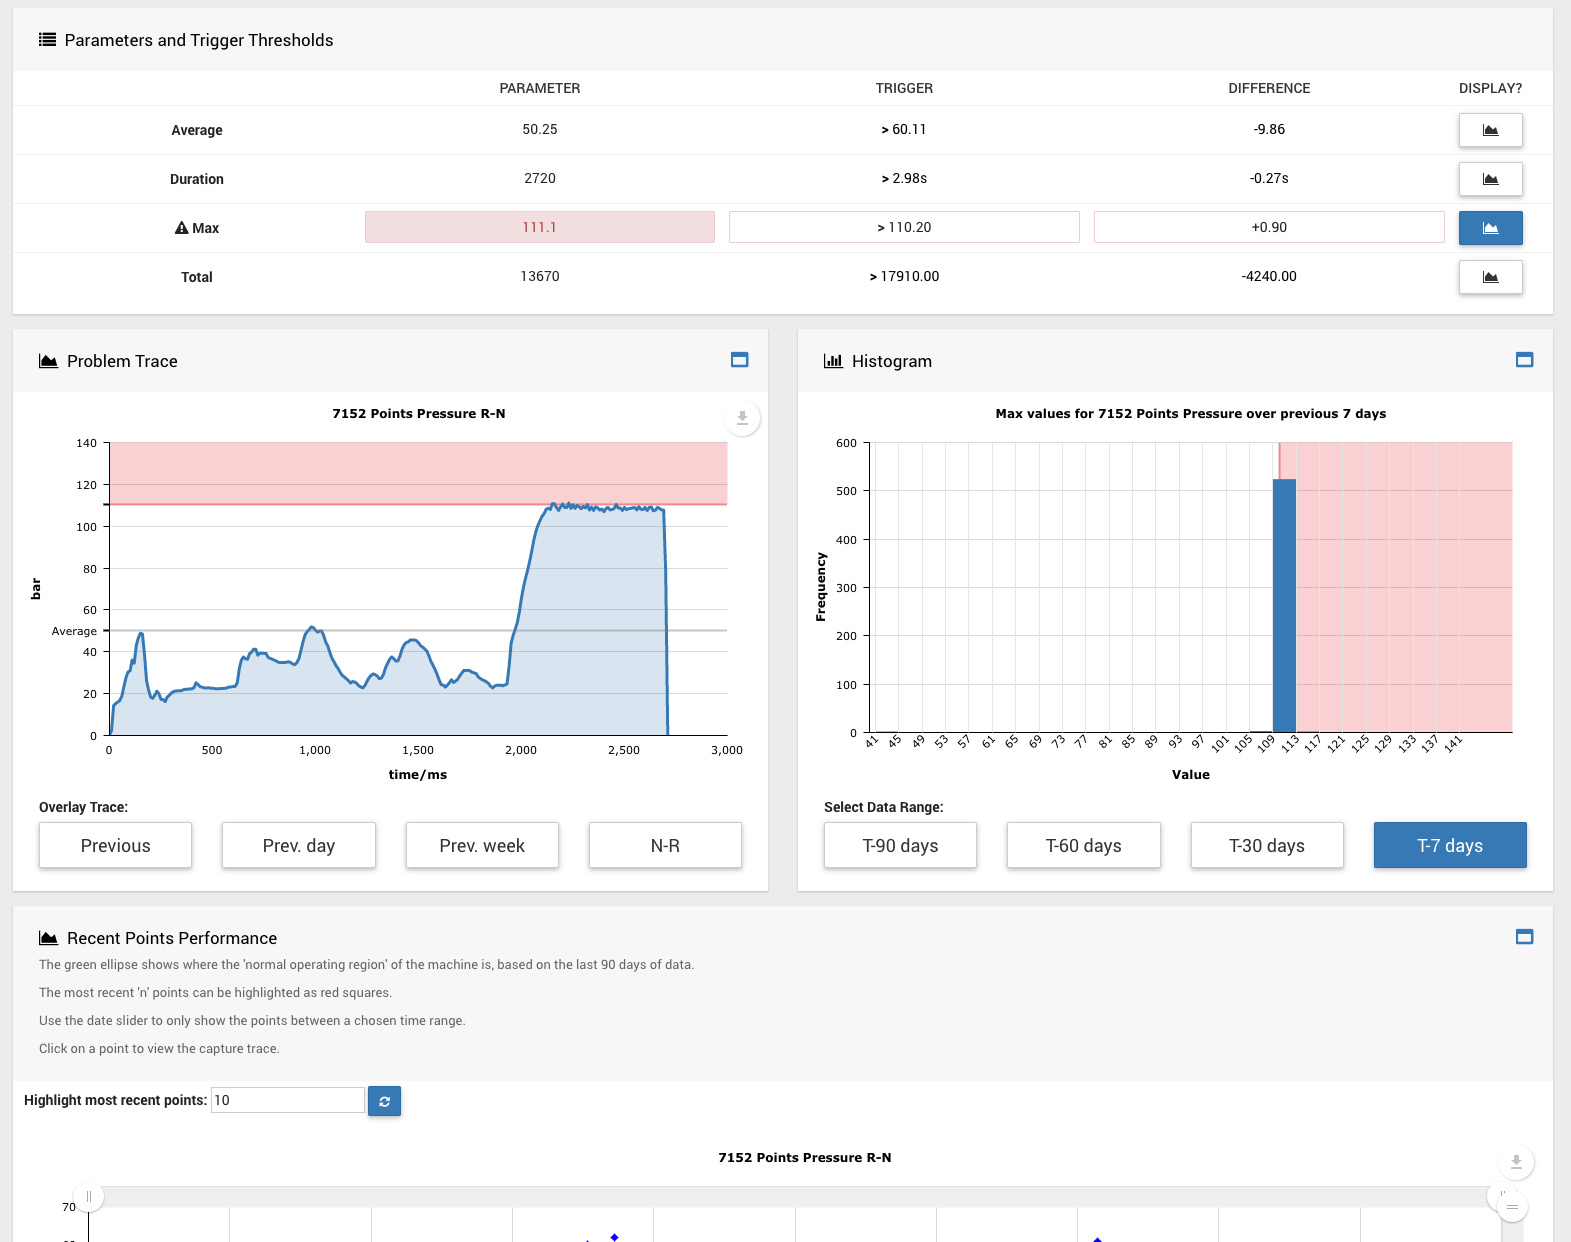
If the alarm selected is raised and has the ability to show graphs for investigating this raise, these will also be shown.
The below figure is an example of what would be shown for a Points Alarm that is currently active.
If a capture trace levels alarm has been selected, then graphs similar to the below figure will be shown:
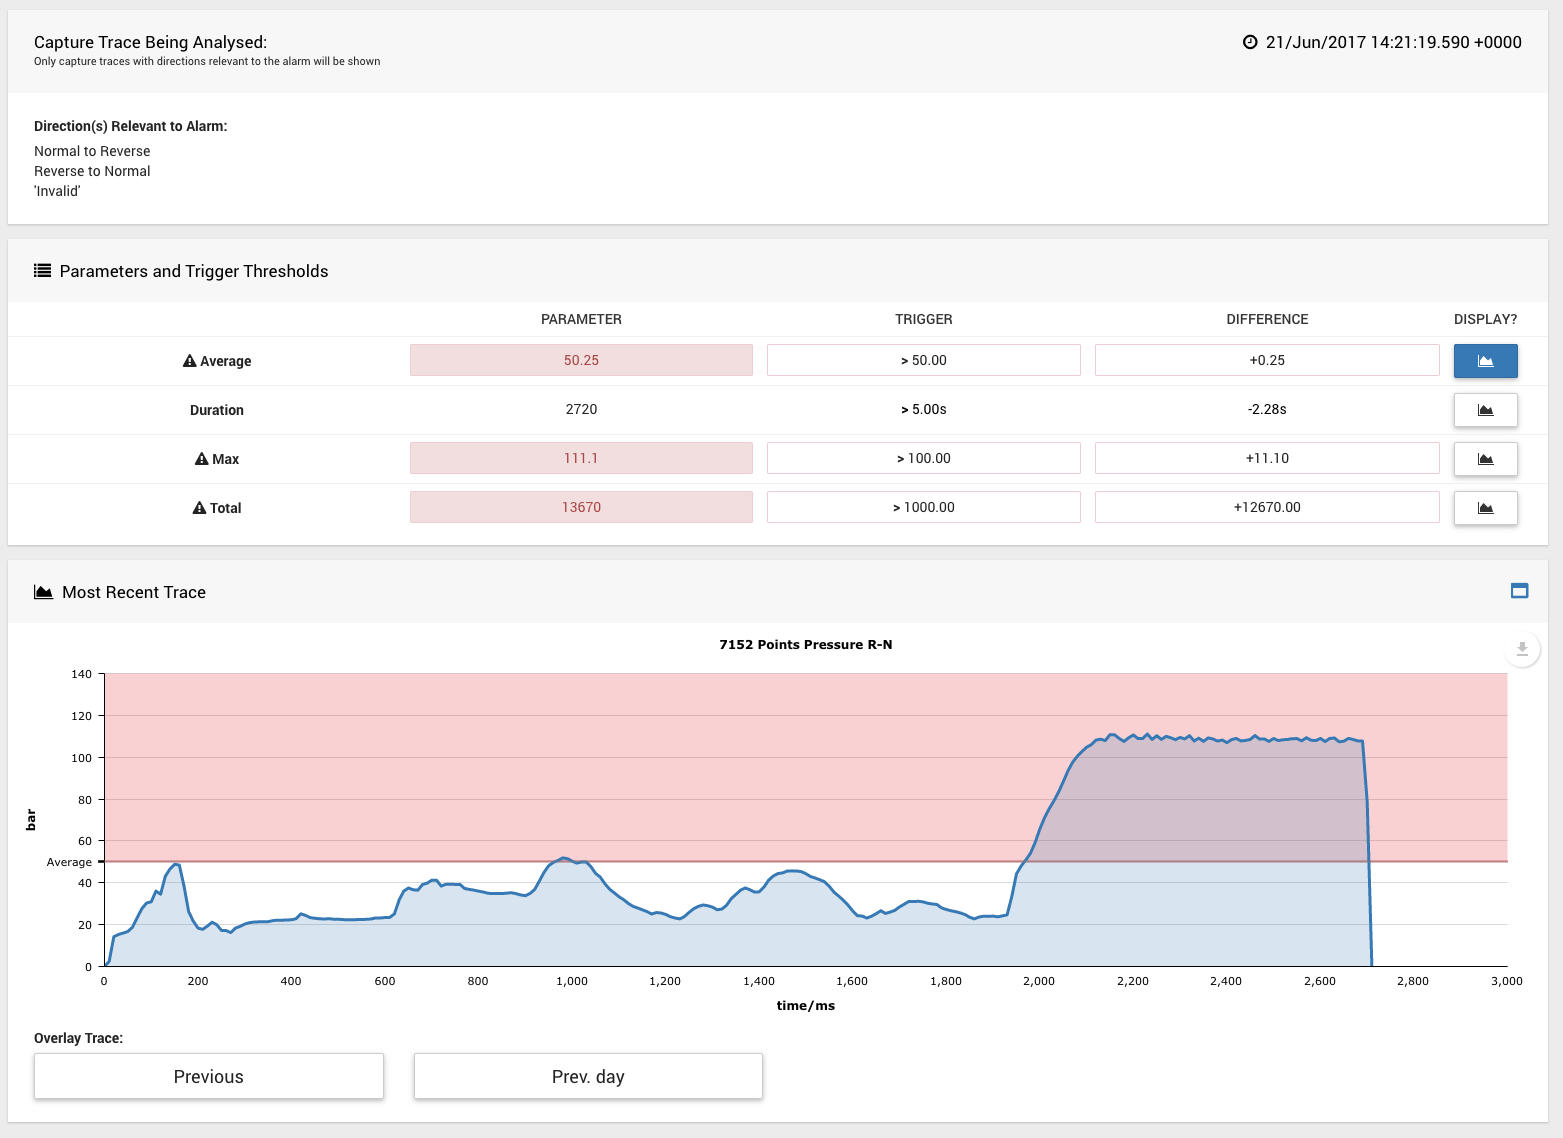
Capture trace level alarms have a specific direction choice (Invalid, Normal to Reverse, Reverse to Normal and Any).
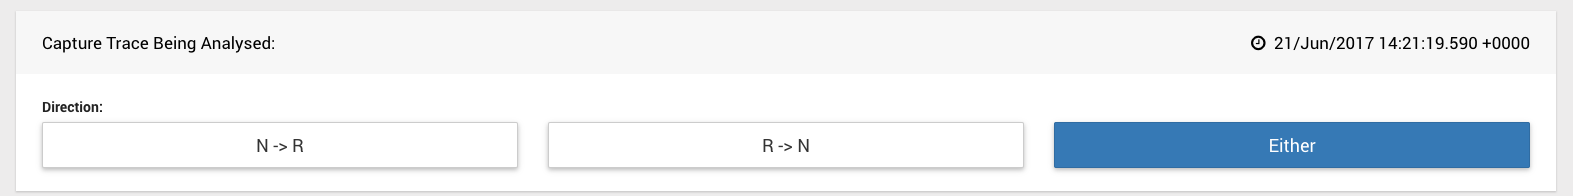
Therefore, capture traces are filtered by this direction choice, when showing the most recent capture trace relative to the selected time at the top of the page.
If an alarm is not currently active, then these alarm relevant graphs will still be shown, except that the most recent trace compared to the selected time at the top of the page will be shown.
Depending on the alarm selected, filters can be applied to the most recent trace being shown, for example, a swing direction if a Points Alarm is selected.
The selected time at the top of the page can be used to see how the asset looked at a time in the past.
If the selected time is before the currently active alarm time, then the alarm will no longer be shown as 'currently active'.
Similarly, the last raised time, problem history and the extra graphs analysing the most recent capture trace, will all be relative to the selected time.
This means that this page can be used as a 'playback' page for the asset as well as viewing it in its current state.