...
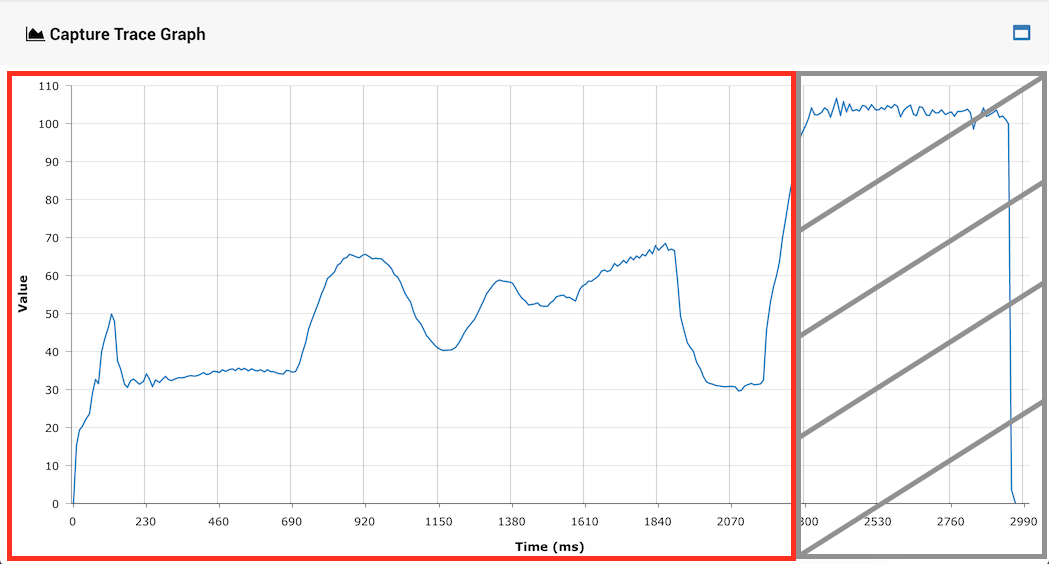
For hydraulic pressure, data on swing time, average pressure (excluding clamp lock movement) and peak pressure (excluding clamp lock movement) is shown.
The clamp lock movement region of a typical trace is shown below under the grey region. The red-boxed region is what would be used to calculate the average and peak pressure.
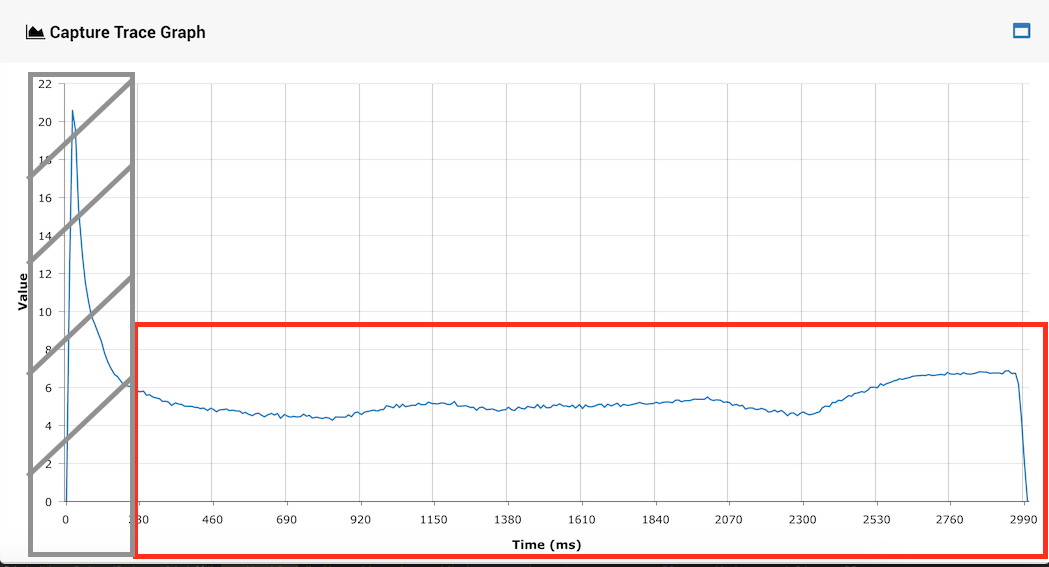
For electric current, data on swing time, average current (excluding the inrush current) and peak current (excluding the inrush current) is shown.
The inrush current region of a typical trace is shown below under the grey region. The red-boxed region is what would be used to calculate the average and peak current.
Every point on a graph is a daily averaged value.
...

